≡ Menu

Carolina is #1… in percentage of rushing yards not by running backs

The Carolina Panthers have rushed for 982 yards this year, an average of 109.1 per game.  That ranks 15th in the NFL, and just a hair above the league average rate of 108.1 rushing yards/game.  But the Panthers don’t have anything resembling a traditional ground game: of those 982 yards, starting running back Jonathan Stewart has just 350 of them, while quarterback Cam Newton has 341 rushing yards, the most of any quarterback in the NFL in 2017.

In addition, wide receivers Curtis Samuel, Damiere Byrd, and Russell Shepard have combined for 87 yards; that’s the third-most rushing yards in the league for any team behind the Rams (Tavon Austin) and Raiders (Cordarrelle Patterson) among non-QB/non-RBs. In fact, Panthers running backs are averaging just 61.6 rushing yards per game, the fewest in the NFL.

This is hardly shocking, of course: Newton has been an incredible rushing threat since he arrived in the NFL in 2011. But it’s still interesting to see the numbers and understand that the Panthers are an above average team in total rushing, but dead last in rushing by running backs. The table below shows each team’s rushing yards in 2017 through nine weeks, both by running backs only and overall. Here’s how to read the table below. The Jacksonville Jaguars rank 1st in running back rushing yards, with 145.1 per game. The Jaguars also rank 1st in total rushing yards per game, at 166.5. For Jacksonville, 87.2% of their rushing yards have come from running backs. The Panthers rank last in both running back rushing yards per game and percentage of rushing yards by their running backs. [continue reading…]

{ 7 comments }

Something Is Wrong With Cam Newton

It doesn’t take an expert to realize that something is wrong with Cam Newton. Whether the cumulative effects of the various injuries he has suffered throughout his career have taken a toll on him, or there’s a specific injury causing a problem, it’s now clear that Newton is a shell of his former self.  In Newton’s last 16 games, he’s thrown just 16 touchdown passes… while throwing 16 interceptions.  In Newton’s MVP season of 2015, he averaged more than two passing touchdowns per game, and just over half an interception per game.  The Panthers scored just 9 points against the Bills last week, but the bottom fell out yesterday.

Facing what had been a historically bad Saints defense, Newton produced the single-worst game of his career:  He threw 26 passes but gained just 167 yards, while taking four sacks and losing 28 yards.  That’s an ugly 4.6 NY/A, but it gets much worse when you realize he had no touchdowns and three interceptions.  That translates to a 0.13 ANY/A average, the worst statistical performance of Newton’s career. Again: this came against the Saints.

This game also dropped Newton’s ANY/A over his last 16 games to below 5.00.  That’s right: over Newton’s last 16 games, he has the following stat line: 279/520 (54%), 3,528 yards (6.8 Y/A), 16 TDs, 16 INTs, 42 sacks for 337 yards, and 4.97 ANY/A. The graph below shows Newton’s single game ANY/A (in blue) and trailing 16 game ANY/A (in black) for each game of his career (playoffs excluded): [continue reading…]

{ 14 comments }

Pre-Week 17 WP: Awards Banquet

This week at the Washington Post, I hand out my 2015 awards, including my thoughts on the Carson Palmer/Cam Newton debate.

Most Valuable Player: Tie (Cam NewtonCarson Palmer)

Choosing between Newton and Palmer is an exercise in pickin’ nits. The two have drastically different styles and playing in very different offenses, making it difficult to compare the two players. Arizona would be worse with Cam Newton, and Carolina would be worse with Carson Palmer, so both teams should be happy that they have the co-most valuable players of the 2015 season.

You can read the full article here.

As always, please leave your thoughts in the comments. One point to open up the discussion. Is declaring the MVP vote a tie akin to fence-sitting and worthy of criticism? Or does it make sense to acknowledge that football is a far too complicated game to try to derive meaningful bits of information out of minute differences?

{ 5 comments }

Checkdowns: Carson Palmer and MVP Voting

Since twitter limits me to 140 characters, and I’m having fun debating with guys like Bryan Frye (@LaverneusDingle) and Adam Hartstad (@AdamHarstad), I thought I’d crunch some numbers here.

Is Carson Palmer the best choice for MVP this year? Let’s put aside the Cam Newton argument and just focus on Palmer’s place in post-merger history.   As Adam pointed out, 2015 Carson Palmer is currently 7th on the list of Adjusted Net Yards per Attempt leaders, and the six players in front of him all won the AP MVP (that would be Peyton Manning 2004, Aaron Rodgers 2011, Dan Marino 1984, Tom Brady 2007, Manning 2013, and Rodgers 2014).

Of course, ANY/A is biased in favor of modern players, so let’s look at ANY/A+. Here, he doesn’t drop as far as you might think: Carson is still tied for the 11th best season since 1970, and a few non-AP MVPs sneak in there ahead of him (Mark Rypien 1991, Randall Cunningham 1998, and a quarterback who lost to another quarterback a having historic season: Montana ’84 and Ken Anderson 1981). [continue reading…]

{ 32 comments }

Cam waits for the 4th quarter to arrive

Cam waits for the 4th quarter to arrive

In the 4th quarter and in overtime this year, Carolina quarterback Cam Newton has been really, really good.  Newton has completed 54 of 83 passes for 733 yards with 6 touchdown throws and just one interception, along with five sacks for -35 yards.  Newton is therefore averaging an impressive 8.78 Adjusted Net Yards per Attempt after 45 minutes have gone by in each game; among quarterbacks with at least 40 pass attempts this year, that’s the second best average in the league, a hair behind Tom Brady (8.81) and just ahead of Carson Palmer (8.59). (Although I will note that noted clutch quarterback Tony Romo is averaging 9.77 ANY/A on 21 4th quarter/overtime pass attempts this year.)

Below are the passing stats from every quarterback this year in the 4th quarter and overtime so far in 2015: [continue reading…]

{ 7 comments }

Predictions in Review: NFC South

During the 2013 offseason, I wrote 32 articles under the RPO 2013 tag. In my Predictions in Review series, I review those preview articles with the benefit of hindsight. Previously, I reviewed the AFC West, the NFC West, and the the AFC South. Today, the NFC South.

Who Will Win 2013 Head Coach of the Year, July 25, 2013

For reasons that are not quite clear to me, I have an unusual fascination with the Coach of the Year award. There’s no harder award to predict in all of sports, since the winner is essentially the coach of the team that had the least predictable (in a good way) season. Still, I threw my hat into the ring in 2014 and predicted that Sean Payton would win Coach of the Year. Here is what I wrote in July:

Rob Ryan is now in charge of a defense that ranked last in yards allowed, net yards per attempt allowed, rushing yards allowed, rushing yards per carry allowed, first downs allowed, Expected Points Added, and defensive DVOA. The 2012 Saints also ranked 31st in points allowed. Ryan himself won’t fix that, but first round pick Kenny Vaccaro should begin to help the problem secondary.

But the real reason for optimism is the always explosive Saints offense. Drew Brees, Jimmy Graham, and Darren Sproles are three of the more unique players in the NFL, and help give the Saints an outstanding passing offense. Of course, New Orleans passing attack was great before either Graham or Sproles arrived, as the Brees/Payton engine (with a dash of Marques Colston and Lance Moore) is at times unstoppable. …

Predicting who will win AP Coach of the Year is a fool’s errand, but I’m willing to put my chips on Brees and Payton leading the Saints to the playoffs in a “bounceback” year. The real question is whether that will be enough to convince the voters to select Payton.

As it turned out, Payton did lead a resurgent Saints team from 7-9 in 2012 to 11-5 in 2013; unfortunately for him, a playoff berth was not enough to get him Coach of the Year. That honor instead went to Ron Rivera, although in my eyes, Andy Reid was an immensely more deserving choice.

What can we learn: In week 16, the Panthers defeated the Saints on a touchdown pass with 28 seconds left in the game; had New Orleans won that game, the Saints would have finished 12-4 and won the division and a first round bye, knocking Rivera’s Panthers down to the 5 seed. Would that have been enough to swing the COTY award to Payton? Probably not, although it likely would have meant Reid would have won the honor. The Coach of the Year award remains impossible to predict.
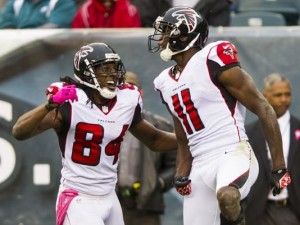
Did you just grab my torch?

Did you just grab my torch?.

Julio Jones and Roddy White star in Stealing The Torch, July 31, 2013

My other three NFC South posts were more walks down memory lane than predictions. The Falcons post was a look at other star wide receiver tandems that were similar to Julio Jones and Roddy White in 2012. This was a fun way to look at comparable receivers, but there was nothing fun about the Atlanta offense in 2013.  Jones averaged 116.0 yards per game last year, but that came over just five games. A foot injury suffered against the Jets in week 5 ended what looked to be a special season: Jones was leading the league in receptions (41) and was second in receiving yards (580) at the time. White, meanwhile, had an absymal start to his season that dragged on for months.

Hamstring and ankle injuries caused White to miss three full games and hampered his production in most of the others. At the end of November, he just 20 catches for 209 yards; at that point, the Falcons were 2-9, and I won’t fault you if you put Atlanta on “ignore” for the rest of the year. But White exploded with 43 catches for 502 yards in December, joining Josh Gordon (658) and Alshon Jeffery (561) as the only players with 500+ receiving yards in December 2013.

The Steve Smith Post, August 7, 2013

In August, I decided to compile the loose odds and ends I had collected on Steve Smith over the years. When the time comes, I plan on using that post to augment Smith’s Hall of Fame case. Unfortunately for Smith, the time may be coming sooner than he’d like. On December 1st, I wrote that Smith’s poor production may have been a reason for why Cam Newton’s numbers had declined.

Smith has had largely the same role in the Panthers offense for years, so it’s not unreasonable to compare his advanced metrics from each of Newton’s seasons.  In 2013, Smith caught 58.2% of his targets, which is in line with his production from 2012 (52.9%) and 2011 (61.2%). However, Smith started running much shorter routes — according to NFLGSIS, his average reception came just 8.9 yards downfield in 2013, compared to around 12 yards over the prior two years. Smith’s YAC also decreased (which is unusual, as shorter passes tend to lead to more YAC, making this another bad sign); as a result, his yards per target dropped from 10.8 in 2011 to 8.5 in 2012 to just 6.8 in 2013.  It was a down year in a Hall of Fame caliber career. Smith turns 35 in May; unfortunately, it seems safe to suggest that the best is behind him.

Can Tampa Bay Win the NFC South With the Worst Passing Attack?, August 13, 2013

Just about everyone assumed the Bucs would have the worst starting quarterback in the NFC South. What interested me was the rest of the team. The question I posed was more trivia than analysis: how often does the team with the worst passing attack in the division wind up winning the division?

The answer: Since 1950, only nine teams pulled off that feat, with nearly half of them coming since the league moved to a four-teams-per-division-for-each-division format in 2002. No team pulled off that feat in 2013, although the Panthers ranked 3rd in the NFC South in Adjusted Net Yards per Attempt. The team that ranked last in the division was, of course, the Bucs.

The Bucs ranked 32nd in NY/A and finished the year 4-12. But remember: Tampa Bay faced the hardest schedule in the league in 2013. Early DVOA estimates project the Bucs for 7.7 wins in 2014, and there are reasons for optimism in Tampa Bay in 2014.

{ 3 comments }

Division Preview: San Francisco at Carolina

At least 400 total yards were gained in every game this season. When Nick Foles threw 7 touchdowns against the Raiders, Oakland actually out-gained Philadelphia, and the two teams combined for a season-high 1,102 yards that day. On the other end of the spectrum was San Francisco/Carolina I, when the two teams combined for just 401 yards. That first game was essentially the NFL’s version of LSU/Alabama, and I don’t think the rematch will be very different.

When these two teams take the field on Sunday, the opponent will feel familiar for a couple of reasons. One, of course, is because of the week ten match-up. But these teams are also mirror images of each other. Consider:

Kuechly and Kaepernick are just two of the many stars in this game

Kuechly and Kaepernick are just two of the many stars in this game.

{ 2 comments }

You probably didn’t know it, but Cam Newton is having a down year, at least statistically.

Year GS Cmp Att Cmp% Yds TD TD% Int Int% Y/A AY/A Y/C Y/G Sk Yds NY/A ANY/A Sk%
2011 16 310 517 60.0 4051 21 4.1 17 3.3 7.8 7.2 13.1 253.2 35 260 6.87 6.24 6.3
2012 16 280 485 57.7 3869 19 3.9 12 2.5 8.0 7.6 13.8 241.8 36 244 6.96 6.65 6.9
2013 11 208 337 61.7 2353 17 5.0 9 2.7 7.0 6.8 11.3 213.9 31 235 5.76 5.58 8.4

Carolina’s defense has been outstanding, of course, so an 8-3 record and a seven-game winning streak have overshadowed any flaws in Newton’s game. The Panthers have held an average lead of 5.05 points per second this year, the third best rate in the league. As a result of that high Game Script, Newton is asked to do less on offense, but that doesn’t explain the declining efficiency numbers. Newton’s taking slightly more sacks and his rushing numbers are down across the board, but the biggest decline comes with respect to yards per completion.
[continue reading…]

{ 16 comments }

New York Times: Post-Week 6, 2013

This week at the New York Times, I look at the hard-to-read Carolina Panthers. Carolina has won six of nine games since I declared them a sleeping giant. On the other hand, the team has a losing record this season and has beaten teams with a combined one victory. In other words, as tends to be the case, you see what you want to see when looking at the Panthers.

We will have to check back in three months for the final answer, but there are signs that the Carolina Panthers, a disappointment at 2-3, could become one of the N.F.L.’s breakout teams.

First, Coach Ron Rivera, quarterback Cam Newton and the Panthers will have to overcome a well-earned reputation as a group that cannot beat good teams; that cannot win close games in the fourth quarter; and that is too conservative on fourth down. As a rookie in 2011, Newton dazzled N.F.L. fans, but the Panthers finished 6-10. Carolina was 1-7 against teams that finished with a winning record, and the Panthers won once in nine tries when they had the ball and were trailing by one score in the fourth quarter.

The same issues cropped up last year. Carolina started 3-9, with an 0-7 record in games decided by 7 or fewer points and a 1-5 mark against teams that finished with a winning record. With the season effectively over at the three-quarters mark, the Panthers finished 4-0, ensuring that Rivera would be back for another season.

This season, the Panthers defeated the winless Giants, 38-0, in Week 3 and won in Minnesota against the 1-4 Vikings, 35-10, on Sunday. But the Panthers have blown two fourth-quarter leads. And after a loss to Arizona, Carolina was 5-15 since 2011 in games that were within one score entering the fourth quarter, the worst mark in the league.

But there is reason to be optimistic about the Panthers. Carolina has outscored its opponents by 41 points this season, the most by a 2-3 team since 1921. There has been a strong relationship between points differential and the future performance of 2-3 teams. Of all the 2-3 teams from 1990 to 2012, 11 have outscored opponents by 20 or more points, with an average points differential of 28.5. Over the rest of the season, those 11 teams won 64.9 percent of their games.

You can read the full article here.

{ 1 comment }

So you're telling me they were 1-15 last year?

An old friend of mine was always mildly irked at the praise thrown at Bill Parcells for turning around moribund franchises. In reality, making a team with a terrible record respectable isn’t all that challenging. Where Parcells added value was in making his good teams great, not in making terrible teams mediocre.

In 1992, one year B.P., the New England Patriots were 2-14, in part thanks to a 1-5 record in one-score games. Throw in some regression to the mean and the first pick in every round of the ’93 draft, and going 5-11 in 1993 wasn’t so much of an accomplishment as it was pre-ordained.

In 1996, one year B.P., the Jets went 1-15. New York was a horrific 0-7 in one-score games. Throw in the #1 pick in every round, and they were an attractive target. Parcells did do a masterful job cleaning up the mess left by Rich Kotite, but getting them to 9-7 looked very impressive in large part thanks to the poor fortunes of the team the prior year.

The Big Tuna again went after the low-hanging fruit again when he took over as the Executive Vice President of Football Operations in Miami (it is here my old friend would get particularly annoyed, noting that Parcells found a way to have his cake and eat it too. If the Dolphins succeeded, Parcells would have “done it again.” Had they failed, well, he wasn’t the coach.) He took over a 1-15 team that was bad but not 1-15 bad; they had faced one of the harder schedules in the league and gone 1-6 in close games. Enter Jake Long, Chad Pennington, and the Wildcat, and the Dolphins went 11-5. Parcells did it again!

In any event, that’s just background. The 2013 Panthers are the real topic today — and they are the lowest hanging fruit any potential coach has seen in decades. Consider:

  • The Panthers are currently 3-9, and little is expected of them going forward. They are now just 9-19 in the Cam Newton era.
  • Despite that, Carolina ranks 4th in Brian Burke’s Advanced NFL Stats efficiency ratings. Now maybe they aren’t the 4th best team in the league, but Brian’s system is purely predictive and minimizes events that shape our views but are unlikely to impact future records. I have no doubt that they’re closer to the 4th best team in the league than the 4th worst, which is where they are by record.
  • Football Outsiders ranks Carolina 18th — which, by the way, still means they’re much better than their record — but even that is misleading. Schatz ranks Carolina 32nd in special teams — a unit that Burke ignores — but instead has them 15th in offensive DVOA and 14th in defensive DVOA. That means excluding special teams the Panthers are above average, and special teams performance is notoriously fickle.
  • So why are the Panthers 3-9? Carolina is currently 0-7 in one-score games.

There’s an even simpler way to show how the Panthers are massively underachieving this year. Net yards per attempt isn’t the only stat in the world, but it’s one of the most important indicators of an offense’s effectiveness. Net yards per attempt is just as important on defense; NY/A differential, the difference between how many net yards you gain per offensive attempt and how many you allow per defensive attempt, is a simple shorthand to highlight the best in the league. Here are the results through 13 weeks (i.e., not counting last night’s game):
[continue reading…]

{ 11 comments }

Cam Newton is having an interesting year

I don’t care about any of the nonsense with Cam Newton. Instead, take a look at his 2011 and 2012 stat lines:

                                                                                            
Year   GS  QBrec Cmp Att Cmp%  Yds TD TD% Int Int% Y/A  AY/A Y/C  Yd/G Sk Yds NY/A ANY/A Sk% Rsh Yds TD  YPC Y/G  C/G
2011   16 6-10-0 310 517 60.0 4051 21 4.1  17  3.3 7.8  7.2 13.1 253.2 35 260  6.9   6.2 6.3 126 706 14  5.6 44.1 7.9
2012    6  1-5-0 101 173 58.4 1387  5 2.9   6  3.5 8.0  7.0 13.7 231.2 15 102  6.8   5.9 8.0  46 273  3  5.9 45.5 7.7

His Y/A is actually higher this year (although his sack rate is a little worse), and his rushing yards per game and yards per carry are both slightly up. Obviously the biggest change is that Newton simply isn’t scoring very much — he’s on pace for just 21 touchdowns after scoring 35 last year. But touchdowns are more volatile than metrics like yards per attempt, and tend to rebound quickly when paired with a strong yards per attempt average. Compared to league average, Newton’s only slightly worse in NY/A and ANY/A than he was last year, and he’s still above-average in both statistics. Statistically, he looks fine.

But the eye test certainly says Newton is struggling. And some stats back that up, too. Newton ranks 25th in Total QBR, although he only ranked 17th in that metric a year ago. Perhaps more importantly, the Carolina offense has plummeted to 29th in points per drive so far in 2012 (while ranking 17th and 19th in drive success rate), after ranking 6th in points per drive (and 6th in yards and 5th in DSR) in 2011. So the offense has been quite a bit worse, and significantly worse when it comes to scoring. That sort of matches what the “eye test” tells me.

But as Aaron Schatz pointed out to me, there are some odd splits going on with Newton. Take a look at how Newton’s performed on pass attempts on 1st downs this year:
[continue reading…]

{ 2 comments }