by Chase Stuart
on July 31, 2018
Yesterday, I wrote about how Michael Irvin was dominant in Receiving Yards per adjusted Team Pass Attempts. From 1991 to 1996, he ranked 1st in that category three times, and 2nd in the other three seasons. From a Gray Ink perspective, that would mean he would get 10 points each for his three first place finishes and 9 points each for his three second place finishes, for a total of 57 points. He also ranked 10th in 1998, which would give him one more point.
The fact that I wrote about Irvin yesterday wasn’t a coincidence. I calculated the Gray Ink for each receiver in NFL history in RY/aTPA, and Irvin’s 58 points (which turns out to be 55 points after you adjust for the number of teams in the league) was the third best in NFL history. Here are the top 75 receivers by this metric. You can read the table below as follows. Jerry Rice played from 1985 to 2004, and accumulated 92 points of Gray Ink, where a 1st-place finish in Receiving Yards/adjusted Team Pass Attempt is worth 10 points, a 2nd-place finish 9 points, a 3rd-place finish 8 points, and so on. The final column is a pro-rated value number, which lowers the value gives in seasons where there were fewer than 32 teams. This most clearly impacts older players like Don Hutson, who drops from 102 points to 66.9 points. [continue reading…]
Tagged as:
James Lofton,
Paul Warfield
{ }
by Chase Stuart
on July 27, 2014
Yesterday, we looked at which quarterbacks were the best at yards per completion after adjusting for league average. Today, we’ll do the same thing for wide receivers and yards per completion.
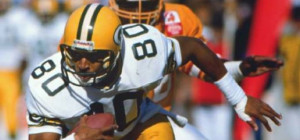
Lofton tries to hide from the creamsicle uniforms.
A small tweak is necessary to the formula. You can skip down to the results section if you don’t care about the math, but I suppose most of my readers want to know what goes in the sausage. We can’t just use league-wide yards per completion rates, since that average includes receptions by non-wide receivers. One way around this is to calculate the league average YPC for wide receivers only; that’s easy to do for 2013, but less easy to do for the earlier years of NFL history when the distinction among the positions was not so clear. So, after playing around with a few different methods, I’ve decided to instead use 120% of the league average YPC rate, and give wide receivers credit for their yards over expectation using that inflated number.
For example, in 1983, James Lofton caught 58 passes for 1,300 yards for the Packers, a 22.4 YPC average. That year, the average reception went for 12.63 yards; 120% of that average is 15.2, which means we would give Lofton credit only for his yards over the product of 15.2 and 58, or 879. Since Lofton actually had 1,300 yards, he gets credit for 421 yards over expectation.
The next year, Lofton caught 62 passes for 1,361 yards (22.0). Since the average reception went for 12.66 yards, Lofton gets credit for his yards over (120% * 12.66 * 62), or 942. Lofton therefore is credited with 419 yards over expectation, nearly identical to his performance in the prior year. In fact, those were the 10th and 11th best season in NFL history by this method. [continue reading…]
Tagged as:
Henry Ellard,
James Lofton,
Paul Warfield,
Randy Moss,
Stanley Morgan
{ }
by Chase Stuart
on April 10, 2014

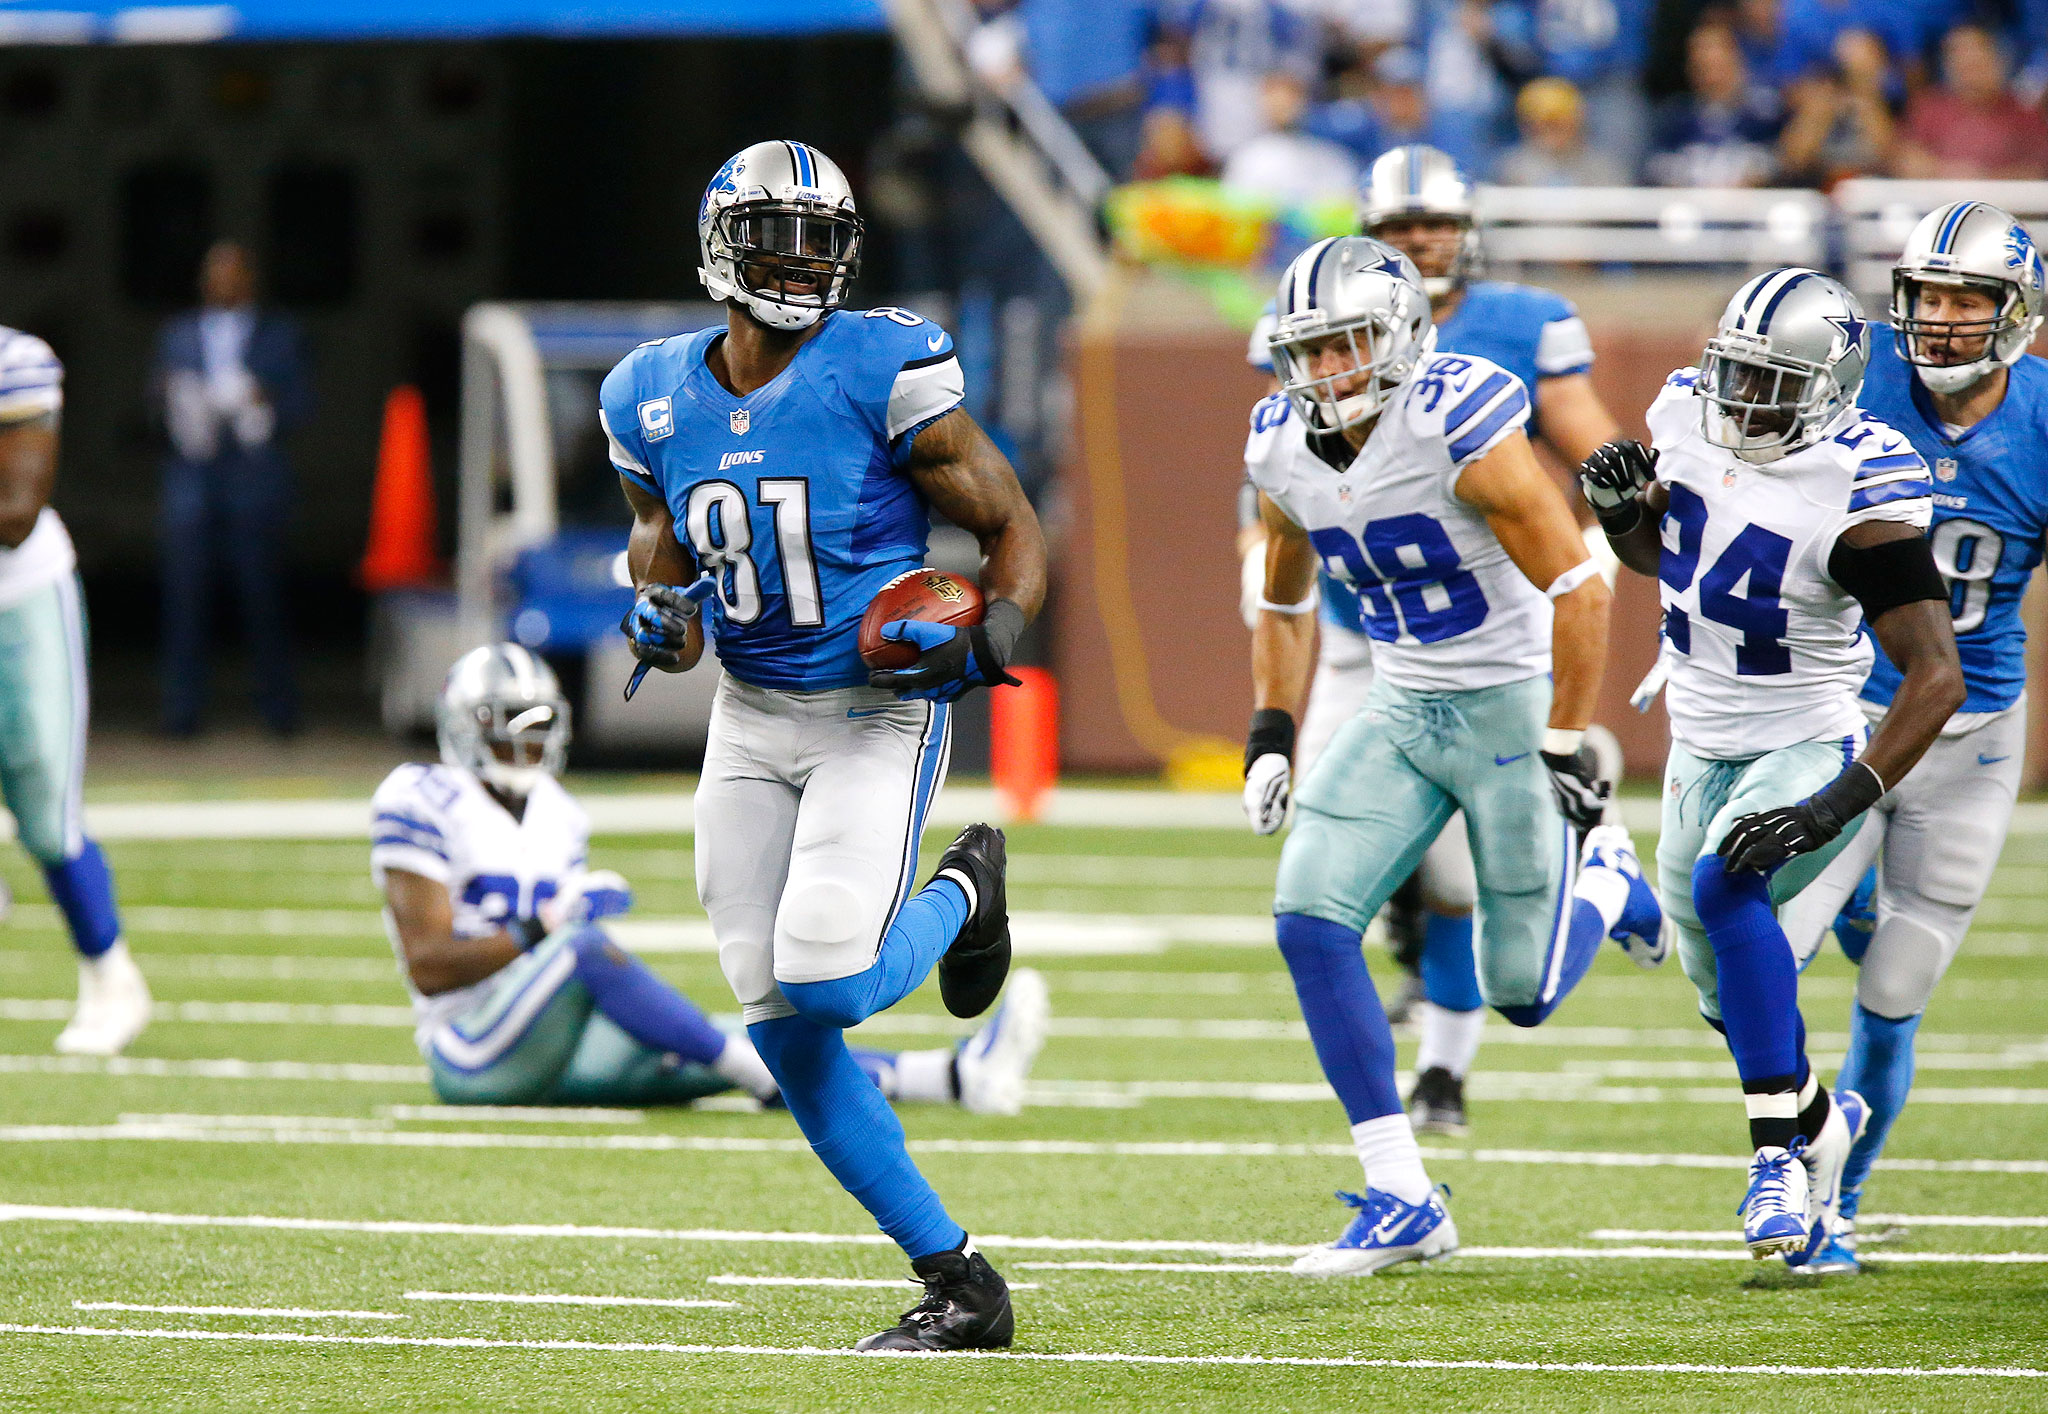
Megatron at his best.
In his seven-year career, Calvin Johnson has already recorded 9,328 receiving yards. And for those curious about these sorts of things, he’s the career leader in receiving yards per game at 88.0, too. But Johnson has also benefited greatly from playing on teams that have thrown a weighted average of 635 pass attempts per season.
What is a weighted average of team pass attempts? I’m defining it as an average of pass attempts per season weighted by the number of receiving yards by that player. Why use that instead of a simple average? When thinking about whether a receiver played for a run-heavy or pass-happy team, we tend to think of that receiver during his peak years. If he caught 10 passes for 150 yards as a rookie on a very pass-happy team, that should not be given the same weight as the number of pass attempts his team produced in his best season. For example, here is how I derived the 635 attempt number for Megatron.
Twenty-one percent of his career receiving yards came in 2012, when Detroit passed 740 times (excluding sacks). Therefore, 21% of his team pass attempts average comes from that season, while 18% comes from his 2011 season, 16% from his 2013 season, and so on. In the table below, the far right column shows how we get to that 635 figure: by multiplying in each season the percentage of career receiving yards recorded by him in that season by Detroit’s Team Pass Attempts.
| Yr | RecYd | TPA | Perc | TM * % |
| 2013 | 1492 | 634 | 16% | 101.4 |
| 2012 | 1964 | 740 | 21.1% | 155.8 |
| 2011 | 1681 | 666 | 18% | 120 |
| 2010 | 1120 | 633 | 12% | 76 |
| 2009 | 984 | 585 | 10.5% | 61.7 |
| 2008 | 1331 | 509 | 14.3% | 72.6 |
| 2007 | 756 | 587 | 8.1% | 47.6 |
| Total | 9328 | 4354 | 100% | 635.2 |
There are 121 players with 7,000 career receiving yards. Unsurprisingly, Johnson has the highest weighted average number of team pass attempts, which must be recognized when fawning over his great raw totals. Marques Colston is just a hair behind Johnson, but no other player has an average of 600+ team pass attempts.
The table below contains data for all 121 players (by default, the table displays only the top 25, but you can change that). Here’s how to read it, starting with the GOAT: Jerry Rice ranks first in career receiving yards, and he played from 1985 to 2004. Rice played in 303 games, gained 22,895 receiving yards, and his teams threw a weighted average of 547 passes per season. Among these 121 players, that rank Rice as playing for the 25th highest or most pass-happy team. Rice also averaged 76 receiving yards per game, which ranks 5th among this group. [continue reading…]
Tagged as:
Andre Johnson,
Calvin Johnson,
Jerry Rice,
Jimmy Smith,
Michael Irvin,
Paul Warfield,
Steve Smith,
WR Project,
WR Ranking Systems
{ }
by Chase Stuart
on March 12, 2013
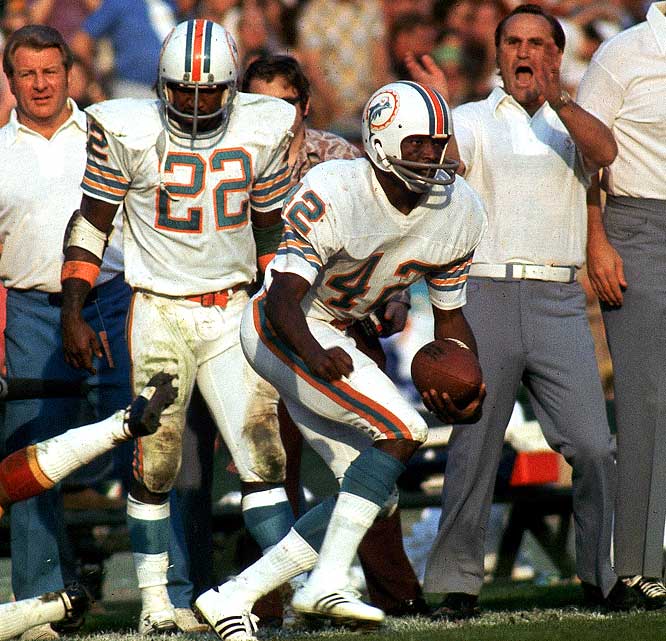
Warfield played for Woody Hayes, Don Shula, and John McVay.
has been confounding stat heads for years. Warfield was a rare
first-ballot Hall of Fame wide receiver and one of the most athletic and talented wide receivers in history. However, his statistics look downright unimpressive to the modern eye. That’s not too surprising, though, since he played the prime of his career in football’s deadball era for one of its best teams.
I was pretty happy when I noticed that Warfield ranked 16th in my wide receiver ranking project last month; that’s much higher than most (all?) stats-based ranking systems place him, although some would argue that it would still underrate him.
One way to understand Warfield’s statistics is to see just how infrequently his teams passed. The table below shows some of the top wide receivers in football history to enter the league since 1960, including some Warfield contemporaries like Gary Garrison, Fred Biletnikoff, Harold Carmichael, and Gene A. Washington. While career numbers are interesting, you can often learn more by just looking at a player’s best seasons.
The table below shows the top 7 seasons for each wide receiver (based on the formula from this post) and how many pass attempts per game his team attempted during those seasons:
[continue reading…]
Tagged as:
Paul Warfield,
WR Project
{ }