
Pro-Football-Reference.com has released its initial set of 2018 Approximate Value numbers have been released by PFR. Thanks to the tireless work of Mike Kania and the P-F-R staff, PFR has now generated the Approximate Values for every player in the NFL this year. For the uninitiated, you can review how AV is calculated here. And if you’re so inclined, you can thank Mike and/or the PFR staff on twitter.
On Monday, we looked at the AV-adjusted average age of each team’s offense in 2017.
On Tuesday, we did the same for defense.
Today, let’s look at the average age of each team overall in 2017. For reference, here are last year’s results. You won’t be surprised to see Cleveland grade out as the youngest team in 2017 by over a full year. The Browns also failed to win a game, so youth didn’t work out for that team.
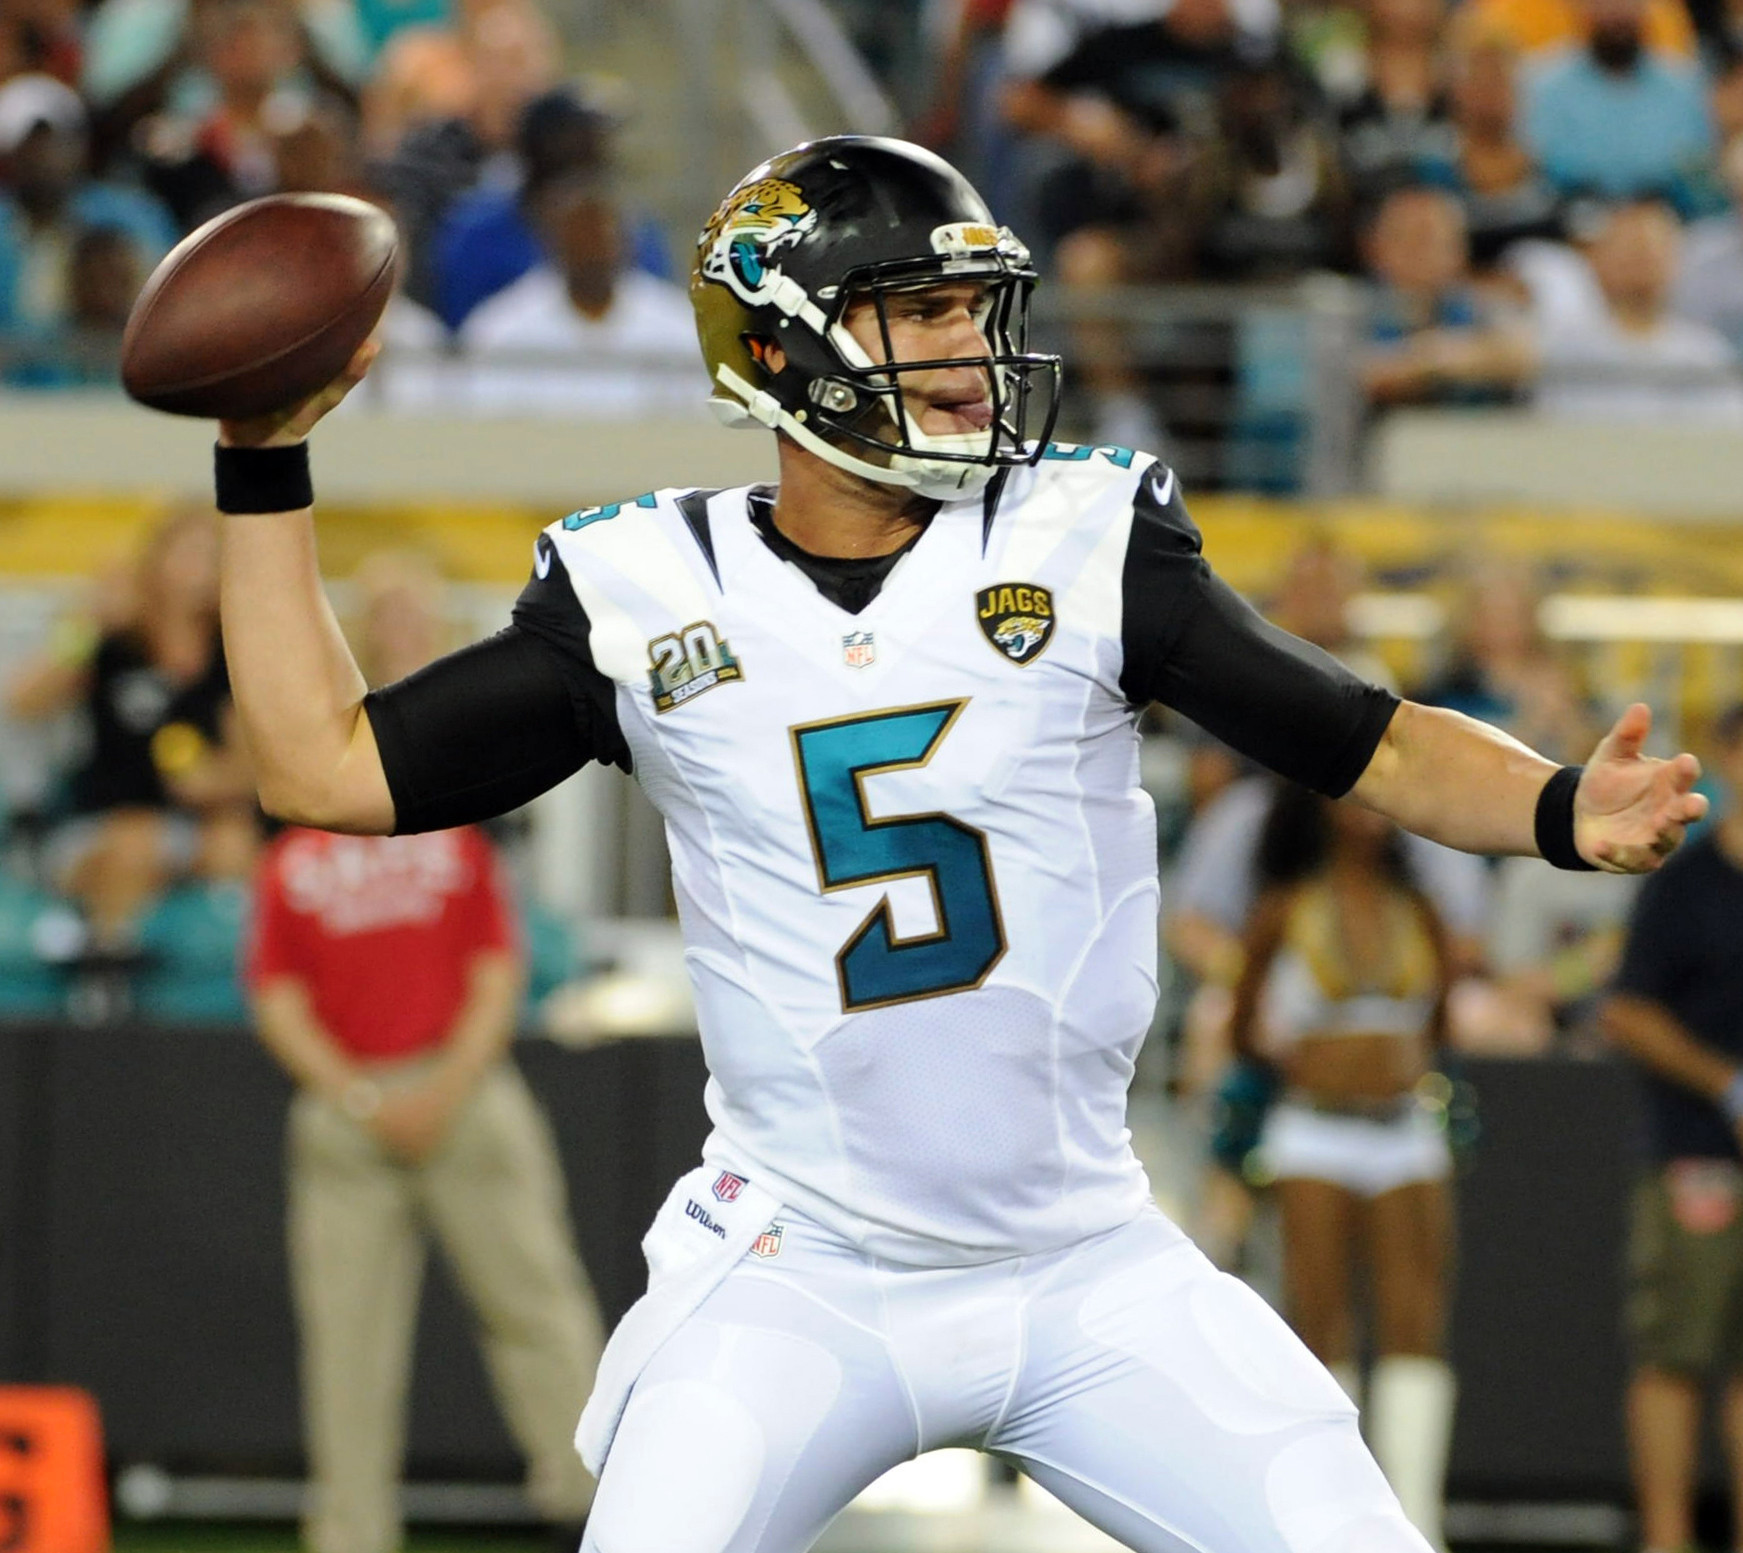
But the second-youngest team in football was the Jacksonville Jaguars, who nearly won the AFC. The Jaguars held a lead in the AFC Championship Game, before losing to the third-oldest team in the NFL… the Patriots.
The table below shows the average age of each team last season. [continue reading…]
Yesterday, we looked at the age-adjusted offenses from 2017. Today we do the same for defenses, just like we did last year. Here’s how I opened that column:
Being young isn’t by itself a virtue: the Browns ranked in the bottom 5 in points allowed, yards allowed, net yards per attempt allowed, net yards per rush allowed, turnovers forced, and first downs allowed. But Cleveland was, by far, the youngest defense in the NFL last season.
In 2016, the Browns defense had an average AV-adjusted age of just 25.2; the Falcons were the second-youngest defense at 25.8. In 2017, the Falcons again had an average AV-adjusted defense that was just 25.8 years old. But the Browns? That number dropped to just 24.5! The Browns defense was even younger than the Browns offense, and was by far the youngest unit in all of football: [continue reading…]
After each of the last six years, I’ve presented the AV-adjusted age of each roster in the NFL. Measuring team age in the NFL is tricky. You don’t want to calculate the average age of a 53-man roster and call that the “team age” because the age of a team’s starters is much more relevant than the age of a team’s reserves. The average age of a team’s starting lineup isn’t perfect, either. The age of the quarterback and key offensive and defensive players should count for more than the age of a less relevant starter. Ideally, you want to calculate a team’s average age by placing greater weight on the team’s most relevant players.
My solution has been to use the Approximate Value numbers from Pro-Football-Reference.com, and to calculate age using each player’s precise age as of September 1 of the year in question. Today, we will look at offenses; tomorrow, we will crunch these same numbers for team defenses. The table below shows the average AV-adjusted age of each offense, along with its total number of points of AV. In 2017, the Browns, Jaguars, and Texans were the three youngest offenses, with Cleveland really standing out. [continue reading…]
Calais Campbell had 16 points of AV while playing with the Arizona Cardinals in 2016. He signed a monster four year, $60 million contract with $30 million guaranteed with the Jaguars in the first week of free agency. But this didn’t prove to be a massive overpay of an aging veteran. On the contrary, Campbell has been a revelation and Defensive Player of the Year candidate; for the second year in a row, he produced 16 points of AV in 2017.
Andrew Whitworth had a similar pedigree but was in a slightly different situation. he signed a contract with the Rams after a decade of strong play with the Bengals. Whitworth received Pro Bowl or some All-Pro recognition in 2014, 2015, and 2016, but at 36, he wasn’t the sought after free agent that Campbell was. But Whitworth, who signed a 3-year, $33.75M contract, managed to exceed expectations in his first year in Los Angeles. Whitworth was the left tackle for the highest scoring offense in the league and was the plurality choice at first-team All-Pro left tackle by the AP.
And then there is Case Keenum. He signed a one year, $2 million contract with the Vikings on April 4 to almost no fanfare. Now? Keenum is starting in this year’s NFC Championship Game.
The table below shows the leaders in AV in 2017 among players who were on different teams in 2016. [continue reading…]
With the All-Pro votes now in, the initial 2017 Approximate Value numbers have been released by PFR. Thanks to the tireless work of Mike Kania and the P-F-R staff, PFR has now generated the Approximate Values for every player in the NFL this year. For the uninitiated, you can review how AV is calculated here. And if you’re so inclined, you can thank Mike and/or the PFR staff on twitter.
Here are your leaders: [continue reading…]
On Tuesday and Wednesday, we looked at the average age for each team’s offense and defense in 2016. Today, let’s look at the overall picture (ignoring special teams). By that measure, the Jaguars, Browns, Rams, Bucs, and Texans have the five youngest teams in the NFL. Take a look: [continue reading…]
Being young isn’t by itself a virtue: the Browns ranked in the bottom 5 in points allowed, yards allowed, net yards per attempt allowed, net yards per rush allowed, turnovers forced, and first downs allowed. But Cleveland was, by far, the youngest defense in the NFL last season.
Yesterday, we looked at the age-adjusted offenses from 2016. Today we do the same for defenses, and the Browns were the youngest group in the league last year, with an average age of just 25.2 years. [continue reading…]
After each of of the last five years, I’ve presented the AV-adjusted age of each roster in the NFL. Measuring team age in the NFL is tricky. You don’t want to calculate the average age of a 53-man roster and call that the “team age” because the age of a team’s starters is much more relevant than the age of a team’s reserves. The average age of a team’s starting lineup isn’t perfect, either. The age of the quarterback and key offensive and defensive players should count for more than the age of a less relevant starter. Ideally, you want to calculate a team’s average age by placing greater weight on the team’s most relevant players.
My solution has been to use the Approximate Value numbers from Pro-Football-Reference.com, and to calculate age using each player’s precise age as of September 1 of the year in question. Today, we will look at offenses; tomorrow, we will crunch these same numbers for team defenses. The table below shows the average AV-adjusted age of each offense, along with its total number of points of AV. Last year, the Rams, Jaguars, and Titans were the three youngest offenses. Each of those three are still in the top five this year, joined by the Bucs at #1 and the Seahawks at #4. [continue reading…]
Yesterday, I wrote that NFL rookies were screwed by the CBA negotiated in 2011. Today, some more data on that point.
Using the Approximate Value metric created by PFR, we can calculate what percentage of league-wide AV belongs to each class of players. For example, rookies typically provide just over 10% of all AV in any given season; before the new CBA, that number was just under 10%. And when you combine rookies with 2nd, 3rd, and 4th year players, those players are responsible for just about half of all NFL value. Given that some 5th year players are also on their rookie contracts, it’s safe to say that about half (if not more) of all AV is provided by players on their rookie contracts.
The graph below shows, in a blue line, the percent of AV provided by players in their first four seasons. The orange line shows the percent of league-wide AV provided by rookies.

We don’t see an enormous switch post-2011 from vetearns to rookies, just a slight one. Players in their first three seasons produced 33% of all AV from 2006-2010, which jumped to 36% over the last five years. But the bigger point is just that football is, and has always been, a young man’s game.
With the All-Pro votes now in, the initial 2016 Approximate Value numbers have been released by PFR. Here are the leaders:
| Games | Misc | |||||||||||
|---|---|---|---|---|---|---|---|---|---|---|---|---|
| Rk | Player | Year | Age | Draft | Tm | Lg | G | GS | Yrs | PB | AP1 | AV ▼ |
| 1 | Matt Ryan | 2016 | 31 | 1-3 | ATL | NFL | 16 | 16 | 1 | 1 | 1 | 21 |
| 2 | Damon Harrison | 2016 | 28 | NYG | NFL | 16 | 16 | 1 | 0 | 1 | 18 | |
| 3 | Aaron Rodgers | 2016 | 33 | 1-24 | GNB | NFL | 16 | 16 | 1 | 1 | 0 | 18 |
| 4 | David Bakhtiari | 2016 | 25 | 4-109 | GNB | NFL | 16 | 16 | 1 | 0 | 0 | 17 |
| 5 | Von Miller | 2016 | 27 | 1-2 | DEN | NFL | 16 | 16 | 1 | 1 | 1 | 17 |
| 6 | Bobby Wagner | 2016 | 26 | 2-47 | SEA | NFL | 16 | 16 | 1 | 1 | 1 | 17 |
| 7 | Drew Brees | 2016 | 37 | 2-32 | NOR | NFL | 16 | 16 | 1 | 0 | 0 | 16 |
| 8 | Calais Campbell | 2016 | 30 | 2-50 | ARI | NFL | 16 | 16 | 1 | 0 | 0 | 16 |
| 9 | Ezekiel Elliott | 2016 | 21 | 1-4 | DAL | NFL | 15 | 15 | 1 | 1 | 1 | 16 |
| 10 | Julio Jones | 2016 | 27 | 1-6 | ATL | NFL | 14 | 14 | 1 | 1 | 1 | 16 |
| 11 | Sean Lee | 2016 | 30 | 2-55 | DAL | NFL | 15 | 15 | 1 | 0 | 1 | 16 |
| 12 | Andrew Luck | 2016 | 27 | 1-1 | IND | NFL | 15 | 15 | 1 | 0 | 0 | 16 |
| 13 | Alex Mack | 2016 | 31 | 1-21 | ATL | NFL | 16 | 16 | 1 | 1 | 0 | 16 |
| 14 | Khalil Mack | 2016 | 25 | 1-5 | OAK | NFL | 16 | 16 | 1 | 1 | 1 | 16 |
| 15 | Le’Veon Bell | 2016 | 24 | 2-48 | PIT | NFL | 12 | 12 | 1 | 1 | 0 | 15 |
| 16 | Jack Conklin | 2016 | 22 | 1-8 | TEN | NFL | 16 | 16 | 1 | 0 | 1 | 15 |
| 17 | Kirk Cousins | 2016 | 28 | 4-102 | WAS | NFL | 16 | 16 | 1 | 0 | 0 | 15 |
| 18 | Aaron Donald | 2016 | 25 | 1-13 | LAR | NFL | 16 | 16 | 1 | 1 | 1 | 15 |
| 19 | Devonta Freeman | 2016 | 24 | 4-103 | ATL | NFL | 16 | 16 | 1 | 1 | 0 | 15 |
| 20 | David Johnson | 2016 | 25 | 3-86 | ARI | NFL | 16 | 16 | 1 | 1 | 1 | 15 |
| 21 | Zach Orr | 2016 | 24 | BAL | NFL | 15 | 15 | 1 | 0 | 0 | 15 | |
| 22 | Dak Prescott | 2016 | 23 | 4-135 | DAL | NFL | 16 | 16 | 1 | 1 | 0 | 15 |
| 23 | Tyrod Taylor | 2016 | 27 | 6-180 | BUF | NFL | 15 | 15 | 1 | 0 | 0 | 15 |
| 24 | Olivier Vernon | 2016 | 26 | 3-72 | NYG | NFL | 16 | 16 | 1 | 0 | 0 | 15 |
| 25 | Travis Frederick | 2016 | 25 | 1-31 | DAL | NFL | 16 | 16 | 1 | 1 | 1 | 14 |
| 26 | Chris Harris | 2016 | 27 | DEN | NFL | 16 | 15 | 1 | 1 | 1 | 14 | |
| 27 | Dont’a Hightower | 2016 | 26 | 1-25 | NWE | NFL | 13 | 13 | 1 | 0 | 0 | 14 |
| 28 | T.Y. Hilton | 2016 | 27 | 3-92 | IND | NFL | 16 | 16 | 1 | 1 | 0 | 14 |
| 29 | Zack Martin | 2016 | 26 | 1-16 | DAL | NFL | 16 | 16 | 1 | 1 | 1 | 14 |
| 30 | LeSean McCoy | 2016 | 28 | 2-53 | BUF | NFL | 15 | 15 | 1 | 1 | 0 | 14 |
| 31 | Benardrick McKinney | 2016 | 24 | 2-43 | HOU | NFL | 16 | 16 | 1 | 0 | 0 | 14 |
| 32 | C.J. Mosley | 2016 | 24 | 1-17 | BAL | NFL | 14 | 14 | 1 | 1 | 0 | 14 |
| 33 | Matthew Stafford | 2016 | 28 | 1-1 | DET | NFL | 16 | 16 | 1 | 0 | 0 | 14 |
| 34 | Aqib Talib | 2016 | 30 | 1-20 | DEN | NFL | 13 | 13 | 1 | 1 | 1 | 14 |
| 35 | Russell Wilson | 2016 | 28 | 3-75 | SEA | NFL | 16 | 16 | 1 | 0 | 0 | 14 |
You can view the top 100 players here, and individual player AV by team is available as well.
Last year, I looked at AV Retention Rates, a measure of how sticky a team’s composition was from year to year. We’ll get to the methodology in a minute, but let’s start with two examples.
Cincinnati was very consistent from 2014 to 2015. Andy Dalton was the quarterback both years, and Jeremy Hill, Giovani Bernard, and A.J. Green were the three leaders in yards from scrimmage in 2014 and again in 2015. The offensive line was unchanged, with Andrew Whitworth, Andre Smith, Clint Boling, Kevin Zeitler, and Russell Bodine as the main five in both years, although Smith and Zeitler missed some time in 2014. The big change on offense wasn’t external, either: it was the return from injury for both Tyler Eifert and Marvin Jones, which dropped Mohamed Sanu down in the pecking order.
On defense, Geno Atkins, Domata Peko, and Carlos Dunlap were starters on the defensive line both years, with Rey Maualuga manning the middle and Reggie Nelson and George Iloka at safety. Adam Jones and Leon Hall were two of the three cornerbacks to play 60%+ of defensive snaps in both years, with the main change in the secondary being being Dre Kirkpatrick replacing Terence Newman (Minnesota). On the line, the big change was the return of Michael Johnson from a one-year stint in Tampa, with Wallace Gilberry dropping from 73% of snaps to 58% as a result. And at linebacker, Maualuga, Vincent Rey, Vontaze Burfict, and Emmanuel Lamur were the four to see the most snaps in both 2014 and 2015, though the pecking order changed a bit.
In other words, the 2015 Bengals looked a whole lot like the 2014 Bengals. But in Washington, turnover was the story of the 2015 season. In 2014, Kirk Cousins started 5 games; last year, he started all sixteen. Matt Jones and Chris Thompson combined for over 50% of snaps at running back last year, reducing the heavier load endured by Alfred Morris in 2014. Tight end Jordan Reed caught 11 touchdowns and led the team in targets last year, but started two games and didn’t score in 2014.
On the offensive line, only LT Trent Williams was a holdover. With RG Chris Chester in Atlanta, 5th overall pick Brandon Scherff took over and started all 16 games. Morgan Moses, a third round pick in 2014 who started just one game as a rookie, took over at right tackle, relegating 2014 starter Tom Compton to the bench (he’s now in Atlanta with Chester). Kory Lichtensteiger (center) and Shawn Lauvao (left guard) both started in 2014, but were lost early in the season with injuries, putting Spencer Long (G) and Josh LeRibeus (C) into the lineup.
At safety, Ryan Clark, Brandon Meriweather, and Phillip Thomas were replaced by Dashon Goldson, Kyshoen Jarrett and Trent Robinson. At corner, Bashaud Breeland was the consistent presence year over year, but David Amerson (one of the lone blunders from Washington’s front office last year) and E.J. Biggers were replaced by Will Blackmon and DeAngelo Hall (limited to just 3 games in 2014). The front seven was relatively consistent year over year, though Jarvis Jenkins and Brian Orakpo were gone in 2015, with Preston Smith, Ricky Jean-Francois, Terrance Knighton coming on board. [continue reading…]
Background:
In 2012, the Jaguars went 2-14 with an offense centered around Blaine Gabbert/Chad Henne, Maurice Jones-Drew, Cecil Shorts, and Justin Blackmon. Since then, the team has been rebuilt, and gotten better and younger. Among offensive players, only Marcedes Lewis was on the team during each of the last four years. I’ll have more on the Jaguars tomorrow, but given the way the Jets have moved from young and bad to old and good, I think that’s the more interesting team to analyze today.
Here’s how to read the table below. In 2012, the Jets offense had an age-adjusted AV of 26.9; that dropped to 26.4 in 2013, then rose to 27.5 in 2014 and up to a league-high 29.2 last season. That’s an average of 27.5, but more interesting (to me) is the variance of 1.1 years. [continue reading…]

Part of the last non-awful Bears defense
I thought it would be fun to do a quick checkdown and look at the AV-Adjusted team age for each defenses over the last four years. Here’s how to read the table below, using the Bears as an example. In 2012, Chicago’s average age on defense was 29; in 2013, it was 27.7, then 27.5, and finally, 26.1 last season. That means the Bears average age has had a variance of 1.1 years, the second largest in the data set behind only San Diego. [continue reading…]
In each of the last four years, I’ve presented the AV-adjusted age of each roster in the NFL. Measuring team age in the NFL is tricky. You don’t want to calculate the average age of a 53-man roster and call that the “team age” because the age of a team’s starters is much more relevant than the age of a team’s reserves. The average age of a team’s starting lineup isn’t perfect, either. The age of the quarterback and key offensive and defensive players should count for more than the age of a less relevant starter. Ideally, you want to calculate a team’s average age by placing greater weight on the team’s most relevant players.
My solution has been to use the Approximate Value numbers from Pro-Football-Reference.com. The table below shows the average age of each team, along with its average AV-adjusted age of the offense and defense. For the second year in a row, the Jaguars and Rams were the two youngest teams in the NFL; this year, though, the team formerly known as St. Louis took the top spot.
The average AV-adjusted team age last season was 27.1 years; the Rams (25.6) and Jaguars (25.8) were the only teams below 26, while the Jets (28.2) and Colts (28.6) were the only teams above 28 years. Here’s how to read the table below, using the St. Louis line: the Rams were the youngest team in the NFL in 2015, with an average age of 25.6 years as of September 1, 2015. The team’s offense had an AV-adjusted average age of 25.0, the youngest in the NFL, while the defense was at 26.0, the second-youngest. [continue reading…]
Thanks to the tireless work of Mike Kania and his team on the P-F-R staff, PFR has now generated the Approximate Values for every player in the NFL this year. For the uninitiated, you can review how AV is calculated here. And if you’re so inclined, you can thank Mike or PFR on twitter. [continue reading…]
Change is inherent in the very fabric of the NFL. From year to year, little stays the same for most teams. But the team that changed the least from 2013 to 2014 was … the Dallas Cowboys?
There were six Dallas players who produced 12 or more points of Approximate Value last year: DeMarco Murray, Tony Romo, Tyron Smith, Dez Bryant, Zack Martin, and Travis Frederick. Of that group, all but Martin were key contributors in 2013, too. As measured by AV, the only big changes for the Cowboys were the losses of Jason Hatcher (8 points of AV in 2013), DeMarcus Ware (5) and Sean Lee (5). And other than Martin, the only notable players for the team last year that weren’t key parts of the team in 2013 were DE Jeremy Mincey, FS J.J. Wilcox, OLB Anthony Hitchens, ILB Rolando McClain, and DE Tyrone Crawford. And, perhaps, another reason the Cowboys may have appeared to have little turnover last year? Dallas generally stayed very healthy, which is one way of keeping the same players in the lineup year over year. [continue reading…]
 In each of last three years, I’ve presented the AV-adjusted age of each roster in the NFL. Measuring team age in the NFL is tricky. You don’t want to calculate the average age of a 53-man roster and call that the “team age” because the age of a team’s starters is much more relevant than the age of a team’s reserves. The average age of a team’s starting lineup isn’t perfect, either. The age of the quarterback and key offensive and defensive players should count for more than the age of a less relevant starter. Ideally, you want to calculate a team’s average age by placing greater weight on the team’s most relevant players.
My solution has been to use the Approximate Value numbers from Pro-Football-Reference.com. The table below shows the average age of each team, along with its average AV-adjusted age of the offense and defense. Here’s how to read the Jaguars line. In 2014, Jacksonville was the youngest team in the league, with an AV-adjusted team age of 25.8 years (all ages are measured as of September 1, 2014). The average AV-adjusted age of the offense was 24.5 years, giving the Jaguars the youngest offense in the NFL (and by over a year!). The average age of the defense was 26.6 years, and that was the 10th youngest of any defense in football in 2014. [continue reading…]
The only skill position player in Super Bowl XLIX drafted in the first round
On offense, the Patriots have one player on the entire roster who was selected in the first round: tackle Nate Solder. On defense, starters Chandler Jones, Dont’a Hightower, Devin McCourty, and Vince Wilfork were chosen by New England in the first round. And let’s not forget Darrelle Revis, a first round pick of the Jets; those are five of the best players on New England’s defense right now. The Patriots defense also features Jerod Mayo and Dominique Easley, two former first round picks now on injured reserve.
But most of New England’s key contributors were not first round picks. Tom Brady, of course, was a 6th round pick. Rob Gronkowski was a 2nd, Julian Edelman was a 7th, Brandon Lafell was a 3rd, Rob Ninkovich was a 5th, and so on. Every year, Pro-Football-Reference generates an Approximate Value rating for each player in the NFL. This year, former first round picks of the Patriots generated just 23% of the team’s Approximate Value. [continue reading…]
Yesterday, I looked at the best AV-weighted winning percentages of offensive players. Today, we examine the same numbers but for defensive players and kickers since 1960. Again, players who entered the league prior to 1960 are included, but for purposes of this study, only their 1960+ seasons count (assuming they produced at least 50 points of AV). That’s a pretty important bit of detail to mention when it comes to the top player on the list. The player with the best AV-adjusted winning percentage since 1960 is Packers linebacker Bill Forester, who entered the NFL in 1953 but only gets credit for his 1960-1963 seasons in Green Bay (spoiler: those were pretty good ones). After him, of course, we have yet another Patriots lineman. Today it’s Vince Wilfork: [continue reading…]
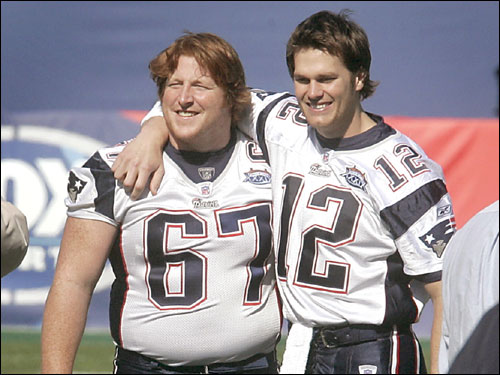
A true winner and Tom Brady.
By this methodology, Dan Koppen has the highest AV-weighted career winning percentage of any offensive player since 1960. The table below shows his AV and team’s winning percentage in each season of his career. Because Koppen’s best season came in 2007, when the Patriots went 16-0, Koppen’s career winning percentage gets a big boost from that season (18.7% of his career winning percentage comes from ’07 since 18.7% of his career AV comes from that year). On the other hand, Koppen played in just one total game for the 13-3 Patriots (2011) and the 13-3 Broncos (2013), so he gets almost no credit for those performances. Of course, he doesn’t need it, because his average season, after adjusting the weights based on his AV grades, was a 13-3 season.
| Year | Tm | G | GS | AV | Record | % of Car AV | WtWin% |
|---|---|---|---|---|---|---|---|
| 2003 | NWE | 16 | 15 | 7 | 0.875 | 8% | 0.07 |
| 2004 | NWE | 16 | 16 | 10 | 0.875 | 11.5% | 0.101 |
| 2005 | NWE | 9 | 9 | 5 | 0.625 | 5.7% | 0.036 |
| 2006 | NWE | 16 | 16 | 10 | 0.75 | 11.5% | 0.086 |
| 2007 | NWE | 15 | 15 | 16 | 1 | 18.4% | 0.184 |
| 2008 | NWE | 16 | 16 | 10 | 0.688 | 11.5% | 0.079 |
| 2009 | NWE | 16 | 16 | 10 | 0.625 | 11.5% | 0.072 |
| 2010 | NWE | 16 | 16 | 11 | 0.875 | 12.6% | 0.111 |
| 2011 | NWE | 1 | 1 | 1 | 0.813 | 1.1% | 0.009 |
| 2012 | DEN | 15 | 12 | 7 | 0.813 | 8% | 0.065 |
| 2013 | DEN | 0 | 0 | 0.813 | 0% | 0 | |
| Total | 0 | 100% | 0.813 |
The table below shows the top 500 career AV-adjusted winning percentages among all offensive player since 1960 (minimum: 50 points of AV). As always, players who entered the NFL before 1960 are included but only their seasons beginning in 1960 count. The table below is fully sortable and searchable, so get to searching and leave your thoughts in the comments. [continue reading…]

Bush played with some talented teammates at USC.
Today, I look at running backs drafted since 1984. I use a slightly different way of looking at the data that I think is a little better. I also revisit the QBs and WR/TEs with that method. Instead of considering the number of first-round college teammates that a player has, I consider the total draft value of college teammates at different positions, as determined by Chase’s chart. [1]I thank commenter Stuart for suggesting this approach in the comments to last week’s post. Going this way makes it possible to look at the entire offensive line’s value, for example, rather than just the number of players who were high picks.
For example, according to PFR’s Approximate Value (AV), Ki-Jana Carter is the biggest underachiever at RB relative to his draft position (since 1984). After being drafted #1 in 1995, he generated just nine points of AV in his first five years. [2]Carter averaged 3.3 yards on 227 carries over his first five injury-plagued seasons. Carter also had a lot of help from his friends in college. He ranks 10th out of 104 RBs picked in the top 32 in terms of the total value of his college offensive linemen according to my measure. His tight end also went in the top ten in 2005; Carter would be 2nd in total line value if we included TEs. Two of his offensive lineman went in the first round in the following year. Two Penn State fullbacks were drafted that year, too. [3]Two Penn State halfbacks were drafted in 1996, as well. One of them was Stephen Michael Pitts, who went to Middletown High School South (NJ), a school that also graduated Knowshon Moreno and, only … Continue reading Could Carter have looked better than he was because he ran behind those great college blockers? Or is the NFL success of the running back who ranks fourth in terms of offensive line help (Warrick Dunn) more representative of RBs, in general?
In addition to looking at the offensive line, I’ll consider whether the total value of college teammates at other offensive positions predicts that running backs become overvalued in the draft. While we might think that RBs are particularly dependent on line help, it actually appears that having a great QB is again the one clear predictor for players being overvalued. [continue reading…]
References
| ↑1 | I thank commenter Stuart for suggesting this approach in the comments to last week’s post. |
|---|---|
| ↑2 | Carter averaged 3.3 yards on 227 carries over his first five injury-plagued seasons. |
| ↑3 | Two Penn State halfbacks were drafted in 1996, as well. One of them was Stephen Michael Pitts, who went to Middletown High School South (NJ), a school that also graduated Knowshon Moreno and, only slightly less famously, me. |
The NFL Draft is this week, which means we have something resembling real football to talk about. But how much impact will the players who hear their names called during the 2014 Draft have on the 2014 season? Here’s the short answer: as a group, they will make up about 10% of games played by all players and 8% of all starts.
What do I mean by that? Each year, every team’s players start 352 games, which is the product of 16 (games) and 22 (starters). Players selected during the 2013 Draft started 27 games per team last year, which is in line with the recent average of eight percent. I also looked at the number of games played by all drafted rookies, and divided that by the number of games played by all players on that team. Take a look: the blue line represents games played by drafted rookies and the red line represents games started; both numbers on shown on a percentage basis for the league as a whole. [continue reading…]
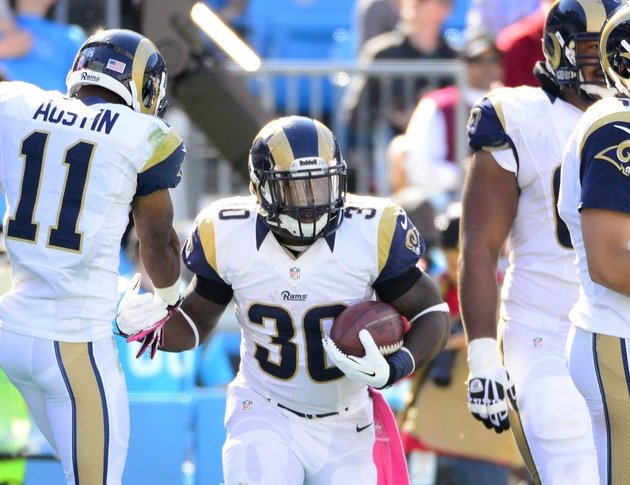
The Rams are loaded with young talent.
My solution has been to use the Approximate Value numbers from Pro-Football-Reference.com. The table below shows the average age of each team, along with its average AV-adjusted age of the offense and defense. Here’s how to read the Rams’ line. In 2013, St. Louis was the youngest team in the league, with an AV-adjusted team age of 25.5 years (all ages are measured as of September 1, 2013). The average AV-adjusted age of the offense was 25.9 years, giving the Rams the third youngest offense in the NFL. The average age of the defense was 25.2 years, and that was the youngest of any defense in football in 2013.
It’s Christmas in January. Again. Thanks to the tireless work of Mike Kania and the P-F-R staff, PFR has now generated the Approximate Values for every player in the NFL this year. For the uninitiated, you can review how AV is calculated here. And if you’re so inclined, you can thank Mike or PFR on twitter. (You can still thank Neil, although he has now officially moved on.)
Here’s a list of the top 100 players. AV is also listed for each player on each team’s roster page on PFR (for Seattle, it’s Richard Sherman). You can use the PFR player finder for all sorts of AV-related fun, too. For example, you could see the player with the most AV on your favorite team (for the Jets, it’s Muhammad Wilkerson), or by position (among wide receivers, it’s a three-way tie between Antonio Brown, Alshon Jeffery, and Demaryius Thomas), or by age (among those 35 or older, it’s Peyton Manning, or John Abraham for non-quarterbacks; Vontaze Burfict and Luke Kuechly lead the 23-and-younger crowd.)
Here’s a list of the 25 players with an AV of 15+ or greater:
| Games | Misc | |||||||||
|---|---|---|---|---|---|---|---|---|---|---|
| Rk | Player | Year | Age | Draft | Tm | G | GS | PB | AP1 | AV |
| 1 | Peyton Manning | 2013 | 37 | 1-1 | DEN | 16 | 16 | 1 | 1 | 19 |
| 2 | Richard Sherman | 2013 | 25 | 5-154 | SEA | 16 | 16 | 1 | 1 | 19 |
| 3 | Louis Vasquez | 2013 | 26 | 3-78 | DEN | 16 | 16 | 1 | 1 | 19 |
| 4 | Navorro Bowman | 2013 | 25 | 3-91 | SFO | 16 | 16 | 1 | 1 | 18 |
| 5 | Vontaze Burfict | 2013 | 23 | CIN | 16 | 16 | 1 | 0 | 18 | |
| 6 | Luke Kuechly | 2013 | 22 | 1-9 | CAR | 16 | 16 | 1 | 1 | 18 |
| 7 | Drew Brees | 2013 | 34 | 2-32 | NOR | 16 | 16 | 1 | 0 | 17 |
| 8 | Jason Peters | 2013 | 31 | PHI | 16 | 16 | 1 | 1 | 17 | |
| 9 | Jamaal Charles | 2013 | 27 | 3-73 | KAN | 15 | 15 | 1 | 1 | 16 |
| 10 | Karlos Dansby | 2013 | 32 | 2-33 | ARI | 16 | 16 | 0 | 0 | 16 |
| 11 | Cam Newton | 2013 | 24 | 1-1 | CAR | 16 | 16 | 1 | 0 | 16 |
| 12 | Robert Quinn | 2013 | 23 | 1-14 | STL | 16 | 16 | 1 | 1 | 16 |
| 13 | Philip Rivers | 2013 | 32 | 1-4 | SDG | 16 | 16 | 1 | 0 | 16 |
| 14 | Tyron Smith | 2013 | 23 | 1-9 | DAL | 16 | 16 | 1 | 0 | 16 |
| 15 | J.J. Watt | 2013 | 24 | 1-11 | HOU | 16 | 16 | 1 | 1 | 16 |
| 16 | Muhammad Wilkerson | 2013 | 24 | 1-30 | NYJ | 16 | 16 | 0 | 0 | 16 |
| 17 | Russell Wilson | 2013 | 25 | 3-75 | SEA | 16 | 16 | 1 | 0 | 16 |
| 18 | Matt Forte | 2013 | 28 | 2-44 | CHI | 16 | 16 | 1 | 0 | 15 |
| 19 | Greg Hardy | 2013 | 25 | 6-175 | CAR | 16 | 13 | 1 | 0 | 15 |
| 20 | Colin Kaepernick | 2013 | 26 | 2-36 | SFO | 16 | 16 | 0 | 0 | 15 |
| 21 | Andrew Luck | 2013 | 24 | 1-1 | IND | 16 | 16 | 0 | 0 | 15 |
| 22 | Robert Mathis | 2013 | 32 | 5-138 | IND | 16 | 16 | 1 | 1 | 15 |
| 23 | LeSean McCoy | 2013 | 25 | 2-53 | PHI | 16 | 16 | 1 | 1 | 15 |
| 24 | Patrick Peterson | 2013 | 23 | 1-5 | ARI | 16 | 16 | 1 | 1 | 15 |
| 25 | Ndamukong Suh | 2013 | 26 | 1-2 | DET | 16 | 16 | 1 | 1 | 15 |
Provided by Pro-Football-Reference.com: View Original Table

Where does Ryan's crew rank?
The Atlanta Falcons have a pretty good group of skill position players. Tony Gonzalez has a comfortable lead on Jerry Rice’s career receptions pace; Gonzalez will one day become the first tight end inducted into the Hall of Fame on the first ballot. Steven Jackson is a borderline Hall of Famer who was stuck on perpetually lousy teams. Roddy White may not be Hall of Fame caliber, but he’s better than you realize: I ranked him as the 37th best receiver of all time in February and he ranked 21st on the list of best six seasons in True Receiving Yards. And he has shown little sign of slowing down, either: White’s recorded at least 80 catches, 1100 yards, and 6 touchdowns in each of the last six years, a mark previously achieved by only Rice and Marvin Harrison. But White will soon pass the torch to Julio Jones, who will battle with A.J. Green and Dez Bryant over the next decade for the title of most freakishly athletic receiver. As for the quarterback, well, Matt Ryan’s 56 wins is the most of any quarterback through five seasons in NFL history.
With those five men, the Falcons have one of the best quintets in league history. Of course, with eleven men on the field and only five offensive lineman on most plays, “skill position players” generally refers to a group of six players. According to Football Outsiders, Harry Douglas was usually that sixth man last year, as he was on the field for 585 snaps in 2012. Douglas is a fine player as a third receiver, but he will bring down the value of this group.
Which made me wonder: which teams have fielded the best six skill position players ever? It’s tricky to even know what “best” means: a 30-year-old Earl Campbell isn’t the same as the 24-year-old version, but if you look simply at productivity in that season, you’re making a list of the best offenses. So here’s what I did.
1) I included in my data set every player who scored at least 5 points of AV in a particular season. This should minimize players who didn’t make any significant contribution in that season.
2) Next, I measured the top six non-lineman offensive players for each team according to their career AV.
3) Then, I took the geometric mean of the career AV of those six players to come up with a team grade.
This is far from a perfect measure — it’s actually quick and dirty — but it was the easiest thing I could think of. Of course, we’ll have to wait a few years for players like Jones and Ryan to rack up their career AV, so I thought it would be fun to look at the current top ten groups.
Before moving on to them, let’s take a look at those who deserve honorable mentions:
[continue reading…]
Last week, I wrote about how the 2012 Redskins were powered by a pair of rookies in Robert Griffin III and Alfred Morris. The only team whose rookies had more passing/rushing/receiving yards in NFL history was the 2012 Colts, while the only non-expansion team with a higher percentage of yards from rookies was the ’55 Colts.
In the comments, Shattenjager pointed out that the list I presented was pretty quarterback-heavy. So I thought a fun thing to do would be to use PFR’s Approximate Value (AV) system instead of yards, and re-run the numbers.
The table below shows all non-expansion teams since 1950 that had at least 25% of their AV come from rookies. For each team, I’ve listed their record and winning percentage, total team AV, their rookie AV, and the percentage compiled by rookies. Then I listed their top four rookies in terms of AV.
[continue reading…]

A.J. Smith knows a perfect throwing motion when he sees one.
Think back to April 2007. A.J. Smith and Bill Polian were widely considered the two best draft minds in the NFL. At the time, Smith’s last three draft classes had been outstanding. He added Philip Rivers (via the Eli Manning trade), Igor Olshansky, Nick Hardwick, Shaun Phillips, Michael Turner, and Nate Kaeding in 2004, and followed that up with Shawne Merriman, Luis Castillo, Vincent Jackson, and Darren Sproles in 2005 and another strong class (Antonio Cromartie, Marcus McNeill, and Jeromey Clary) in 2006.
The defending Super Bowl champions were the Indianapolis Colts, a team that Polian had built from scratch. From 1996 to 2003, Polian’s eight first round picks were spent on Marvin Harrison, Tarik Glenn, Peyton Manning, Edgerrin James, Rob Morris, Reggie Wayne, Dwight Freeney, and Dallas Clark. His most recent first round pick was Joseph Addai, who had 1400 yards from scrimmage as a rookie and 143 yards in the Super Bowl victory over Chicago.
Last November, I provided an updated version of my own draft value chart where I measured the value provided by each draft pick to his Approximate Value over the course of his first five years. A week later I decided another change was needed. While AV measures the value provided by a player, the marginal value provided by a player is a better measure of the value of a draft pick. As a result, I re-did the chart and only gave players credit for their AV above 2 points of AV.
You can view the values for both of those charts and the Jimmy Johnson chart here. This week, I spoke with Peter Keating of ESPN the Magazine, who is working on an article regarding how teams should value draft picks. Keating asked if I could make two changes to the chart, and I was happy to do so (and thought you guys might be interested). First, I increased the measure of replacement-level AV from 2 to 3 points. Theoretically, this change would reward the best players, as the higher the value used for replacement level, the fewer players that will meet that threshold. The other change was to reduce the number of years measured from five to four, since that matches the length of the typical rookie contract under the new CBA. The chart below shows the raw data and a smoothed curve depicting the marginal AV (over 3) produced by draft picks in the first four years of their career over a 28-year period.
[continue reading…]
How do you compare the value of a draft pick this year compared to a draft pick next year? NFL teams have often used a “one round a year” formula, meaning a team would trade a 2nd, 3rd, or 4th round pick this year for a 1st, 2nd, or 3rd rounder next year. But to my knowledge, such analysis hasn’t evolved into anything more sophisticated than that.
So I decided to come up with a way to measure the time value of draft picks. First, I calculated how much Approximate Value each draft pick provided from 1970 to 2007 during their rookie season. Then, to calculate each player’s marginal AV, I only awarded each player credit for his AV over two points in each year. As it turns out, the player selected first will provide, on average, about 4 points of marginal AV during his rookie year. During his second season, his marginal value shoots up to about 5.5 points of AV, and he provides close to 6 points of marginal AV during his third and fourth seasons. In year five, the decline phase begins, and the first pick provides about 4.7 points of AV. You can read some more fine print here. [1]The charts in this post are “smoothed” charts using polynomial trend lines of the actual data. I have only given draft picks credit for the AV they produced for the teams that drafted … Continue reading
Here’s another way to think of it. The 1st pick provides 4.0 points of marginal AV as a rookie, the same amount the 15th pick provides during his second year, the 17th pick produces during his third year, the 16th pick during his fourth year, and the 8th pick during his fifth year. So the 15th pick this year should provide, on average, about the same value next year as the 1st pick in the 2014 draft (of course, that player might have something to say about that, too).
The graph below shows the marginal AV (on the Y-axis) provided by each draft selection (on the X-axis) in each of their first five years. The graphs get increasingly lighter in color, from black (as rookies) to purple, red, pink, and gray (in year five):
[continue reading…]
References
| ↑1 | The charts in this post are “smoothed” charts using polynomial trend lines of the actual data. I have only given draft picks credit for the AV they produced for the teams that drafted them – that’s why the values are flatter (i.e., top picks are less valuable) than they were in this post. Finally, astute readers will note that the draft looks linear in the second half; that’s because if I kept a polynomial trend line all the way through pick 224, some later picks would have more value than some early picks |
|---|