≡ Menu

Kirk Cousins is Spreading It Around

In the summer, I wrote an article describing the increased emphasis on spreading the ball around in team passing games. Through nine weeks of the 2017 season, which teams have the most and least concentrated passing games?

One way to measures this is to calculate the percentage of team targets had by every player on each team, square that result, and sum those squared results to get a team grade. Let’s use the Steelers as an example. Pittsburgh has 273 team targets this year, and star receiver Antonio Brown has seen 94, or 34%, of those targets. The square of 34% is 11.9%; perform those calculations for every Steelers who has a target this year, and the sum of those squares is 19.6%.

[continue reading…]

{ 1 comment }

Predictions in Review: NFC East

During the 2013 offseason, I wrote 32 articles under the RPO 2013 tag. In my Predictions in Review series, I review those preview articles with the benefit of hindsight. Previously, I reviewed the AFC West, the NFC West, the AFC South, the NFC South, the AFC North, the NFC North, and the AFC East. Today, we finish the series with a look at the NFC East.

Eli Manning was about as good in 2012 as he was in 2011, July 15, 2013

On the surface, Eli Manning’s numbers dropped significantly from 2011 to 2012; after further review, his “decline” was entirely due to two factors: attempting fewer passes and lower YAC by his receivers. And since Victor Cruz and Hakeem Nicks were largely responsible for those declines, it seemed fair to wonder how much of the blame should go to Manning. [continue reading…]

{ 6 comments }

A special bonus article this week at the New York Times, as I took a look at the incredible career of London Fletcher.

On Sunday, Fletcher, a Washington captain, will play in his 256th straight game, the third-longest streak in N.F.L. history for a player who was not a kicker, behind only Brett Favre’s 299 games and Jim Marshall’s 282.

Having somehow survived for 16 seasons without sustaining any kind of disabling injury, all while playing amid the chaos and attrition rates that are parts of an inside linebacker’s life, Fletcher has said he plans to call it quits after Sunday’s game while he is still ahead.

By the end of this week, though, he was hedging a bit, not quite sure he was truly ready to walk away.

Five weeks ago, Fletcher moved ahead of Eugene Robinson, a safety for 16 seasons, and became the career leader in games played by an undrafted defensive player. Earlier this season, he broke Derrick Brooks’s record of 208 consecutive starts at linebacker. On Sunday, Fletcher will start his 216th consecutive game. He has, in effect, dodged a million bullets in a game that is tough for any player to endure physically.

You can read the full article here. In addition, related readings on Fletcher can be found here and here.

{ 2 comments }
Can you believe we get to play in the NFC East?

Can you believe we get to play in the NFC East?

Let’s pretend that each team in the NFC East is equal in strength. That’s probably not true, of course, but I wan to stipulate that Eli Manning = Robert Griffin III = Tony Romo = Nick Foles, and that goes for the other 52 players on each of their teams, too. If that’s the case, the schedules will play a big role in determining the eventual champion.

The Cowboys and Eagles are tied atop the division at 5-5, with Dallas having the easiest remaining schedule (opponents have a 0.435 winning percentage) and Philadelphia having the second easiest (0.472). Washington (0.508) and New York (0.533) are both 3-6, with even more challenging schedules the rest of the way than the two division leaders.  But I think it’s instructive to look at the schedules in a different way.

As you know, each team plays six games against the other three teams in the division. Of the remaining ten games, eight are the same — and this year, they come against the AFC West and NFC North. The final two games of the season are what I’ll call “Strength of Schedule” games, as they are determined by each team’s rank in the division in 2012. That means Washington, the #1 team in the division in 2012, is scheduled to play last year’s division winners from the NFC South and NFC West, the #2 team gets the runners up from those divisions, and so on. Let’s start there, because these “SOS” games already put one team behind the eight ball.

In the tables below, I’ll put a 1 in the cell if the team won the game, a 0 to represent a loss, and a 0.5 to indicate that the game has not yet been played.
[continue reading…]

{ 7 comments }

Not doing a squirrel dance.

Not doing a squirrel dance.

Last year, I wrote about how rare and impressive it was to see Ray Lewis and London Fletcher still playing at high levels. Lewis did not have a great 2012 season, but managed to walk away from the game as a defending Super Bowl champ. Fletcher was even better, and was named a second-team All-Pro by the Associated Press.

Pro-Football-Reference.com’s Approximate Value system goes back to 1950. Only five times since then has an inside linebacker recorded 10 points of AV at age 36 or older: London Fletcher and Sam Mills are each responsible for two of them, with Bill Pellington (’64 Colts) rounding out the group.

Fletcher has never missed a game in his career, a remarkable accomplishment for the 15-year veteran. Consider that only three linebackers have appeared in more games than Fletcher (240): Bill Romanowski (243), Junior Seau (268), and Clay Matthews, Jr. (278). And all three of those players were outside linebackers, giving Fletcher more games than any inside linebacker in NFL history.

Which is pretty incredible for a player who received no awards or postseason recognition until turning 34. If all you knew about Fletcher was his performance from age 34+, you would assume he was a first ballot Hall of Famer. In 2009, he made his first Pro Bowl, and Fletcher was sent again in 2010 and 2011. The last two years, he’s been a second-team All-Pro, giving him some recognition in each of the last four years. Fletcher is on the short list (with Mills and Lewis) for the title of most successful inside linebacker from age 34+.

On the opposite end of the spectrum is Patrick Willis, who has now made the Pro Bowl in each of his first six seasons. The only other defensive players to do that: Derrick Thomas, Lawrence Taylor, Joe Greene, Dick Butkus, and Merlin Olsen. That’s mighty fine company, but it’s hard to find any flaws in Willis’ game. Not a fan of Pro Bowls? Since 1970, Lawrence Taylor, Reggie White, and Willis are the only defensive players with five first-team All-Pro honors in their first six seasons.
[continue reading…]

{ 8 comments }

Scott Kacsmar recently wrote about Robert Griffin III’s struggles on third downs last season. Despite Griffin’s otherworldly rate stats, that was one area where he really struggled in 2012. I thought it would be interesting to take a look at how all quarterbacks fared on “third downs” last season. I put that in quotes because I’m including fourth down data, but don’t want to write third and fourth down throughout this post. Regular readers may recall I did something similar last November, but now we can work with full 2012 season numbers.

To grade third down performance, I included sacks but threw out all rushing data (not for any moral reason, just in the interest of time). The first step in evaluating third down performance is to calculate the league average conversion rate on third downs for each distance. Next, I came up with a best-fit smoothed line based on the data, which is based off the following formula:

Conversion Rate = -0.0001 * Distance^2 – 0.0224 * Distance + 0.5301

Take a look at the table below. For example, there were 309 passes (i.e., pass attempts or sacks — scrambles are not included) and the league-wide conversion rate was 51.1%. Using the best-fit formula, the smoothed rate is 50.8%. There is nothing groundbreaking here — the conversion rates drop as the “to go” number increases, but it helps to quantify what we already know.

To GoPassesFirst DownsRateSmoothed Rate
130915851.1%50.8%
241520850.1%48.5%
348720742.5%46.2%
451222744.3%43.9%
555922640.4%41.6%
654122842.1%39.2%
752118134.7%36.8%
842614333.6%34.5%
936511631.8%32%
1072822030.2%29.6%
112137133.3%27.2%
121533925.5%24.7%
131352417.8%22.2%
141072220.6%19.7%
151432215.4%17.2%
166258.1%14.6%
17681217.6%12%
185036%9.5%
195335.7%6.8%
204836.3%5%

[continue reading…]

{ 23 comments }

The Redskins relied on rookies more than most

The Redskins relied on rookies more than most.

The Washington Redskins were powered by a pair of rookie stars in 2012. We all know about Robert Griffin III, but sixth round pick Alfred Morris finished second in the league in rushing. Griffin’s efficiency numbers were unmatched — he led the NFL in both yards per pass and yards per run — en route to 3200 passing yards and 815 rushing yards. Morris gained1,690 yards from scrimmage; add in Kirk Cousins‘ 466 passing yards and 22 rushing yards, and Washington rookies produced 6,193 “yards” in 2012. I put that in quotes because it’s not customary to sum players’ passing, rushing, and receiving yards, but I think that’s the right idea for the point of this post: figuring out which teams have most relied on rookies.

That 6,193 figure is the second most amount of “yards” produced by a group of rookies in NFL history. The leader in the clubhouse? The 2012 Indianapolis Colts, behind Andrew Luck, Vick Ballard, T.Y. Hilton, Dwayne Allen, Coby Fleener, LaVon Brazill and Dominique Jones. The third place spot belongs to the 2012 Cleveland Browns: Brandon Weeden, Trent Richardson, Josh Gordon, Travis Benjamin, Josh Cooper, and Brad Smelley combined for over 6000 yards.

What if we instead look at percentage of team yards (defining yards as the sum of all passing, rushing, and receiving yards)? Expansion teams would begin to dominate the list — some AFL teams in 1960, the ’68 Bengals, and the ’02 Texans, for example. But what if we look at only non-expansion teams since 1950?

In that case, the 2012 Colts come in second, behind another Colts team.
[continue reading…]

{ 4 comments }

Forgotten Stars: Hugh Taylor

Bones stretches for a touchdown

Bones stretches for a touchdown.

Only three players in NFL history have been responsible for half of their team’s receiving touchdowns over a six-year period: Don Hutson, Jerry Rice, and Hugh Taylor. You probably don’t know much about Taylor, the Washington Redskins star receiver who played from 1947 to 1954. In his first game in the NFL, he caught 8 passes for 212 yards and 3 touchdowns, giving him the record for receiving yards in a player’s first game that stood until 2003.  In his last game, he caught five passes for 106 yards and three touchdowns.  In between those games, he was a star receiver on one of the worst teams in the NFL.  Despite the short career, Taylor came in at #63 on my list of the best receivers of all time. His most impressive season came in 1952, when he was responsible for 45% of the Redskins’ receiving yards and produced the 52nd-best season ever by a wide receiver.

At 6’4, Taylor was one of the tallest receivers of his era, but at only 194 pounds, he was also very deserving of his nickname: Bones. Taylor made up for his skinny physique with a long stride that enabled him to get behind defenders.  I spoke with T.J. Troup, an NFL historian who has coached wide receivers at the college and high school levels, for his thoughts on Taylor. Troup owns a significant amount of NFL film from the late ’40s and ’50s, making him the perfect source for this subject.  He described Taylor to me as one of the best home-run threats of his day, with a playing style similar to other long-striders like Harlon Hill, Don Maynard, and Lance Alworth. The numbers certainly back that up.

The table below shows all receivers who were responsible for at least 39% of a team’s receiving touchdowns over a six-year period.  Note that several receivers would show up multiple times on this list, so for players like Hutson, I’ve limited them to their single best six-year stretch. Taylor’s stretch from ’49 to ’54 ranks second on the list:

[continue reading…]

{ 9 comments }

The origin of the name ‘Redskins’

The uniform worn by the Boston Redskins in 1935

The debate concerning whether the Washington Redskins should change its name has resurfaced in recent weeks. I have my opinion as to whether a name change is appropriate, but nobody cares to read that. Instead, I’d like to recount the history behind the name.

The nickname ‘Redskins’ predates the team playing football in Washington. The organization began playing football in 1932 — in Boston — under the nickname Braves. That was changed in 1933 to Redskins, and the franchise moved to Washington in 1937.

So where did the name Braves come from? The NFL was a fledgling league in the ’20s and ’30s, and teams in that era often chose names synonymous with the local baseball team. George Halas saw the success of the Cubs and named his team the Bears. When the Portsmouth Spartans moved to Detroit in 1934, the name “Lions” made sense for a city that already loved the Tigers. Major League Baseball’s San Francisco Giants began playing in New York in the 19th century, so it didn’t take the football team long to come up with a nickname in 1925. Like the Giants, the Boston football team simply copied one of the baseball team’s names — and they didn’t pick ‘Red Sox’. In 1932, the Atlanta Braves were still playing in Boston at Braves Field, and since that’s where the football team was scheduled to play, I imagine the team spent all of several seconds coming up with a name.
[continue reading…]

{ 79 comments }

Season in review: AFC and NFC East

This season, I published power rankings after each week where I stated my updated projected number of wins for each team. The point of those posts was to put in writing my thoughts at that time, so that once the season was over, I could look back and see how I did. Over the next two weeks, that’s exactly what we’re going to do.

The picture below graphs my projections for each team for each week of the season. I’ve also added the Vegas futures win totals for each team from the pre-season as the first data point in each graph and the final number of regular season wins for each team as the final data point. My projected win totals for each week N come following the conclusion of week N (i.e., my week 1 power rankings were released after week 1).

AFC East

New England Patriots

Pre-season Projection: 12 wins
Maximum wins: 13 (after weeks 1 and 14)
Minimum wins: 10 (after weeks 6 and 7)
Week 1 comment: Incredible offensive weapons, an improved defense and a cupcake schedule. Only injuries on the offensive line or to Tom Brady could derail them.

The Patriots started hot with a big win over the Titans, but managed to lose nail-biters to the Cardinals and Ravens the next two weeks. A loss in Seattle — which was an upset, at the time — dropped them to 3-3 and my projected total to just 10 wins. An overtime win over the Jets the following week was unimpressive and didn’t cause me to bump them, but I kept steadily increasing their win total after that.

In the end, it was another monster statistical season for Brady and the Patriots. New England broke a record for offensive first downs and finished with the third most points scored in a season. I was a little bumpy in my New England projections, but they ended up landing right on the Vegas number.

New York Jets
Pre-season Projection: 8.5 wins
Maximum wins: 9 (after weeks 1 and 2)
Minimum wins: 6 (first after week 8)
Week 1 comment: The additions of Quinton Coples and LaRon Landry were easy to mock, but these two could make the Jets defense a top-three unit. So far, so good. Right tackle Austin Howard exceeded expectations by infinity against Mario Williams, and his play this year will be tied to the Jets success on offense.

The Jets best game of the season came in week 1, which inspired a glimmer of early-season hope. In the end, Coples and Landry had strong seasons, but the loss of Darrelle Revis and the disappointing years by Calvin Pace, Bryan Thomas, and Aaron Maybin prevented the Jets from having a complete defense. Mark Sanchez regressed, and injuries to Santonio Holmes, Dustin Keller, and Stephen Hill didn’t help the offense. Rex Ryan lost control of the team, again, and the Jets struggled against good teams early before disappointing against bad teams late. For the second straight year, the Jets lost their final three games of the season, and it appears like they will fire the offensive coordinator again, too.
[continue reading…]

{ 1 comment }

Extreme Outliers: Rookie Edition

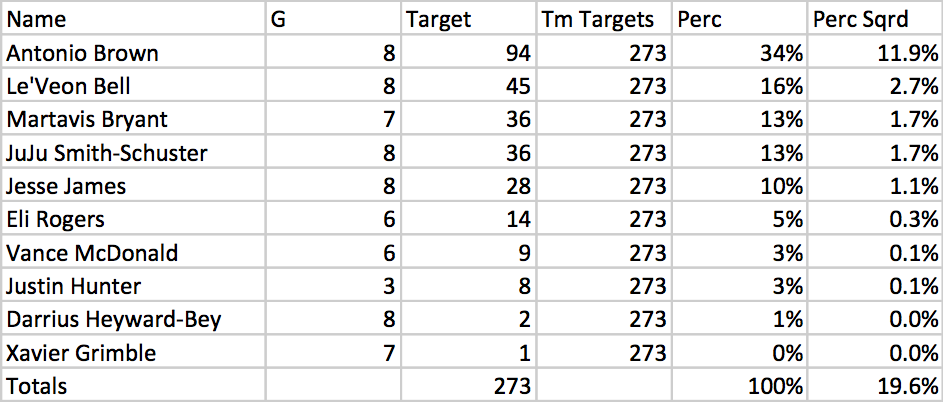
Griffining: Playing for a coach that tries to help you.

Both Andrew Luck and Robert Griffin III have been very successful this year. Griffin ranks 2nd in Y/A, 2nd in AY/A, 4th in NY/A, and 4th in ANY/A, an incredible performance nearly across the board (he’s 23rd in sack rate) by the Redskins rookie. He also is leading the league with a 69.1% completion rate and ranks 5th in passer rating. Luck ranks only 23rd in Y/A, 22nd in AY/A, 21st in NY/A, and 18th in ANY/A, respectable numbers for a rookie but on the surface, little more than that. He does rank 7th in sack rate, which is an excellent sign, but he ranks last in the NFL in completion percentage (in the non-Mark Sanchez division) and only 25th in passer rating.

But there are some other stats out there that paint a different picture. ESPN’s Total QBR ranks Griffin 11th overall — slightly below most of his other metrics — but ranks Luck as the fourth most effective quarterback so far this season. Also, despite Griffin’s edge in most metrics, the Colts and Redskins are essentially tied in three key drive metrics — points per drive, yards per drive and drive success rate — and I don’t think that’s because Donald Brown is so awesome. As Nate Dunlevy pointed out to me, one reason for this is that Luck has accumulated a large number of rushing first downs: Luck is tied for the league lead with Arian Foster on third down rushes that resulted in a first down. And once you account for strength of schedule, Luck vaults to #1 on the QBR list.

But let’s put aside effectiveness for right now. Some advanced metrics show you that they’ve been skinning cats in very different ways:

  • According to Advanced NFL Stats, Luck has thrown a pass 15 yards past the line of scrimmage on 24.3% of his throws, the 5th highest rate in the league. Griffin ranks 32nd with a deep rate of just 12.2%, ahead of only Matt Hasselbeck.
  • If you completely removed Yards After the Catch from the equation, Luck would rank in the top 10 at 4.5 yards per attempt while Griffin would rank 25th with just 3.5 yards per attempt.
  • Griffin ranks third behind just Christian Ponder and Philip Rivers when it comes to percentage of passing yards that are due to YAC, at 58.7%; Luck ranks 32nd, ahead of only John Skelton and Mark Sanchez, with only 33.4% of his yards coming on yards after the catch by his receivers.
  • According to Footballguys.com’s subscriber content, the Colts have targeted their wide receivers on 72.1% of their passes, the second highest rate in the league behind the Rams. The Colts are also last in the league with only 6.4% of their passes aimed at running backs (this also jives with the numbers from Mike Clay of Pro Football Focus.). The Redskins are more middle of the road in these metrics, but Andrew Luck is being forced to rely on his wide receivers with no real receiving threat in the backfield to help him out. As a result, it’s probably not too surprising that his completion percentage is so low.

Luck has also excelled in the two-minute drill and no-huddle situations early this year, although Griffin has been no slouch in those departments, either. But it’s clear that the Colts — rightly or wrongly — aren’t treating Luck with kid gloves. In fact, one could argue that they’re treating him no differently than they did Peyton Manning. Luck is averaging 44.3 pass attempts per game so far this season, second behind only Drew Brees. With a mediocre defense and a bad running game, the Colts are basically putting each game in the hands of Luck to win. Griffin is averaging only 27.8 pass attempts per game right now, and the Redskins have done a fantastic job molding the offense to to suit Griffin’s strengths.

Griffin’s numbers are better right now — ESPN excluded, of course — but that may be a reflection that the Shanaclan is more nurturing than Bruce Arians. Griffin’s success is outstanding, but Luck has been doing just as well under much more challenging conditions.

Update: Jeff Bennett, one of the creators behind ESPN’s Total QB, e-mailed me some notes this morning:

We break rushing out into two categories, scrambles and designed rushes. The quarterback receives more credit for scrambles then designed rushes – the reason being designed rushes are, well, designed to help the quarterback get more yards on the rush. Scrambles are not. Whatever positive or negative that comes from those is mostly on the quarterback.

So back to Luck. He has nine first down rushes this season on scrambles, most in the NFL. Seven of the nine have come on 3rd down, which generally is more important since the alternative to not picking up a 1st down is likely a punt instead of 2nd or 3rd down. No one else in the league has more than three 1st down rushes on scrambles.

Luck’s average pass is traveling 9.8 yards downfield this season. That is the third longest average pass distance in the league (behind Joe Flacco and Jay Cutler). Griffin averages 7.2 yards, a full yard below league average.

The average quarterback this season is getting 56% of their passing yards via “air yards” (meaning 44% of yards are coming after the catch). Griffin has 43% of his yards through the air. Luck has 68%.

{ 3 comments }

The fountain of youth consists of two parts levitation and one part Matt Schaub

In a year where offensive fireworks dominated the headlines, here’s a piece of trivia on the other side of the ball: 36-year-old London Fletcher led the league in tackles. Fletcher, like Ray Lewis, is past the point where he can be referred to by his name alone. Instead, both get the honorific “ageless” before their names. The ageless Ray Lewis made his thirteenth Pro Bowl last season, putting him one behind Merlin Olsen and Bruce Matthews for the record. While it’s tempting to say Lewis is making Pro Bowl berths based on reputation now, I don’t think it’s his play is undeserving of such recognitiion. According to Pro Football Focus, Lewis was the 5th best inside linebacker last season. As for London Fletcher, he also registered in the top ten according to PFF. And while Fletcher was never as dominant as Lewis, ‘ageless’ simply has replaced ‘criminally underrated’ for Fletcher, a moniker that preceded his name most of the time for the last decade.

I think most of us know that it’s pretty incredible that these two are 37-years-old and still playing at high levels (well, at least we expect them to in 2012). But do we really recognize how truly rare this is? There are eleven modern era inside linebackers currently enshrined in the Pro Football Hall of Fame. The table below lists them chronologically based on the year they entered the league. The columns show the “Approximate Value” or “AV” score (as defined by Pro-Football-Reference) assigned to each linebacker for each season during his thirties.

Linebacker3031323334353637
Mike Singletary181213159000
Harry Carson71013149600
Jack Lambert1717200000
Willie Lanier95500000
Dick Butkus156000000
Nick Buoniconti91116149010
Ray Nitschke16151097220
Sam Huff118860600
Les Richter119200000
Joe Schmidt172190000
Bill George171415919609
Average13
10875201

[continue reading…]

{ 3 comments }

This is a starting NFL quarterback in an NFL uniform. Welcome to 2012.

Andrew Luck and Robert Griffin III were drafted as franchise saviors, and have been expected to start on opening day for months; more recently Brandon Weeden in Cleveland and Ryan Tannehill in Miami won starting jobs. Then, last night, Pete Carroll announced that Russell Wilson had beaten Matt Flynn in the Seahawks quarterback battle. Barring injury, we’ll see five rookie quarterbacks starting on opening day for the first time since 1950 (and likely ever). Before Wilson, we were already in record territory, as no more than three teams have ever started the season with rookie quarterbacks since 1950 (and likely ever). In 1969, Roger Staubach, Greg Cook and James Harris were week one starters for the Cowboys, Bengals and Bills. The year before, Greg Landry, Dewey Warren, and Dan Darragh started for the Lions… Bengals and Bills. And in the AFL’s inaugural season, three teams fielded rookie quarterbacks. But on average, less than one rookie quarterback has started a team’s opening game each season since the merger.

Last year, Cam Newton and Andy Dalton were opening day starters, and their success (along with the success of Joe Flacco and Matt Ryan) have undoubtedly made teams become more willing to start rookie quarterbacks. In fact, the youth movement goes beyond just this year’s class: in addition to Newton and Dalton, Jake Locker, Christian Ponder, and Blaine Gabbert will be second-year quarterbacks starting in week one this season. That’s another record, breaking the seven such quarterbacks in 2000. Remember 1999, the Year of the Quarterback in the NFL Draft? Tim Couch, Donovan McNabb, Akili Smith, Cade McNown, and Daunte Culpepper were all high first-round draft picks, and all were sophomore starters in 2000. Shaun King, fresh off a strong late-season run for Tampa Bay, joined the group in week 1 of the 2000, as did Jeff Garcia in San Francisco.

What’s the explanation? Luck, Griffin, and Newton were uber elite talents who were too good to sit. Wilson legitimately won the Seahawks job in training camp and preseason, a rare event in any era for a rookie quarterback. But the rest of the group — Weeden, Tannehill, Dalton, Gabbert, Ponder, and Locker — seem to signal a shift in NFL philosophy. The table below lists all quarterbacks drafted in the top 40 — but not in the top 5 — since 1970, and the first year in their career when they started for their team in week one:
[continue reading…]

{ 2 comments }