Let’s look at each round of the NFL playoffs,
Wild Card Round
There are two games played here in each conference: the 6 seed travels to on the road to face the 3 seed, and the 5 seed visits the 4 seed. The 1 and 2 seeds have byes.
My assumptions throughout this post are (1) home field advantage matters, and (2) the stronger seed is the better team, with the exception of 4 vs. 5. With 4-team divisions, the best team to not win its division — that is, often, the 2nd best team in the division with a very good division winner — is more often than not a better team than the worst division winner.
Still, home field advantage matters. So I am assuming that the 3 seed has a 60% chance of winning its game, while the 4 seed has a 55% chance of winning its game (this is lower than the general rule that the home team wins about 57% of games).
This means, after the wild card round, there’s a 100% chance that the 1 seed remains, a 100% chance that the 2 seed remains, a 60% chance that the 3 seed remains, a 55% chance that the 4 seed remains, a 45% chance that the 5 seed remains, and a 40% chance that the 6 seed remains. If you want to change these percentages, that’s very easy; more on that at the end of this post.
Division Round
Who will the 1 and 2 seeds face in the Division Round? The 1 seed has a 33% chance of facing the 4 seed, a 27% chance of facing the 5 seed, and a 40% chance of facing the 6 seed. This is because the 1 seed always plays the 6 seed when the 6 seed wins in the Wild Card round (40% chance), and faces the 4/5 winner 60% of the time. The 2 seed has a 60% chance of facing the 3 seed (when the 3 seed beats the 6 seed), a 22% chance of facing the 4 seed, and an 18% chance of facing the 5 seed.
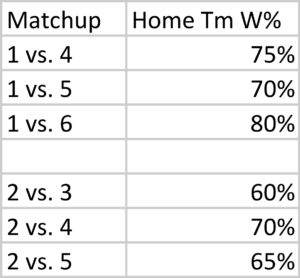
So what will happen in the Division round? Again, we need to come up with some probability; I took a stab at that below. If you don’t like them, you can change them letter!
 These seem reasonable to me; maybe you want to give the home team a bigger edge, but they’re close enough (and simple!) for our purposes. So how likely is each seed to make the conference championship game using these numbers?
The 1 seed can make it by beating the 6 seed (40% chance that game happens, 80% chance of winning, therefore a 32% chance the 1 seed makes the Conference Championship Game by beating the 6 seed), the 5 seed (27%, 70%, 19%) or the 4 seed (33%, 75%, 25%): therefore, the 1 seed has a 76% chance of getting to host the title game.
The 2 seed can make it by beating the 5 seed (18% chance, 65% conditional win probability, 12% chance the 2 seed makes it by beating the 5 seed), the 4 seed (22%, 70%, 15%), or the 3 seed (60%, 60%, 36%), for a 63% chance.
You can do this calculation for all the seeds. The 6 seed, for example, only has an 8% chance (40% chance in the Wild Card round, 20% chance in the Divisional Round) of getting to the CCG. The 3 seed has a 24% chance, while the 4 and 5 seeds each have around a 14-15% chance.
In fact, the 5 seed has a slightly better chance of making it to the CCG than the 4 seed, because of the assumption that it is the better team. This is offset, of course, by being on the road in the Wild Card round.
Conference Championship Game
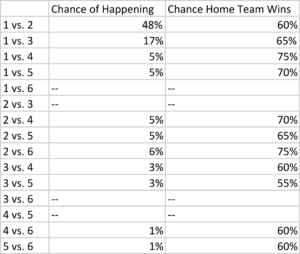
With 6 teams in the playoff field, there are 30 possible combinations (6 x 5) for the conference champinoship game. Of course, only half of those truly exist because home field automatically goes to the better seed. And 4 of those 15 combinations are impossible — 1 can’t play 6 and 2 can’t play 3, since it would automatically play in the Division Round, while 3/6 and 4/5 can’t meat in the CCG since they meet in the Wild Card round. The table below shows the chance of each combination happening, along with my projection of the likelihood that the home team wins.
 Again, if you disagree with any of these results, you will be able to change them! Just keep reading.
Conference Champion
If you perform all of the calculations using the assumptions in this post, you’ll see that there’s a roughly 48% chance the 1 seed wins the conference, a ~30% chance the 2 seed makes it to the Super Bowl, and the percentages drop to ~10%, 4-5%, 5-6%, and 2-3% for the 3, 4, 5, and 6 seeds.
Monte Carlo Simulation
One way to re-create the above is by performing a Monte Carlo simulation. You can download the Excel file that I created here. This file simulates 32,000 NFL postseasons with random results, weighted based on the percentage chance the home team has of winning each game.
Here’s how to read/use this sheet. On the Wild Card sheet, the pre-game win probabilities are in cells V11 and V12, which are highlighted in yellow. Let’s say you think the 5 seed in a given season is really good and/or the 4 seed is really weak; in that case, let’s change the home team win probability from 55% to 40%. Well, this still only shifts the Conference Championship odds (in Column S on the “ccg” sheet) a little bit; the 5 seed jumps from just over 5% to just over 7%, while the 4 seed drops to about 3.5%.
Let’s go to the “div” sheet. Let’s say you think the 1 seed is really strong, and should have a 90% chance of winning no matter its opponent in the Division Round. Even still, this only jumps its odds of winning the conference to about 57%.
What do you think?
