≡ Menu

How The Rams Got Here: The Dream Offseason Was 2017

In 2013, the Rams traded up to draft Tavon Austin with the 8th pick and Alec Ogletree at the end of the first round; the franchise also used third round picks on T.J. McDonald and Stedman Bailey.  None of those players, or any other player drafted in 2013 by the Rams, is still on the team. In free agency, St. Louis signed Jake Long from Miami and Jared Cook from Tennessee, and neither of those players — or anyone else signed by the Rams that year — are still on the team.

The 2014 Draft didn’t get off to a better start — St. Louis drafted Greg Robinson with the 2nd overall pick, one of the largest draft busts in recent memory.  But Les Snead — the same GM who traded up for Austin, whiffed on the rest of the 2013 draft, and then drafted Robinson — has been on a very hot streak ever since.  An hour after taking Robinson, the team took Aaron Donald with the 13th pick that year.  Then the Rams drafted Todd Gurley with a 1st round pick in 2015, and traded up for Jared Goff with the 1st pick in 2016.  Those are the team’s best three players, but the bulk of the current roster was acquired in 2017.

Seven starters were added in 2017: wide receiver Robert Woods, offensive linemen Austin Blythe, John Sullivan, and Andrew Whitworth were all veteran acquisitions for the team, while the Rams used 3rd and 4th round picks on LB Samson Ebukam, S John Johnson, and wide receivers Cooper Kupp (8 starts) and Josh Reynolds (8 starts as Kupp’s replacement). It was not the star-studded, Kamara-esque class the Saints had that year, but seven starters is still seven starters.

The graph below shows the amount of AV on the 2018 Rams that was added each year, both via the draft and overall: [continue reading…]

{ 5 comments }

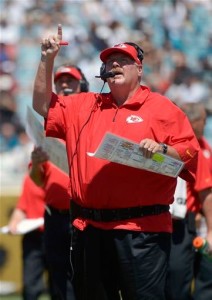
Reid looks up at the scoreboard and sees more points

Tonight is one of the games of the year: the 9-1 Chiefs against the 9-1 Rams. This is perhaps the best regular season game, by record, since another primetime game featuring Andy Reid’s Chiefs back in 2013, when the 9-0 Chiefs traveled to Denver to face the 8-1 Broncos.

Back then, I wrote about the best regular season matchups ever. And I’ve also written about the worst regular season matchups ever. And to be clear, there’s no right or wrong way to identify the best or worst matchup ever, even if you just base things on record.

You can’t use just winning percentage, because it’s hard to compare teams who have played a different number of games (is a matchup of two 3-0 teams better than a matchup of two 9-1 teams? I don’t think so, but winning percentage says otherwise). One solution is to add 11 games of .500 football to each team; in other words, add 5.5 wins and 5.5 losses to each team. For the Chiefs and Rams, that would make both teams 14.5-6.5, which translates to an adjusted winning percentage for both Kansas City and Los Angeles of 0.690. A game between two 3-0 teams would have an average adjusted winning percentage of only 0.607, which is one reason why I like this formula.

So where does Rams/Chiefs rank? With all due respect to the classic 49ers/Browns games from 1948, I’m limiting today’s post to games since 1950. And tonight’s matchup is the 20th best game during that period. The table below shows the best matchups in the NFL since 1950. Each game is listed from the perspective of the winner, and displays each team’s each team’s adjusted winning percentage and the average of the two adjusted records. Finally, I’ve included a linkable boxscore to each game. [continue reading…]

{ 0 comments }

Todd Gurley Through 50 Games

Todd Gurley is now 50 games into his NFL career, and he is only getting better. He is averaging an impressive 109.4 yards from scrimmage per game, but he’s been noticeably better since Sean McVay arrived.

As a rookie in 2015, Gurley averaged about 100 yards from scrimmage per game but faded down the stretch, topping the century mark just once in his last seven games. In 2016, in an ugly Jeff Fisher offense, Gurley was extremely consistent, but not in a good way: he did not pick up 109 yards in a single game that season. But since McVay arrived, Gurley has topped his current career average in 16 of 21 games.

The graph below shows the yards from scrimmage gained by Gurley in every regular season game of his career, color-coded by year. [continue reading…]

{ 0 comments }

Largest Increases in Team Scoring

Last year, the Los Angeles Rams scored 224 points, or just 14.0 points per game. That ranked last in the NFL, 40 points behind the 31st-ranked Cleveland Browns. But as noted earlier this week, the 2017 Rams have scored 212 through seven games, a 30.3 points per game average that ranks 2nd in the NFL.

If that holds, the Rams increase of 16.3 points per game would rank as the third largest ever, and the biggest increase since 1950. [Update: Los Angeles ended the season averaging 29.9 points per game; that 15.9 PPG increase remains the third largest in NFL history, and displaces the 1999 Rams for the biggest year-over-year increase since 1950.] The table below shows the 100 biggest per-game increases in scoring in pro football history: [continue reading…]

{ 3 comments }

Sean McVay, Bill Parcells, and Excellent Coaching Debuts

You know your debut goes well when you can crack jokes with your punter

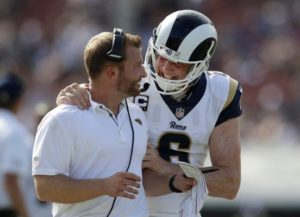
Over the last ten years, no team has had a worse record than the Rams. And two of the last three years have started in particularly ugly fashion: last season, the Los Angeles Rams lost 28-0 as 2.5-point favorites in San Francisco. And two years earlier, the St. Louis Rams lost by 28 points to the Vikings as 3.5-point favorites on opening Sunday (more on this game in a bit). But on Sunday, in the first game with a new coaching staff headlined by 31-year-old Sean McVay, OC Matt LaFleur, and DC Wade Phillips, the Rams walloped the Scott Tolzien-led Colts, 46-9.

The Rams were expected to win because, well, Tolzien, but Los Angeles was only favored by 3.5 points. That means Los Angeles, by virtue of a 37-point win, covered by a whopping 33.5 points.  For some perspective, the only other team to cover by four touchdowns on Sunday was Jacksonville, in game 3 of the Doug Marrone era.  Covering by 33.5 points is a ton: the Rams never did it during the Greatest Show On Turf days although the team did do it three times during the Jeff Fisher era, including… the last time the Rams played the Colts. That game, you may recall, was the, um, Tavon Austin breakout game.

Anyway, covering by 33.5 points is pretty rare, but it’s really rare when it comes in a head coach’s first game with the team. In fact, it’s the largest cover by a head coach in his first game since 1990.  And among all coaches in their first games with a new team (i.e., including coaches in their first stop at a new gig), it’s the third largest cover since 1990.  Take a look at how each coach from 1990 to 2016 did in week 1 with a new team: [continue reading…]

{ 4 comments }

Today at 538: A look at how bad the Rams offense has been under Jeff Fisher.  After a 3-1 start this year, things have quickly gone downhill.

Since then, L.A. has gone 1-7, with the lone victory coming in a 9-6 snoozer against a bad Jets team featuring quarterback Bryce Petty in his first NFL start. And if there’s a theme to the Rams’ unyielding mediocrity under Fisher, it’s a bad offense that seems to get worse the more resources it’s given.

L.A. ranks last in scoring, yards and first downs, and in the case of the latter two categories, for the second year in a row.

You can read the full article here.

{ 3 comments }

The Rams Return to Los Angeles: How Will They Do?

It’s now official: the Rams are heading back to Los Angeles, home of the team from 1946 to 1994. The Rams played in Cleveland during the team’s first decade of existence before heading the league’s westward expansion after World Warr II. The Rams played in Memorial Coliseum from ’46 to ’79, before moving to Anaheim Stadium from 1980 to 1994. It is still unclear where the team will play in the short term, although a return to the Coliseum seems likely. But beginning in 2019, the team will play in Inglewood, California.

A three-year period at an interim stadium is an interesting phenomenom to analyze, and will probably be worthwhile to examine in say, three years. In general, teams have only a minimal home field advantage during year one in a new home, so a three-year window at the Coliseum could hurt the Rams on-field product a little bit (and the same goes for the 2019 season at the new stadium). But for now, let’s look at the bigger move across the country. [continue reading…]

{ 22 comments }

New York Times, Post Week-7 (2015): Todd Gurley; AFC South

This week at the New York Times: Todd Gurley is awesome; the AFC South is not.

Incredibly, Gurley turned 21 in August: He is now the youngest player to rush for 125 or more yards in three consecutive games since at least 1960. Despite not getting his first N.F.L. start until Week 4, Gurley is already making history. He is the first rookie in the N.F.L. since Eric Dickerson in 1983, a Hall of Famer and another Rams player, to rush for 125 yards and average at least 5 yards per carry three times in his team’s first eight games.

..

But this year, the division may reach a new low. Through seven weeks, the four teams in the A.F.C. South have won just four of 19 games outside the division. That puts the division 11 games below .500 in interdivision games. That is the second worst performance in the last 30 years and the worst by any division through seven weeks since the N.F.C. East began the season 4-17 in 1998.>.

You can read the full post here

{ 2 comments }

Sam Bradford and Breaking Out At Age 27

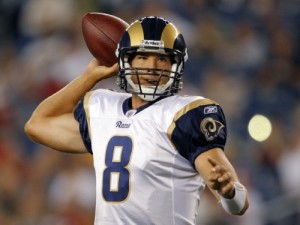
Bradford will move from St. Louis to Philadelphia via 195,000 eight-yard passes.

Bradford will be moving from St. Louis to Philadelphia, presumably via 195,000 eight-yard passes.

As a rookie at age 23, Sam Bradford averaged 4.73 Adjusted Net Yards per Attempt [1]Defined as Passing Yards + 20 * PTDs – 45 * INTs – Sack Yards Lost, all divided by total dropbacks (i.e., including sacks). at a time when the league average ANY/A was 5.73; as a result, we could say that Bradford had a Relative ANY/A of -1.00. The next year, he averaged 4.49 ANY/A with a RANY/A of -1.41. In 2012, he was at 5.64  and -0.30, and in seven games in ’13, he averaged 6.10 and +0.23.  In other words, he’s been mostly below-average for his career.

In order to calculate his career RANY/A to-date, we need to weight his production by his number of dropbacks, which were 624 in ’10, 393 in ’11, 586 in 2012 and 277 in his last season of play. Do the math, and Bradford has a career RANY/A of -0.68 entering the 2015 season. But could he have a breakout year playing with Chip Kelly in Philadelphia?

I decided it would be interesting to look at the question from the reverse angle: how many of the quarterbacks that were really good at age 27 were not so good before that? I defined “really good” to mean a RANY/A of +1.00 on at least 224 dropbacks since 1970 (i.e., a quarterback who had an ANY/A average at least one full yard better than league average, had a significant number of dropbacks, and did so since the merger). I also required that such quarterback had at least 500 career dropbacks through age 26 (Bradford has 1,880 career dropbacks prior to the 2015 season.)  There were 24 quarterbacks who met those criteria.

The best RANY/A season since the merger by an age 27 quarterback was Craig Morton; the Dallas quarterback hadn’t played much prior to 1970 (just 615 career dropbacks), but he had been effective in limited time before then (a career RANY/A of +1.58 prior to the ’70 season).

The second best age 27 season came from Boomer Esiason, in his MVP season of 1988. That year, he had 418 dropbacks and averaged 2.77 ANY/A better than the league average; prior to 1988, he had 1,531 career dropbacks, and a career RANY/A of +1.32. The table below shows that data for all 31 quarterbacks: [continue reading…]

References

References
1 Defined as Passing Yards + 20 * PTDs – 45 * INTs – Sack Yards Lost, all divided by total dropbacks (i.e., including sacks).
{ 7 comments }

Sons of Anarchy

Sons of Anarchy.

I’ve already spent some time this off-season discussing the Rams fantastic front four. Robert Quinn made the Pro Bowl last season, and he’s a good bet to make the trip to Hawaii again this year as long as he stays healthy. Adding Aaron Donald to a line that also has Chris Long and Michael Brockers means St. Louis should have the best 4-3 defensive line in the NFL this year.

The best 3-4 defensive line? That honor probably belongs to the New York Jets. Muhammad Wilkerson made the Pro Bowl last year and would have been a second-team AP All-Pro choice if that organization knew anything about how to create a ballot. The other defensive end, Sheldon Richardson, was the AP Defensive Rookie of the Year. The nose tackle, Damon Harrison, was easily the top run-stuffing tackle in the NFL last year according to Pro Football Focus, and was PFF’s highest-graded nose tackle overall.  You will probably find this hard to believe, but Rex Ryan has said that he wants to have all three of the Jets starting defensive linemen make the Pro Bowl.

How rare is that? Pretty rare — in fact, a 3-4 line has never sent all three players to the Pro Bowl. But even among 4-3 teams, sending three defensive linemen to Hawaii is a very rare feat. Although you might be surprised about when it last happened.

Trivia hint 1 Show


Trivia hint 2 Show


Trivia hint 3 Show

Click 'Show' for the Answer Show

What other teams have sent three defensive linemen to the Pro Bowl during the Super Bowl era? [continue reading…]

{ 2 comments }

The Rams and First Round Linemen

Robert Quinn finds out who the team's offensive coordinator is

Robert Quinn finds out who the team's offensive coordinator is.

Bill Barnwell and Robert Mays do a great job on their NFL podcasts. Yesterday, I listened to their NFC West preview, and it’s just stunning the amount of highly drafted talent the Rams have on both lines. We already know that the Rams have four former first rounders on the team’s starting defensive line, making them the first team since the 2012 Saints to pull off that feat. With Robert Quinn, Chris Long, Michael Brockers, and Aaron Donald, St. Louis has the best defensive line (at least on paper) in the NFL.

But the Rams also have two former first round picks on the offensive line, too, with Jake Long and Greg Robinson, the team’s first overall pick this year.  In fact, consider:

  • St. Louis has three linemen who were first or second overall picks: Long, Long, and Robinson. (Imagine if the Jason Smith pick worked out?)
  • The Rams also have three other linemen drafted in the top fourteen in Quinn, Brockers, and Donald.
  • Add in Rodger Saffold, and seven of the Rams’ starting nine linemen were drafted in the top 33. The exceptions: Scott Wells and Joe Barksdale.

[continue reading…]

{ 6 comments }

In January, I calculated the AV-adjusted age of every team in 2013. In February, I looked at the production-adjusted height for each team’s receivers. Today, we combine those two ideas, and see which teams had the youngest and oldest set of targets.

To calculate the average receiving age of each team, I calculated a weighted average of the age of each player on that team, weighted by their percentage of team receiving yards. For example, Anquan Boldin caught 36.7% of all San Francisco receiving yards, and he was 32.9 years old as of September 1, 2013. Therefore, his age counts for 36.7% of the 49ers’ average receiving age. Vernon Davis, who was 29.6 on 9/1/13, caught 26.5% of the team’s receiving yards last year, so his age matters more than all other 49ers but less than Boldin’s. The table below shows the average age for each team’s receivers (which includes tight ends and running backs) in 2013, along with the percentage of team receiving yards and age as of 9/1/13 for each team’s top four receiving leaders: [continue reading…]

{ 6 comments }

Predictions in Review: NFC West

During the 2013 offseason, I wrote 32 articles under the RPO 2013 tag. In my Predictions in Review series, I review those preview articles with the benefit of hindsight. Last week was the AFC West; this week, the NFC West.

Let’s begin in Arizona, where I actually got one right.

Questioning the Narrative on Larry Fitzgerald, June 20, 2013

The conventional wisdom was that Larry Fitzgerald was going to have a bounce-back year in 2013. That view was widely-held: in fact, I caged a lot of my negative Fitzgerald comments with caveats, as it felt like criticizing Fitzgerald was just something football writers didn’t do. Fitzgerald was one of the game’s best wide receivers when Kurt Warner was under center, and it felt wrong to argue with folks who wanted to give him a pass for the mediocre numbers he produced with John Skelton/Ryan Lindley/Kevin Kolb. With Carson Palmer in Arizona in 2013, the expectation was a big year for Fitzgerald. Instead, he produced 82 passes for only 954 yards, although he did score 10 touchdowns.

For the second year in a row, Fitzgerald failed to lead his team in receiving yards per game, with Andre Roberts (2012) and Michael Floyd (2013) instead earning those honors. So what’s happened with Fitzgerald? I have no idea, but he’s certainly not the same player he was during the Warner/Anquan Boldin days. And while the touchdowns made sure he wasn’t a complete fantasy bust, he gained just 22.2% of all Cardinals receiving yards in 2013, somehow falling short of his 23.6% mark in his miserable 2012 season. [continue reading…]

{ 6 comments }

Bradford looks to check down

Bradford looks to check down.

As a rookie, Sam Bradford ranked last in the league in yards per completion. That year, he averaged 9.92 YPC, 1.61 yards per completion lower than the league average of 11.53. In his second and third years — 2011 and 2012 — Bradford was a little better in that metric, but he still finished 0.65 and 0.34 yards per completion below league average in those seasons. So far in 2013, Bradford has earned his reputation as a checkdown artist: with a 10.21 YPC average, he’s averaged 1.43 fewer yards per completion than the average quarterback.

If you take a weighted average (based on his number of completions in each season), Bradford has been 0.98 yards per completion below league average over the course of his 980 career completed passes. In August, I noted that the Rams have experienced constant turnover at offensive coordinator and wide receiver since Bradford entered the league. This year, with Tavon Austin, Jared Cook, and developing talents like Chris Givens, expectations were high for Bradford. So far, we’ve seen more of the same from Bradford, which means lots of checkdowns and few big plays.

For his career, Bradford has averaged just 10.68 yards per completion. The table below shows the 164 quarterbacks since 1950 to complete at least 850 passes. The far right column represents the difference between each quarterback’s career yards per completion average minus the league average (calculated on a weighted-average basis for each quarterback based on his number of completions in each season) rate. As it turns out, Bradford ranks in the “top five” when it comes to the worst era-adjusted yards per completion averages.
[continue reading…]

{ 2 comments }

Since Sam Bradford was drafted by the Rams in 2010, the only consistent force in St. Louis has been change. Tackle Rodger Saffold, drafted in the second round of the same draft, is the only other player on the 2010 Rams offense who is still on the team. Bradford has already played under three offensive coordinators (Pat Shurmur as a rookie, Josh McDaniels in 2011, and Brian Schottenheimer last year), which means this is the first time in four years he isn’t learning a new system. And while his rookie season was always overrated, his performance last year was better than you think. After adjusting for one of the league’s toughest schedules, Bradford ranked 18th in Adjusted Net Yards per Attempt, despite being saddled with an inferior set of receivers.

How inferior? The table below shows the top six leaders in receiving yards for St. Louis last season:

Games Receiving
Rk Player Year Age Tm G GS Rec Yds Y/R TD Y/G
1 Chris Givens 2012 23 STL 15 12 42 698 16.62 3 46.5
2 Brandon Gibson 2012 25 STL 16 13 51 691 13.55 5 43.2
3 Danny Amendola 2012 27 STL 11 8 63 666 10.57 3 60.5
4 Lance Kendricks 2012 24 STL 16 14 42 519 12.36 4 32.4
5 Steven Jackson 2012 29 STL 16 15 38 321 8.45 0 20.1
6 Austin Pettis 2012 24 STL 14 2 30 261 8.70 4 18.6

Chances are, unless you’re a Rams fan or play fantasy football, you’ve never even heard of four of those names.  And while Amendola was productive when healthy, he missed five games last year (and it’s worth noting that Bradford’s numbers weren’t worse without Amendola in the lineup). Steven Jackson is of course a great player, but there’s only so much help a 29-year-old running back who catches 38 passes can provide to an ailing passing game.
[continue reading…]

{ 5 comments }

More division wins than non-division wins

The Rams finished with the best division record in the NFC West last year at 4-1-1, but St. Louis went only 3-7 in games against non-NFC West opponents. The Jaguars were 0-10 in non-division games last season, but beat both the Colts and Titans to finish 2-4 against the AFC South. Since the merger, three teams have won six more games against division rivals than against non-division opponents. Two of those teams did so in 1998, when the Cowboys went 10-6 thanks to a 8-0 record against the NFC East and a 2-6 mark against the rest of the league (in the playoffs that year, Dallas lost to an NFC East team, a choke that was presumably not Tony Romo’s fault). Over in the AFC, the Titans finished 7-1 against the AFC Central and 1-7 against the rest of the NFL. Technically, the ’82 Dolphins went 7-1 against the AFC East and 0-1 against Tampa Bay during the strike-shortened season, so they fit the criteria, too.

In the new eight-division, four-teams-per-division format, each team plays six games against division opponents and 10 games against non-division opponents. The table below shows all teams since 2002 that won more at least 1.5 more games against division rivals than non-division opponents:
[continue reading…]

{ 0 comments }

Season in review: AFC and NFC West

AFC East and NFC East Season in review
AFC North and NFC North Season in review
AFC North and NFC South Season in review

In the case of the AFC West, a picture can say a thousand words.

AFC West

Denver Broncos

Pre-season Projection: 8.5 wins
Maximum wins: 13 (after weeks 10 through 16)
Minimum wins: 9 (after weeks 3, 5 )
Week 1 comment: Watching Peyton Manning work his magic was a thing of beauty on Sunday night. The less John Fox touches this offense, the better, but I think everyone in Denver already knows that.

Once Peyton Manning proved that he was healthy and back, the AFC West race was effectively over. Officially, that happened in the week 6 comeback over the Chargers. That win only made them 3-3, but here is what I wrote then: According to Advanced NFL Stats, Denver is the best team in the league. Their remaining schedule is absurdly easy, so I’m going to perhaps prematurely give them a two-win bump. Their week 15 game in Baltimore may be for a bye, and I now think Denver is the favorite.

Kudos to Brian Burke’s model for correctly identifying how good the Broncos were early in the year. After week 9, I pegged Denver at 12 wins, and wrote: As a matter of principle, projecting a team to finish 7-1 is never advised. But this seems to be a good place to make an exception.

The next week, I bumped them to 13 wins, and never moved off that number. They got a late Christmas present from Manning’s old team, and now the AFC playoffs will have to go through Denver.

San Diego Chargers

Pre-season Projection: 9 wins
Maximum wins: 9 (after weeks 1, 2, and 4)
Minimum wins: 6 (after weeks 10 through 13, 16)
Week 1 comment: Unimpressive on Monday Night Football, but the schedule lines up for them to succeed. Philip Rivers is still elite, so expecting them to only go 8-7 the rest of the way is probably more of a knock on them than anything else. A healthy Ryan Mathews back will help.

The Chargers schedule was ridiculously easy, but they lost to the Browns, Saints, and Panthers, and couldn’t beat the Ravens, Bengals, or Bucs. The decline of Philip Rivers from elite quarterback to throw-it-out-of-bounds master is depressing, and it’s easy and probably appropriate to point the blame at the general manager. Going into 2013, San Diego will have a new head coach and GM, and we’ll see if that is what was needed to resurrect Rivers’ career.

It’s not easy to remember, but the Chargers were actually 3-1. At that point, I wrote: An unimpressive 3-1 team with a struggling offensive line. I really wanted to keep them at 8 wins, but their schedule is too easy and Philip Rivers — even in a down year — is good enough to lead them to a .500 record the rest of the way.

But by the time they were 3-4, I had already started with the “I can’t think of anything positive to say about the Chargers right now” comments. I summed up the Chargers season after week 13, when I wrote: This team started 2-0 but hasn’t beaten anyone but the Chiefs since then.

Of course, San Diego being San Diego, the Chargers did finish with 7 wins, but it was another disappointing season for the franchise. It’s hard to think back to September, but Vegas really did project the Chargers to win this division.
[continue reading…]

{ 4 comments }

2011 Age-adjusted team rosters

Measuring team age in the N.F.L. is tricky. Calculating the average age of a 53-man roster is misleading because the age of a team’s starters is much more relevant than the age of a team’s reserves. The average age of a team’s starting lineup isn’t perfect, either. The age of the quarterback and key offensive and defensive players should count for more than the age of a less relevant starter. Ideally, you would want to calculate a team’s average age by placing greater weight on the team’s most relevant players.

That’s not easy to do for the 2012 season, but we can apply one method to last year’s rosters. Using Pro-Football-Reference’s Approximate Value system, it’s simple to calculate the weighted age of every team last season, by weighing each player’s age proportionately to his percentage of contribution (as measured by the Approximate Value system) to his team.

Let’s take a look at the (weighted) average age of each offense last season:

Offense

RkTeamAvg Age
1Seattle Seahawks25.7
2Tampa Bay Buccaneers25.7
3Denver Broncos25.9
4Jacksonville Jaguars26.0
5Cleveland Browns26.1
6Pittsburgh Steelers26.2
7Cincinnati Bengals26.3
8San Francisco 49ers26.4
9Green Bay Packers26.4
10Buffalo Bills26.5
11Dallas Cowboys26.6
12Miami Dolphins26.6
13Arizona Cardinals26.7
14Oakland Raiders26.7
15Philadelphia Eagles26.8
16Carolina Panthers26.9
17Chicago Bears26.9
18Minnesota Vikings27.1
19New York Giants27.1
20Baltimore Ravens27.3
21St. Louis Rams27.3
22New York Jets27.3
23Detroit Lions27.4
24Washington Redskins27.4
25Kansas City Chiefs27.6
26New Orleans Saints27.6
27Houston Texans27.7
28San Diego Chargers27.7
29Tennessee Titans27.8
30Atlanta Falcons28.1
31Indianapolis Colts28.4
32New England Patriots28.4

An offense where the star eats Skittle is a young one

It’s not too surprising to see Seattle at the youngest team in the league last year, and they look to have a young offense again in 2012. The Seahawks will get younger at quarterback if either Matt Flynn or Russell Wilson replaces Tarvaris Jackson. At wide receiver, Sidney Rice (26 in 2012), Doug Baldwin (24) and Golden Tate (24) are the projected top three, although the team just added 29-year-old Braylon Edwards. Marshawn Lynch is still just 26, and the Seahawks added Utah State’s Robert Turbin in April’s draft. The offense line, anchored around LT Russell Okung (25) and C Max Unger (26), has all five starters under the age of 30, as are both Zach Miller and Kellen Winslow, Jr..

The Patriots, meanwhile, featured the league’s oldest offense last season. We all know about Tom Brady (34 in 2011) and Wes Welker (30), but Brian Waters (35), Matt Light (34), Logan Mankins (29), and Deion Branch (32) made were older members of the Patriots’ supporting cast. New England has a pair of young tight ends (Rob Gronkowski, Aaron Hernandez) and young running backs (Stevan Ridley, Shane Vereen), but the rest of the offense remains old. Obviously Brady and Welker continue to play at a high level, but the team didn’t wasn’t focused on age when it added wide receiver Brandon Lloyd (32).
[continue reading…]

{ 10 comments }

Steven Jackson is the Ollie Matson of the 21st century. What does that mean? Before we answer that, take a look at Steven Jackson’s impressive career:

Rushing Receiving
Year Age Tm Att Yds TD Y/A Rec Yds Y/R TD YScm RRTD
2004 21 STL 134 673 4 5.0 19 189 9.9 0 862 4
2005 22 STL 254 1046 8 4.1 43 320 7.4 2 1366 10
2006* 23 STL 346 1528 13 4.4 90 806 9.0 3 2334 16
2007 24 STL 237 1002 5 4.2 38 271 7.1 1 1273 6
2008 25 STL 253 1042 7 4.1 40 379 9.5 1 1421 8
2009* 26 STL 324 1416 4 4.4 51 322 6.3 0 1738 4
2010* 27 STL 330 1241 6 3.8 46 383 8.3 0 1624 6
2011 28 STL 260 1145 5 4.4 42 333 7.9 1 1478 6
Career 2138 9093 52 4.3 369 3003 8.1 8 12096 60

[continue reading…]

{ 6 comments }