
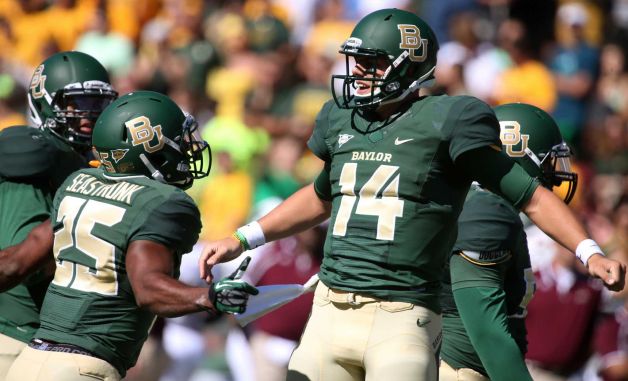
Petty and Seastrunk have yet to break a sweat.
1) For each game not played at a neutral site, 3 points are given to the road team. After that adjustment, all wins and losses of between 7 and 24 points are recorded exactly as such. This means that a 24-10 road win goes down as +17 for the road team, -17 for the home team.
2) With one exception, wins of 7 or fewer points are scored as 7-point wins and losses of 7 or fewer points are scored as 7 point losses. So a 4-point home win goes down as +7 (and not a 1) and a 1-point home loss is a -7 (and not a -4). The one exception is that road losses of 3 or fewer (and home wins of 3 or fewer) are graded as ties. So a 21-20 home victory goes down as a 0 for both teams.
3) Wins/Losses of more than 24 points are scored as the average between the actual number and 24. This is to avoid giving undue credit to teams that run up the score. So a 75-point home win goes down as a 48-point win.
Once we have a rating for each team in each game, we then adjust each result for strength of schedule. This is an iterative process, where we adjust the ratings hundreds of times (to adjust for SOS, you have to adjust for the SOS of each opponent, and the SOS of each opponent’s opponent, and so on.) in Excel. Then we produce final ratings, where the SRS rating is the sum of the Margin of Victory and Strength of Schedule in every week.
After five weeks, what are the results? As usual, the table is fully searchable (type “-0”, for example, to see a list of undefeated teams, or SEC to see all SEC teams.) Right now, the number one team is Baylor, with an average (adjusted) Margin of Victory of 41.5 points per game against an average opponent that is 27.7 points better than average (average includes all football teams at all levels, so all FBS will have a positive grade). Among undefeated teams, no opponent has faced a tougher SOS than Alabama. Below shows all 125 FBS teams.
| Rk | Team | Conf | Conf Rk | G | MOV | SOS | SRS | REC |
|---|---|---|---|---|---|---|---|---|
| 1 | Baylor | B12 | 1 | 3 | 41.5 | 27.7 | 69.2 | 3-0 |
| 2 | Oregon | P12 | 1 | 4 | 35.8 | 28.8 | 64.6 | 4-0 |
| 3 | Alabama | SEC | 1 | 4 | 19.6 | 43.7 | 63.3 | 4-0 |
| 4 | Florida St | ACC | 1 | 4 | 29.3 | 33.8 | 63.1 | 4-0 |
| 5 | Washington | P12 | 2 | 4 | 22.5 | 39.4 | 61.9 | 4-0 |
| 6 | Georgia | SEC | 2 | 4 | 7.3 | 51.5 | 58.7 | 3-1 |
| 7 | LSU | SEC | 3 | 5 | 15.5 | 42.3 | 57.8 | 4-1 |
| 8 | Louisville | AAC | 1 | 4 | 31 | 26.6 | 57.6 | 4-0 |
| 9 | Stanford | P12 | 3 | 4 | 19.3 | 37.6 | 56.8 | 4-0 |
| 10 | Clemson | ACC | 2 | 4 | 20 | 36.5 | 56.5 | 4-0 |
| 11 | UCLA | P12 | 4 | 3 | 28.7 | 26.6 | 55.3 | 3-0 |
| 12 | Missouri | SEC | 4 | 4 | 20.9 | 33.3 | 54.1 | 4-0 |
| 13 | Texas A&M | SEC | 5 | 5 | 15.4 | 38.5 | 53.9 | 4-1 |
| 14 | Ohio State | B10 | 1 | 5 | 24.3 | 29.6 | 53.9 | 5-0 |
| 15 | Texas Tech | B12 | 2 | 4 | 21.4 | 32.3 | 53.7 | 4-0 |
| 16 | Arizona St | P12 | 5 | 4 | 11.3 | 42.2 | 53.4 | 3-1 |
| 17 | Arizona | P12 | 6 | 4 | 17.8 | 34 | 51.7 | 3-1 |
| 18 | Maryland | ACC | 3 | 4 | 25.1 | 26.3 | 51.4 | 4-0 |
| 19 | South Carolina | SEC | 6 | 4 | 5 | 45.7 | 50.7 | 3-1 |
| 20 | Auburn | SEC | 7 | 4 | 7 | 43.1 | 50.1 | 3-1 |
| 21 | Florida | SEC | 8 | 4 | 9.8 | 39.8 | 49.6 | 3-1 |
| 22 | TCU | B12 | 3 | 4 | 6.8 | 42.6 | 49.4 | 2-2 |
| 23 | Illinois | B10 | 2 | 4 | 12.5 | 36.2 | 48.7 | 3-1 |
| 24 | Central Florida | AAC | 2 | 4 | 14.6 | 34 | 48.6 | 3-1 |
| 25 | Wisconsin | B10 | 3 | 5 | 17.3 | 31.3 | 48.6 | 3-2 |
| 26 | Oklahoma | B12 | 4 | 4 | 19.4 | 28.4 | 47.7 | 4-0 |
| 27 | Virginia Tech | ACC | 4 | 5 | 6.4 | 41.2 | 47.6 | 4-1 |
| 28 | Utah St | MWC | 1 | 5 | 18.5 | 28.9 | 47.4 | 3-2 |
| 29 | Oklahoma St | B12 | 5 | 4 | 18.4 | 29 | 47.4 | 3-1 |
| 30 | Georgia Tech | ACC | 5 | 4 | 17 | 29.8 | 46.8 | 3-1 |
| 31 | Utah | P12 | 7 | 4 | 13 | 33.5 | 46.5 | 3-1 |
| 32 | Marshall | CUSA | 1 | 4 | 15.1 | 31.1 | 46.2 | 2-2 |
| 33 | Indiana | B10 | 4 | 4 | 6.8 | 39.2 | 46 | 2-2 |
| 34 | Iowa | B10 | 5 | 5 | 14.1 | 31.6 | 45.7 | 4-1 |
| 35 | Penn State | B10 | 6 | 4 | 14.3 | 31.3 | 45.5 | 3-1 |
| 36 | Northern Illinois | MAC | 1 | 4 | 14 | 31.5 | 45.5 | 4-0 |
| 37 | Boise St | MWC | 2 | 5 | 12.9 | 32.5 | 45.4 | 3-2 |
| 38 | Washington St | P12 | 8 | 5 | 6 | 39.4 | 45.4 | 3-2 |
| 39 | Miami FL | ACC | 6 | 4 | 26.1 | 19.2 | 45.3 | 4-0 |
| 40 | Southern Cal | P12 | 9 | 5 | 3.9 | 41 | 44.9 | 3-2 |
| 41 | Nebraska | B10 | 7 | 4 | 9.8 | 34.5 | 44.3 | 3-1 |
| 42 | East Carolina | CUSA | 2 | 4 | 10.9 | 33.1 | 44 | 3-1 |
| 43 | Mississippi | SEC | 9 | 4 | 6 | 37.8 | 43.8 | 3-1 |
| 44 | Navy | IND | 1 | 3 | 10.8 | 32.8 | 43.7 | 2-1 |
| 45 | Northwestern | B10 | 8 | 4 | 16 | 27.5 | 43.5 | 4-0 |
| 46 | Mississippi St | SEC | 10 | 4 | 11.4 | 31.2 | 42.6 | 2-2 |
| 47 | Tennessee | SEC | 11 | 5 | 4.5 | 37.7 | 42.2 | 3-2 |
| 48 | Houston | AAC | 3 | 4 | 20.8 | 21.1 | 41.8 | 4-0 |
| 49 | Brigham Young | IND | 2 | 4 | 7.5 | 34.2 | 41.7 | 2-2 |
| 50 | Cincinnati | AAC | 4 | 4 | 14.9 | 26.5 | 41.4 | 3-1 |
| 51 | Bowling Green | MAC | 2 | 5 | 12.9 | 28.4 | 41.3 | 4-1 |
| 52 | Vanderbilt | SEC | 12 | 5 | 11.7 | 29.6 | 41.3 | 3-2 |
| 53 | Oregon St | P12 | 10 | 5 | 9.4 | 31.7 | 41.1 | 4-1 |
| 54 | North Texas | CUSA | 3 | 4 | 1.6 | 39.3 | 41 | 2-2 |
| 55 | Kansas St | B12 | 6 | 4 | 7.4 | 33 | 40.4 | 2-2 |
| 56 | Ball St | MAC | 3 | 5 | 14.4 | 25.7 | 40.1 | 4-1 |
| 57 | Wyoming | MWC | 3 | 5 | 12.6 | 27.3 | 39.9 | 3-2 |
| 58 | Ohio U. | MAC | 4 | 4 | 1.3 | 38.4 | 39.6 | 3-1 |
| 59 | Pittsburgh | ACC | 7 | 4 | 1.6 | 37 | 38.6 | 3-1 |
| 60 | Michigan | B10 | 9 | 4 | 14.4 | 23.8 | 38.1 | 4-0 |
| 61 | Texas St-San Marcos | SUN | 1 | 4 | 6.8 | 31 | 37.8 | 3-1 |
| 62 | Syracuse | ACC | 8 | 4 | 10.1 | 27.4 | 37.5 | 2-2 |
| 63 | Arkansas | SEC | 13 | 5 | 4.6 | 32.9 | 37.5 | 3-2 |
| 64 | West Virginia | B12 | 7 | 5 | 0.8 | 36.6 | 37.4 | 3-2 |
| 65 | Iowa St | B12 | 8 | 3 | 0 | 37.1 | 37.1 | 1-2 |
| 66 | Toledo | MAC | 5 | 5 | -0.2 | 37.1 | 36.9 | 2-3 |
| 67 | Minnesota | B10 | 10 | 5 | 12.1 | 24.7 | 36.8 | 4-1 |
| 68 | Fresno St | MWC | 4 | 4 | 5.3 | 31.5 | 36.7 | 4-0 |
| 69 | Boston College | ACC | 9 | 4 | -5.9 | 42.3 | 36.4 | 2-2 |
| 70 | Duke | ACC | 10 | 5 | 4.9 | 31.4 | 36.3 | 3-2 |
| 71 | Buffalo | MAC | 6 | 4 | -7.8 | 44.1 | 36.3 | 2-2 |
| 72 | Rutgers | AAC | 5 | 4 | 12.9 | 23.2 | 36.1 | 3-1 |
| 73 | North Carolina St | ACC | 11 | 4 | 8.9 | 26.7 | 35.6 | 3-1 |
| 74 | Kentucky | SEC | 14 | 4 | -4.6 | 39.4 | 34.8 | 1-3 |
| 75 | Colorado | P12 | 11 | 3 | 0.3 | 33.9 | 34.2 | 2-1 |
| 76 | North Carolina | ACC | 12 | 4 | -7.4 | 41.5 | 34.1 | 1-3 |
| 77 | Texas | B12 | 9 | 4 | 0.5 | 33.2 | 33.7 | 2-2 |
| 78 | Notre Dame | IND | 3 | 5 | 2.2 | 31.3 | 33.5 | 3-2 |
| 79 | Western Kentucky | SUN | 2 | 5 | 3.1 | 30.2 | 33.3 | 3-2 |
| 80 | South Alabama | SUN | 3 | 4 | 0 | 32.5 | 32.5 | 2-2 |
| 81 | Rice | CUSA | 4 | 4 | -2.8 | 35.2 | 32.5 | 2-2 |
| 82 | Virginia | ACC | 13 | 4 | -2.8 | 34.9 | 32.1 | 2-2 |
| 83 | Louisiana-Lafayette | SUN | 4 | 4 | 3.8 | 28.3 | 32.1 | 2-2 |
| 84 | Memphis | AAC | 6 | 3 | 1.3 | 29.1 | 30.4 | 1-2 |
| 85 | California | P12 | 12 | 4 | -15.3 | 45.5 | 30.3 | 1-3 |
| 86 | San José St | MWC | 5 | 4 | -10.1 | 39.9 | 29.7 | 1-3 |
| 87 | Colorado St | MWC | 6 | 5 | -1.6 | 31.1 | 29.5 | 2-3 |
| 88 | Michigan St | B10 | 11 | 4 | 11.1 | 18 | 29.2 | 3-1 |
| 89 | Nevada | MWC | 7 | 5 | -4.7 | 33.6 | 28.9 | 3-2 |
| 90 | Tulane | CUSA | 5 | 5 | 4.2 | 24 | 28.2 | 3-2 |
| 91 | SMU | AAC | 7 | 4 | -18 | 45.6 | 27.6 | 1-3 |
| 92 | Alabama-Birmingham | CUSA | 6 | 4 | -8.4 | 35.6 | 27.2 | 1-3 |
| 93 | Arkansas St | SUN | 5 | 5 | -4.4 | 30.9 | 26.5 | 2-3 |
| 94 | Connecticut | AAC | 8 | 4 | -16 | 42.1 | 26.1 | 0-4 |
| 95 | Kent St | MAC | 7 | 5 | -9.6 | 35.6 | 26 | 2-3 |
| 96 | Texas-San Antonio | CUSA | 7 | 5 | -8.4 | 34.3 | 25.9 | 2-3 |
| 97 | Akron | MAC | 8 | 5 | -11 | 35.9 | 24.9 | 1-4 |
| 98 | Middle Tennessee St | CUSA | 8 | 5 | -2.6 | 27.2 | 24.6 | 3-2 |
| 99 | UNLV | MWC | 8 | 5 | -2.1 | 26.4 | 24.3 | 3-2 |
| 100 | Wake Forest | ACC | 14 | 5 | -3 | 27.3 | 24.3 | 2-3 |
| 101 | San Diego St | MWC | 9 | 4 | -11.5 | 35.7 | 24.2 | 1-3 |
| 102 | Florida Atlantic | CUSA | 9 | 5 | -7.1 | 31 | 23.9 | 1-4 |
| 103 | Troy | SUN | 6 | 5 | -2 | 25.4 | 23.4 | 2-3 |
| 104 | Hawai`i | MWC | 10 | 4 | -15.8 | 37.9 | 22.1 | 0-4 |
| 105 | Army | IND | 4 | 5 | -5 | 26.7 | 21.7 | 2-3 |
| 106 | Tulsa | CUSA | 10 | 4 | -17.5 | 38.9 | 21.4 | 1-3 |
| 107 | Temple | AAC | 9 | 4 | -9.5 | 30.9 | 21.4 | 0-4 |
| 108 | Louisiana-Monroe | SUN | 7 | 5 | -10.6 | 31.7 | 21.1 | 2-3 |
| 109 | Kansas | B12 | 10 | 3 | 2.3 | 18.8 | 21.1 | 2-1 |
| 110 | Purdue | B10 | 12 | 5 | -17.2 | 37.4 | 20.2 | 1-4 |
| 111 | Air Force | MWC | 11 | 5 | -11.3 | 30.9 | 19.6 | 1-4 |
| 112 | Idaho | IND | 5 | 5 | -19.7 | 38.6 | 18.9 | 1-4 |
| 113 | Massachusetts | MAC | 9 | 4 | -22.9 | 40.1 | 17.2 | 0-4 |
| 114 | Miami OH | MAC | 10 | 4 | -25.6 | 42.8 | 17.1 | 0-4 |
| 115 | Southern Miss | CUSA | 11 | 4 | -24.3 | 41.3 | 17 | 0-4 |
| 116 | New Mexico | MWC | 12 | 4 | -9.3 | 25.8 | 16.5 | 1-3 |
| 117 | Florida Int'l | CUSA | 12 | 4 | -32.5 | 47.2 | 14.7 | 0-4 |
| 118 | Louisiana Tech | CUSA | 13 | 5 | -8.8 | 23.4 | 14.6 | 1-4 |
| 119 | UTEP | CUSA | 14 | 4 | -5.5 | 19.7 | 14.2 | 1-3 |
| 120 | Eastern Michigan | MAC | 11 | 4 | -16.6 | 29.6 | 13 | 1-3 |
| 121 | Western Michigan | MAC | 12 | 5 | -18.9 | 31 | 12.1 | 0-5 |
| 122 | Central Michigan | MAC | 13 | 5 | -18.8 | 29.3 | 10.5 | 1-4 |
| 123 | South Florida | AAC | 10 | 4 | -22.5 | 31.3 | 8.8 | 0-4 |
| 124 | Georgia St | SUN | 8 | 4 | -19.3 | 27.7 | 8.4 | 0-4 |
| 125 | New Mexico St | IND | 6 | 5 | -26.1 | 32.8 | 6.7 | 0-5 |
Once again, I’ve set up a page that shows the results of every single FBS game this season. You can view that page here. The single best performance so far this season came by Stanford last week. In Seattle (technically a neutral site game), the Cardinal crushed a decent Washington State team, 55-17.
So why is Baylor, and not Alabama, number one in the SRS? Let’s get one thing out of the way: no, I don’t think Baylor would beat Alabama. The SRS doesn’t know how good these teams actually are — no preseason information is used — all it knows is how the teams have played to date. I am sure Alabama will pass Baylor soon, but for now, here’s the explanation: Baylor has only played three games, and won those games by an average of 62 points. One of them even came against a non-garbage MAC team (Buffalo). The Bulls aren’t good, of course, but they beat Connecticut, who was respectable against Maryland (#18) and nearly beat Michigan. So a beatdown against Buffalo makes Baylor look for real, to the extent any team can look for real after three games against weak teams. Bears quarterback Bryce Petty has thrown for 1,001 passing yards and 8 touchdowns on just 67 pass attempts, giving him a 17.3 AY/A average. Running back Lache Seastrunk, a former Oregon transfer, has averaged 11.0 yards per carry on 38 runs. There’s been nothing but fireworks in Waco, although we should keep expectations tempered. Beating an FCS school and two low-level BCS teams isn’t what made Robert Griffin III a Heisman Trophy winner, and the Bears still have nine conference games to navigate.
With the nonconference schedule now over, things should ease up…. in theory. But for Baylor, their next four games are against West Virginia, Kansas State, Iowa State, and Kansas, perhaps the four weakest teams in the Big 12. We should see Baylor run the schedule up to 7-0, and it wouldn’t surprise me if the Bears are in the top five by then.
As for Alabama? Well, they won a close game (according to the score board) in College Station, which just means that the Tide are considered very good and not a clear number one. And Alabama is docked a bit for only beating Colorado State by 25, since after all, Colorado beat the Rams by fourteen.
In any event, the ratings will get more accurate each week. For now, it’s too early to make any real conclusions. Finally, let’s look at each FBS team from week five, sorted from best to worst by SRS:
| Date | Tm_Conf | PF | Opp | PA | H/R | W/L | Diff | MOV | Opp_Conf | SOS | SRS |
|---|---|---|---|---|---|---|---|---|---|---|---|
| 09-28-2013 | Stanford_P12 | 55 | Washington St | 17 | Neut | Win | 38 | 31 | P12 | 45.4 | 76.4 |
| 09-28-2013 | Washington_P12 | 31 | Arizona | 13 | Home | Win | 18 | 15 | P12 | 51.7 | 66.7 |
| 09-28-2013 | Alabama_SEC | 25 | Mississippi | 0 | Home | Win | 25 | 22 | SEC | 43.8 | 65.8 |
| 09-28-2013 | Arizona St_P12 | 62 | Southern Cal | 41 | Home | Win | 21 | 18 | P12 | 44.9 | 62.9 |
| 09-28-2013 | Oregon_P12 | 55 | California | 16 | Home | Win | 39 | 30 | P12 | 30.3 | 60.3 |
| 09-28-2013 | East Carolina_CUSA | 55 | North Carolina | 31 | Road | Win | 24 | 25.5 | ACC | 34.1 | 59.6 |
| 09-28-2013 | Clemson_ACC | 56 | Wake Forest | 7 | Home | Win | 49 | 35 | ACC | 24.3 | 59.3 |
| 09-28-2013 | LSU_SEC | 41 | Georgia | 44 | Road | Loss | -3 | 0 | SEC | 58.7 | 58.7 |
| 09-28-2013 | Oregon St_P12 | 44 | Colorado | 17 | Home | Win | 27 | 24 | P12 | 34.2 | 58.2 |
| 09-28-2013 | Texas St-San Marcos_SUN | 42 | Wyoming | 21 | Home | Win | 21 | 18 | MWC | 39.9 | 57.9 |
| 09-28-2013 | Georgia_SEC | 44 | LSU | 41 | Home | Win | 3 | 0 | SEC | 57.8 | 57.8 |
| 09-27-2013 | Utah St_MWC | 40 | San José St | 12 | Road | Win | 28 | 27.5 | MWC | 29.7 | 57.2 |
| 09-26-2013 | Virginia Tech_ACC | 17 | Georgia Tech | 10 | Road | Win | 7 | 10 | ACC | 46.8 | 56.8 |
| 09-28-2013 | Iowa_B10 | 23 | Minnesota | 7 | Road | Win | 16 | 19 | B10 | 36.8 | 55.8 |
| 09-28-2013 | South Carolina_SEC | 28 | Central Florida | 25 | Road | Win | 3 | 7 | AAC | 48.6 | 55.6 |
| 09-28-2013 | Ohio State_B10 | 31 | Wisconsin | 24 | Home | Win | 7 | 7 | B10 | 48.6 | 55.6 |
| 09-28-2013 | Houston_AAC | 59 | Texas-San Antonio | 28 | Road | Win | 31 | 29 | CUSA | 25.9 | 54.9 |
| 09-28-2013 | Florida_SEC | 24 | Kentucky | 7 | Road | Win | 17 | 20 | SEC | 34.8 | 54.8 |
| 09-28-2013 | West Virginia_B12 | 30 | Oklahoma St | 21 | Home | Win | 9 | 7 | B12 | 47.4 | 54.4 |
| 09-28-2013 | Boise St_MWC | 60 | Southern Miss | 7 | Home | Win | 53 | 37 | CUSA | 17 | 54 |
| 09-28-2013 | TCU_B12 | 48 | SMU | 17 | Home | Win | 31 | 26 | AAC | 27.6 | 53.6 |
| 09-28-2013 | Florida St_ACC | 48 | Boston College | 34 | Road | Win | 14 | 17 | ACC | 36.4 | 53.4 |
| 09-28-2013 | Western Kentucky_SUN | 19 | Navy | 7 | Home | Win | 12 | 9 | IND | 43.7 | 52.7 |
| 09-28-2013 | Texas A&M_SEC | 45 | Arkansas | 33 | Road | Win | 12 | 15 | SEC | 37.5 | 52.5 |
| 09-28-2013 | Vanderbilt_SEC | 52 | Alabama-Birmingham | 24 | Home | Win | 28 | 24.5 | CUSA | 27.2 | 51.7 |
| 09-28-2013 | Buffalo_MAC | 41 | Connecticut | 12 | Home | Win | 29 | 25 | AAC | 26.1 | 51.1 |
| 09-28-2013 | Oklahoma_B12 | 35 | Notre Dame | 21 | Road | Win | 14 | 17 | IND | 33.5 | 50.5 |
| 09-28-2013 | Northern Illinois_MAC | 55 | Purdue | 24 | Road | Win | 31 | 29 | B10 | 20.2 | 49.2 |
| 09-27-2013 | Brigham Young_IND | 37 | Middle Tennessee St | 10 | Home | Win | 27 | 24 | CUSA | 24.6 | 48.6 |
| 09-28-2013 | Wisconsin_B10 | 24 | Ohio State | 31 | Road | Loss | -7 | -7 | B10 | 53.9 | 46.9 |
| 09-28-2013 | Arizona_P12 | 13 | Washington | 31 | Road | Loss | -18 | -15 | P12 | 61.9 | 46.9 |
| 09-28-2013 | Boston College_ACC | 34 | Florida St | 48 | Home | Loss | -14 | -17 | ACC | 63.1 | 46.1 |
| 09-28-2013 | Illinois_B10 | 50 | Miami OH | 14 | Home | Win | 36 | 28.5 | MAC | 17.1 | 45.6 |
| 09-28-2013 | Missouri_SEC | 41 | Arkansas St | 19 | Home | Win | 22 | 19 | SUN | 26.5 | 45.5 |
| 09-28-2013 | Ball St_MAC | 31 | Toledo | 24 | Home | Win | 7 | 7 | MAC | 36.9 | 43.9 |
| 09-28-2013 | Central Florida_AAC | 25 | South Carolina | 28 | Home | Loss | -3 | -7 | SEC | 50.7 | 43.7 |
| 09-26-2013 | Iowa St_B12 | 38 | Tulsa | 21 | Road | Win | 17 | 20 | CUSA | 21.4 | 41.4 |
| 09-28-2013 | Mississippi_SEC | 0 | Alabama | 25 | Road | Loss | -25 | -22 | SEC | 63.3 | 41.3 |
| 09-28-2013 | Tulane_CUSA | 31 | Louisiana-Monroe | 14 | Road | Win | 17 | 20 | SUN | 21.1 | 41.1 |
| 09-28-2013 | Pittsburgh_ACC | 14 | Virginia | 3 | Home | Win | 11 | 8 | ACC | 32.1 | 40.1 |
| 09-28-2013 | Tennessee_SEC | 31 | South Alabama | 24 | Home | Win | 7 | 7 | SUN | 32.5 | 39.5 |
| 09-28-2013 | Arkansas_SEC | 33 | Texas A&M | 45 | Home | Loss | -12 | -15 | SEC | 53.9 | 38.9 |
| 09-28-2013 | Bowling Green_MAC | 31 | Akron | 14 | Home | Win | 17 | 14 | MAC | 24.9 | 38.9 |
| 09-28-2013 | North Carolina St_ACC | 48 | Central Michigan | 14 | Home | Win | 34 | 27.5 | MAC | 10.5 | 38 |
| 09-26-2013 | Georgia Tech_ACC | 10 | Virginia Tech | 17 | Home | Loss | -7 | -10 | ACC | 47.6 | 37.6 |
| 09-28-2013 | Miami FL_ACC | 49 | South Florida | 21 | Road | Win | 28 | 27.5 | AAC | 8.8 | 36.3 |
| 09-28-2013 | Southern Cal_P12 | 41 | Arizona St | 62 | Road | Loss | -21 | -18 | P12 | 53.4 | 35.4 |
| 09-28-2013 | South Alabama_SUN | 24 | Tennessee | 31 | Road | Loss | -7 | -7 | SEC | 42.2 | 35.2 |
| 09-28-2013 | Arkansas St_SUN | 19 | Missouri | 41 | Road | Loss | -22 | -19 | SEC | 54.1 | 35.1 |
| 09-28-2013 | California_P12 | 16 | Oregon | 55 | Road | Loss | -39 | -30 | P12 | 64.6 | 34.6 |
| 09-28-2013 | Army_IND | 35 | Louisiana Tech | 16 | Neut | Win | 19 | 19 | CUSA | 14.6 | 33.6 |
| 09-28-2013 | UNLV_MWC | 56 | New Mexico | 42 | Road | Win | 14 | 17 | MWC | 16.5 | 33.5 |
| 09-28-2013 | Kent St_MAC | 32 | Western Michigan | 14 | Road | Win | 18 | 21 | MAC | 12.1 | 33.1 |
| 09-28-2013 | Toledo_MAC | 24 | Ball St | 31 | Road | Loss | -7 | -7 | MAC | 40.1 | 33.1 |
| 09-28-2013 | Rice_CUSA | 18 | Florida Atlantic | 14 | Home | Win | 4 | 7 | CUSA | 23.9 | 30.9 |
| 09-28-2013 | Notre Dame_IND | 21 | Oklahoma | 35 | Home | Loss | -14 | -17 | B12 | 47.7 | 30.7 |
| 09-28-2013 | Virginia_ACC | 3 | Pittsburgh | 14 | Road | Loss | -11 | -8 | ACC | 38.6 | 30.6 |
| 09-28-2013 | Duke_ACC | 38 | Troy | 31 | Home | Win | 7 | 7 | SUN | 23.4 | 30.4 |
| 09-28-2013 | Oklahoma St_B12 | 21 | West Virginia | 30 | Road | Loss | -9 | -7 | B12 | 37.4 | 30.4 |
| 09-28-2013 | Fresno St_MWC | 42 | Hawai`i | 37 | Road | Win | 5 | 8 | MWC | 22.1 | 30.1 |
| 09-28-2013 | Kentucky_SEC | 7 | Florida | 24 | Home | Loss | -17 | -20 | SEC | 49.6 | 29.6 |
| 09-28-2013 | Troy_SUN | 31 | Duke | 38 | Road | Loss | -7 | -7 | ACC | 36.3 | 29.3 |
| 09-28-2013 | Air Force_MWC | 42 | Nevada | 45 | Road | Loss | -3 | 0 | MWC | 28.9 | 28.9 |
| 09-28-2013 | Hawai`i_MWC | 37 | Fresno St | 42 | Home | Loss | -5 | -8 | MWC | 36.7 | 28.7 |
| 09-28-2013 | Colorado St_MWC | 59 | UTEP | 42 | Home | Win | 17 | 14 | CUSA | 14.2 | 28.2 |
| 09-28-2013 | Akron_MAC | 14 | Bowling Green | 31 | Road | Loss | -17 | -14 | MAC | 41.3 | 27.3 |
| 09-28-2013 | Minnesota_B10 | 7 | Iowa | 23 | Home | Loss | -16 | -19 | B10 | 45.7 | 26.7 |
| 09-28-2013 | Washington St_P12 | 17 | Stanford | 55 | Neut | Loss | -38 | -31 | P12 | 56.8 | 25.8 |
| 09-28-2013 | Florida Atlantic_CUSA | 14 | Rice | 18 | Road | Loss | -4 | -7 | CUSA | 32.5 | 25.5 |
| 09-28-2013 | Navy_IND | 7 | Western Kentucky | 19 | Road | Loss | -12 | -9 | SUN | 33.3 | 24.3 |
| 09-28-2013 | SMU_AAC | 17 | TCU | 48 | Road | Loss | -31 | -26 | B12 | 49.4 | 23.4 |
| 09-28-2013 | Wake Forest_ACC | 7 | Clemson | 56 | Road | Loss | -49 | -35 | ACC | 56.5 | 21.5 |
| 09-28-2013 | Idaho_IND | 26 | Temple | 24 | Home | Win | 2 | 0 | AAC | 21.4 | 21.4 |
| 09-28-2013 | Miami OH_MAC | 14 | Illinois | 50 | Road | Loss | -36 | -28.5 | B10 | 48.7 | 20.2 |
| 09-27-2013 | San José St_MWC | 12 | Utah St | 40 | Home | Loss | -28 | -27.5 | MWC | 47.4 | 19.9 |
| 09-28-2013 | Wyoming_MWC | 21 | Texas St-San Marcos | 42 | Road | Loss | -21 | -18 | SUN | 37.8 | 19.8 |
| 09-28-2013 | San Diego St_MWC | 26 | New Mexico St | 16 | Road | Win | 10 | 13 | IND | 6.7 | 19.7 |
| 09-28-2013 | Nevada_MWC | 45 | Air Force | 42 | Home | Win | 3 | 0 | MWC | 19.6 | 19.6 |
| 09-28-2013 | Temple_AAC | 24 | Idaho | 26 | Road | Loss | -2 | 0 | IND | 18.9 | 18.9 |
| 09-28-2013 | North Carolina_ACC | 31 | East Carolina | 55 | Home | Loss | -24 | -25.5 | CUSA | 44 | 18.5 |
| 09-28-2013 | South Florida_AAC | 21 | Miami FL | 49 | Home | Loss | -28 | -27.5 | ACC | 45.3 | 17.8 |
| 09-27-2013 | Middle Tennessee St_CUSA | 10 | Brigham Young | 37 | Road | Loss | -27 | -24 | IND | 41.7 | 17.7 |
| 09-26-2013 | Tulsa_CUSA | 21 | Iowa St | 38 | Home | Loss | -17 | -20 | B12 | 37.1 | 17.1 |
| 09-28-2013 | Colorado_P12 | 17 | Oregon St | 44 | Road | Loss | -27 | -24 | P12 | 41.1 | 17.1 |
| 09-28-2013 | Alabama-Birmingham_CUSA | 24 | Vanderbilt | 52 | Road | Loss | -28 | -24.5 | SEC | 41.3 | 16.8 |
| 09-28-2013 | Purdue_B10 | 24 | Northern Illinois | 55 | Home | Loss | -31 | -29 | MAC | 45.5 | 16.5 |
| 09-28-2013 | UTEP_CUSA | 42 | Colorado St | 59 | Road | Loss | -17 | -14 | MWC | 29.5 | 15.5 |
| 09-28-2013 | Texas-San Antonio_CUSA | 28 | Houston | 59 | Home | Loss | -31 | -29 | AAC | 41.8 | 12.8 |
| 09-28-2013 | Connecticut_AAC | 12 | Buffalo | 41 | Road | Loss | -29 | -25 | MAC | 36.3 | 11.3 |
| 09-28-2013 | New Mexico St_IND | 16 | San Diego St | 26 | Home | Loss | -10 | -13 | MWC | 24.2 | 11.2 |
| 09-28-2013 | Southern Miss_CUSA | 7 | Boise St | 60 | Road | Loss | -53 | -37 | MWC | 45.4 | 8.4 |
| 09-28-2013 | Louisiana-Monroe_SUN | 14 | Tulane | 31 | Home | Loss | -17 | -20 | CUSA | 28.2 | 8.2 |
| 09-28-2013 | Central Michigan_MAC | 14 | North Carolina St | 48 | Road | Loss | -34 | -27.5 | ACC | 35.6 | 8.1 |
| 09-28-2013 | New Mexico_MWC | 42 | UNLV | 56 | Home | Loss | -14 | -17 | MWC | 24.3 | 7.3 |
| 09-28-2013 | Western Michigan_MAC | 14 | Kent St | 32 | Home | Loss | -18 | -21 | MAC | 26 | 5 |
| 09-28-2013 | Louisiana Tech_CUSA | 16 | Army | 35 | Neut | Loss | -19 | -19 | IND | 21.7 | 2.7 |