≡ Menu

All-Pro Voting: Comparing Barry Sanders and Emmitt Smith

Barry Sanders and Emmitt Smith are two of the greatest running backs in NFL history. They also happened to be contemporaries, which let NFL fans and analysts compare them year after year. Today, I want to review how the media viewed these two players.

Sanders entered the NFL a year before Smith, and was an instant success. As a rookie, Sanders and Christian Okoye were the  top running backs in the NFL, with Thurman Thomas, Neal Anderson, and Dalton Hilliard rounding out the top five.  Here was the voting by the Associated Press, Pro Football Writers Association, Sporting News, Newspaper Enterprise Association, Pro Football Weekly, and the UPI.  I have noted whether each award was a 1st-team All-Pro honor, a 1st-team All-Conference honor, or a 2nd-team All-Pro honor.

In 1990, Smith entered the league, and while he earned the AP Offensive Rookie of the Year award, he couldn’t compete for honors on a larger scale.  This was the start of a two-year period where the former Oklahoma State Cowboys, Sanders and Thomas, were the clear top two running backs in the NFL, with Anderson and Marion Butts also picking up some honors.

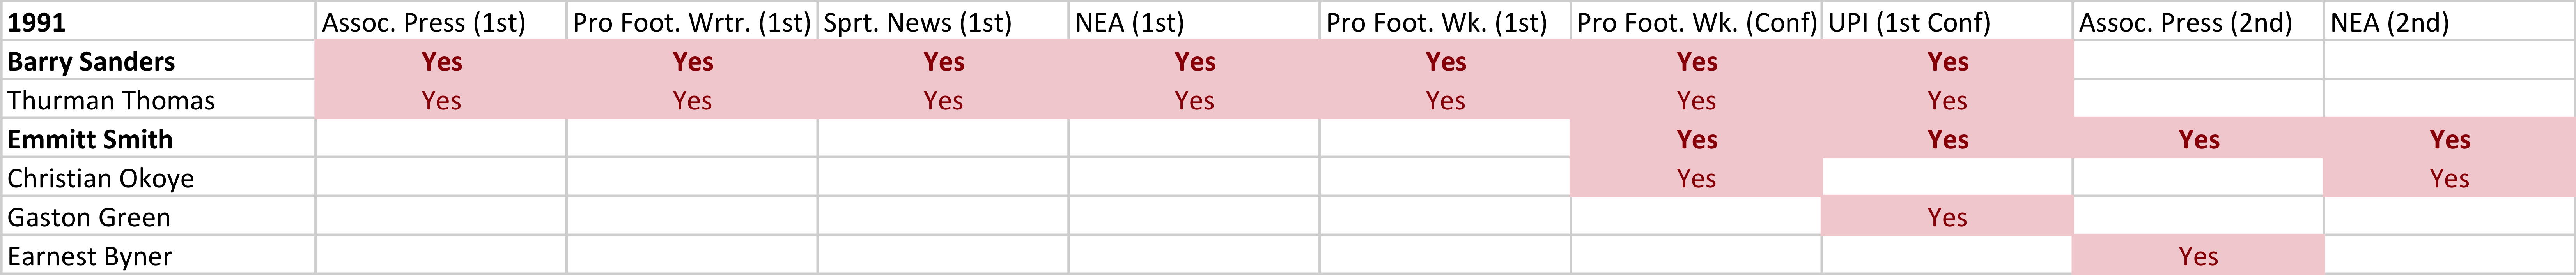
In 1991, Thurman Thomas was the MVP of the league according to the AP, PFWA, and the NEA, and he also picked up the AP Offensive Player of the Year award. Sanders, however, also won his first MVP this season, snagging the Bert Bell Award.  Smith started to get some honors, and was the media’s choice as the third best running back in the NFL this season.

In ’92,  Steve Young was outstanding and won most of the major MVP awards, but Smith earned his first MVP honors this season, being selected by the NEA as the best player in the NFL.  Barry Foster had a career season, and it was he — and not Sanders — who shared the first-team All-Pro awards.   Pro Football Weekly also made All-Conference choices this season.

The next season, 1993, Smith swept all the major awards, winning the AP, NEA, PFWA, and Bert Bell MVP honors.  Jerome Bettis (on the Rams) was probably the second-best RB this season, with Thomas the best running back in the AFC and fighting with Sanders for the title of third best running back in the NFL. [continue reading…]

{ 0 comments }

The Emmitt Smith Rant

Emmitt Smith was a product of the system, the one where they gave him the ball.

Emmitt Smith was a product of the system, the one where they gave him the ball.

One of Doug Drinen’s first posts at the old PFR Blog was titled, “The Emmitt Smith Rant.” That was now nine years ago, and while not much has changed regarding Smith’s career since 2006, how many people other than me still remember that old post? So I’ve decided to revive Doug’s old post, with his permission, of course.

With greatness comes backlash, and every great player has collected his share of detractors. And while Football Perspective readers don’t underrate him, it feels as though Emmitt Smith has been remembered by a significant number of football fans as a less-than-special running back.  He played with Hall of Famers at quarterback and wide receiver, with Pro Bowlers at fullback, tight end, and several spots on the offensive line. As a result, it’s understandable that some diminish the peak numbers he produced during his prime.

And yes, he did put up some monster numbers during his prime.  From 1991 to 1995, Smith was historically dominant. Consider that among all running backs during their ages 22 through 26 seasons (i.e., Smith from ’91 to ’95), he rushed for 8,019 yards; the next closest player during those ages was LaDainian Tomlinson with 7,361.  Smith also rushed for 85 touchdowns: Tomlinson (72) is the only other player within 20 rushing touchdowns of Smith during those ages.

But let’s say you don’t want to give Smith “full credit” for those years.  What about what he did from 1998 to 2001? During those years, Chan Gailey and Dave Campo coached the team for two seasons each. Dallas went 28-36 during those years, and the passing attack ranked 17th in Net Yards per Attempt. In other words, these weren’t the Troy Aikman/Michael Irvin Cowboys. And while Larry Allen was still around, the offensive line was more name than substance at this point.

At the start of this four-year period, Smith was 29 years old. Through age 28, Smith had recorded 2,595 carries in the regular season, [1]In addition to 318 more in the playoffs. the most of any player through age 28 in NFL history. So you’ve got a situation where a running back had been worn down to an absurd degree, stuck on a mediocre team and on a mediocre offense. If Smith was not a special back, how would he do? [continue reading…]

References

References
1 In addition to 318 more in the playoffs.
{ 21 comments }

Peyton Manning’s time in Indianapolis was peppered with record-breaking moments that have been very well-publicized. But a relatively unknown record occurred during the nascent days of the Manning Era. In 1999, Edgerrin James rushed for 1,553 yards, an impressive accomplishment in any era. But here’s what’s really crazy: Manning was second in the team in rushing yards with 73! Keith Elias was the only other running back to record a carry, and he finished with 28 yards (Marvin Harrison and Terrence Wilkins added six total rushing yards). This means James recorded 93.6% of all Indianapolis rushing yards that season, still an NFL record, and one that is in no danger of being broken in the near future.

Second on the list of “largest percentage of the rushing pie” is … Edgerrin James for the Colts the following season. In 2000, he was responsible for 91.9% of all Indianpolis rushing yards. Only three other players have ever gained 90% of all team rushing yards: Emmitt Smith, Barry Sanders, and … Travis Henry. The table below shows the top 100 seasons as far as percentage of team rushing yards: [continue reading…]

{ 16 comments }

When I went on the Advanced NFL Stats Podcast in late December, I discussed my use of Z-scores to measure the Seattle pass defense. Host Dave Collins asked me if I was planning on using Z-scores to measure other things, like say, Adrian Peterson’s 2012 season. I told him that would be an interesting idea to look at in the off-season.

Well, it’s the off-season. So here’s what I did.

1) For every season since 1932, I recorded the number of rushing yards for the leading rusher for each team in each league. So for the Minnesota Vikings in 2012, this was 2,097.

2) Next, I calculated the average number of rushing yards of the top rusher of each other team in the NFL. In 2012, the leading rusher on the other 31 teams averaged 974 yards.

3) Then, I calculated the standard deviation of the leading rushers for all teams in the NFL. In 2012, that was 386 yards.

4) Finally, I calculated the Z-score. This is simply the difference between the player’s average and the league average (for Peterson, that’s 1,123), divided by the standard deviation. Peterson’s Z-score was 2.91, good enough for 15th best since 1932. The table below shows the top 250 seasons using this method from 1932 to 2013; it’s fully searchable and sortable, and you can change the number of entries shown by using the dropdown box on the left. [continue reading…]

{ 7 comments }

Two house-keeping notes before we get to today’s post. First, today’s a pretty big day for our friend Neil Paine: he’s getting married. I’ll be there to celebrate with him in Philadelphia, but I know you guys will be with us in spirit. Congrats to Kaitlyn and Neil!

And another set of confetti must be reserve for the seven members of the Pro Football Hall of Fame Class of 2013: Larry Allen, Cris Carter, Jonathan Ogden, Warren Sapp, Curley Culp, Dave Robinson, and Bill Parcells. Tonight, those men will be inducted into the Hall of Fame, a must-see event for any football fan.

Today’s post focuses on one player already enshrined in Canton and one future Hall of Famer. As a general disclaimer, it’s best not to take too seriously what comes out of the mouths of football players, especially this time of year. That said, Adrian Peterson, part-cyborg, part-Minnesota Vikings running back, recently told Dan Wiederer of the Minneapolis Star Tribute that he thinks he will break Emmitt Smith’s career rushing record:

Q Forget about Eric Dickerson’s record for a minute. Last December, we talked about Emmitt Smith’s record and I told you you were on pace to get there in Week 4 of 2019. You said sooner and promised to come back with a timetable. Emmitt had 18,355 yards. You’re now 9,506 away. We need a week and a year. When do you get there?

A Man. Oh boy. I have to do some calculations. I’ve been in the league seven years. I’m already right around [9,000]. Calculate it out … Let’s think. Maybe get a couple 2,000 yard seasons … I’ve got … Hmmm … 2017.

Q What week in 2017?

A Man. I better go late. I’m already getting too far in front of myself. I’ll say Week 16. There it is. Week 16 in 2017. Whoo. That’s pushing it, huh? But hey, pushing it is the only way to do it. You know it.

Just to break it down for you in full, that gives Peterson 79 games to amass the 9,506 yards he needs to reach Smith. That comes out to a per-game average of 120.3 yards per contest with the assumption that Peterson avoids injury and doesn’t miss a game between now and Week 16 of 2017. Yes, it’s pushing it indeed. But good fun to consider, right?

Let’s talk reality. Peterson has rushed for 8,849 rushing yards in his six-year career, and was 27-years-old last year. The first problem for Peterson is that he was 937 yards behind Smith’s pace before Peterson even entered the league. That’s because Peterson, born in March, entered the league at 22, while Smith, born in May, entered at age 21. Unless you think we should compare the two by seasons and not age — and more on why that’s a bad idea later — we need to give Smith full credit for one extra year. In fact, here’s a chart comparing the two players in career rushing yards through age X. Smith also rushed for slightly more yards from ages 22 to 27 (9223-8849) than Peterson, but when you factor in his age 21 performance, Smith has a big lead on Peterson through age twenty-seven. You might recall I presented a similar chart when comparing Jason Witten to Tony Gonzalez and Jerry Rice.
[continue reading…]

{ 14 comments }

Franchises Nemeses: Rushing Stats

Yesterday, I looked at the players who threw for the most yards and touchdowns against each franchise. Today I will do the same but with rushing statistics.

But before going on, I’d urge you to take a few minutes and re-read this incredible document our founders signed 237 years ago. It’s great having a day off in the summer to barbecue and celebrate with family and friends, but it’s important to take a few moments and remember what this holiday really means. Like preventing this site from becoming Futbol Perspective.

Let’s again start with a bit of trivia. Do you know which player has rushed for the most yards against any one opponent?

Click Show for the Answer Show


What about the most rushing touchdowns?

Click Show for the Answer Show


Let’s take a look at the players who have rushed for the most yards against each franchise:
[continue reading…]

{ 3 comments }

Game Scripts, Part II: Analyzing team seasons

Yesterday, I rolled out Game Scripts, a way to measure the flow of every game since 1940. The sum of each team’s Game Script in each game can be used to give us an average Game Script score on the season. You might think that this number would be a good proxy for how dominant a team was, and that’s largely true: the teams with the highest game script scores tend to have been the most dominant teams. However, there are some reasons to be cautious with this approach: game scripts are not adjusted for strength of schedule and in any given game, the losing team can end up with a better score than the winning team. That said, here are the teams with the highest Game Scripts since 1940:

RkYearTeamLeagueW-L-TPFPASCRIPT
11942CHINFL11-0-03768413.5
21948CHINFL10-2-037515111.3
31941CHINFL10-1-039614710.4
41948SFOAAFC12-2-049524810.4
52007NWENFL16-0-058927410.3
61968BALNFL13-1-040214410.1
71948PHINFL9-2-137615610.1
81947CLEAAFC12-1-141018510
91946CLEAAFC12-2-042313710
101949PHINFL11-1-03641349.5
111969MINNFL12-2-03791339.4
121954CLENFL9-3-03361629.2
131999STLNFL13-3-05262429.1
141973MIANFL12-2-03431509.1
152001STLNFL14-2-05032738.9
161961HOUAFL10-3-15132428.8
171951CLENFL11-1-03311528.8
181972MIANFL14-0-03851718.7
191998MINNFL15-1-05562968.6
201973RAMNFL12-2-03881788.5
211983WASNFL14-2-05413328.4
221984SFONFL15-1-04752278.4
231948CLEAAFC14-0-03891908.3
241949SFOAAFC9-3-04162278.2
251998DENNFL14-2-05013098.1
261968DALNFL12-2-04311868
271966KANAFL11-2-14482767.9
281995SFONFL11-5-04572587.7
291962GNBNFL13-1-04151487.7
301953CLENFL11-1-03481627.6
311971DALNFL11-3-04062227.6
321944PHINFL7-1-22671317.6
331948CRDNFL11-1-03952267.6
341960CLENFL8-3-13622177.5
351980RAMNFL11-5-04242897.4
362010NWENFL14-2-05183137.4
372011GNBNFL15-1-05603597.4
381976BALNFL11-3-04172467.4
391975MINNFL12-2-03771807.3
401975PITNFL12-2-03731627.3
411992DALNFL13-3-04092437.3
421969KANAFL11-3-03591777.3
431964BALNFL12-2-04282257.2
441997DENNFL12-4-04722877.2
451968OAKAFL12-2-04532337.2
461945RAMNFL9-1-02441367
471943CHINFL8-1-13031577
481967OAKAFL13-1-04682337
491963NYGNFL11-3-04482807
501994SFONFL13-3-05052966.9

The teams with the highest game scripts last year? Green Bay (7.4), New Orleans (5.6) and Houston (5.4), while the Rams (-6.4), Colts (-7.2), and Bucs (-8.7) were at the bottom of the league. But let’s get to the real point of using Game Scripts — to help put passing and rushing ratios in context.

Last year, the Buccaneers had the second highest effective pass/run ratio in the league (defined as total pass attempts divided by rushes plus total pass attempts, but with all kneels and spikes excluded). But that’s misleading, because Tampa Bay had the worst Game Script in the league. Conversely, were Houston and San Francisco really the second and third most run-heavy teams in the NFL last year? The table below lists each team from highest to lowest pass/run ratio:
[continue reading…]

{ 7 comments }

Tomlinson pushed many teams to fantasy titles.

Bill Simmons wrote about LaDainian Tomlinson last month and called him the best fantasy football player of all-time. “Greatest ever” debates are always subjective, but at least when it comes to fantasy football, we can get pretty close to declaring a definitive answer. Joe Bryant’s landmark “Value Base Drafting” system explained that the “value of a player is determined not by the number of points he scores, but by how much he outscores his peers at his particular position.” Bryant came up with the concept of calculating a ‘VBD’ number for each player to measure their value.

A player’s VBD is easy to calculate. Each player’s VBD score is the difference between the amount of fantasy points he scored and the fantasy points scored by the worst starter (at his position) in your fantasy league. A player who scores fewer fantasy points than the worst starter has a VBD of 0. There is no standard scoring system for fantasy leagues, so a player’s fantasy points total will depend on the specific league’s scoring rules. [1]I’ve decided to use a blend of the most common scoring options: 1 point per 20 yards passing, 5 points per passing touchdown, -2 points per interception, 6 points for rushing/receiving … Continue reading And, of course, his VBD score will change depending on the number of starters at each position in the league. [2]Again, I’m using a blend here, but for baseline purposes I’m using QB12, RB24, WR32 and TE12, since the standard 12-team league starts 1 QB, 2 RBs, 2-3 WRs and 1 TE.

That said, once you pick a scoring system and a set of rules, it’s easy to calculate career VBD scores for every player since 1950 [3]I’ve pro-rated production for those players who were part of seasons when the NFL did not have a 16-game schedule; I also changed the baseline numbers depending on the number of teams in the … Continue reading. Let’s start with the quarterbacks:

PlayerYearsPOSTeamsVBDOVR RKPOS RK
Peyton Manning1998--2010QBclt107191
Brett Favre1992--2010QBatl-gnb-nyj-min1061102
Dan Marino1983--1999QBmia988143
Fran Tarkenton1961--1978QBmin-nyg921154
Steve Young1985--1999QBtam-sfo774245
Joe Montana1979--1994QBsfo-kan727336
Randall Cunningham1985--2001QBphi-min-dal-rav723357
Tom Brady2000--2011QBnwe720368
Drew Brees2001--2011QBsdg-nor688389
John Elway1983--1998QBden6604010
Roger Staubach1969--1979QBdal6304411
Johnny Unitas1956--1973QBclt-sdg6254712
Warren Moon1984--2000QBoti-min-sea-kan5925713
Ken Anderson1971--1986QBcin5397414
Sonny Jurgensen1957--1974QBphi-was5287715
Dan Fouts1973--1987QBsdg5267816
Daunte Culpepper1999--2009QBmin-mia-rai-det5158017
Aaron Rodgers2005--2011QBgnb5078318
Tobin Rote1950--1964QBgnb-det-sdg-den4948819
Roman Gabriel1962--1977QBram-phi40413020
Rich Gannon1988--2004QBmin-was-kan-rai39613521
Kurt Warner1998--2009QBram-nyg-crd39613622
Bobby Layne1950--1962QBchi-nyy-det-pit38514023
Y.A. Tittle1950--1964QBbcl-sfo-nyg38414124
Daryle Lamonica1963--1973QBbuf-rai36815325

[continue reading…]

References

References
1 I’ve decided to use a blend of the most common scoring options: 1 point per 20 yards passing, 5 points per passing touchdown, -2 points per interception, 6 points for rushing/receiving touchdowns, 1 point per 10 yards rushing/receiving, 0.5 points per reception.
2 Again, I’m using a blend here, but for baseline purposes I’m using QB12, RB24, WR32 and TE12, since the standard 12-team league starts 1 QB, 2 RBs, 2-3 WRs and 1 TE.
3 I’ve pro-rated production for those players who were part of seasons when the NFL did not have a 16-game schedule; I also changed the baseline numbers depending on the number of teams in the league, as a baseline of QB12 doesn’t make sense for 1950, when there were only 12 teams.
{ 15 comments }

A closer look at running back aging patterns

Frank Gore is 29 years old and has been the featured back of the 49ers since 2006. Steven Jackson turns the same age in three weeks, and has been beaten and bruised while playing on bad teams his whole career. Michael Turner had his 30th birthday in February, and has accumulated 300 carries in three of the last four years. Fred Jackson (31) and Willis McGahee (31 in October) have had varying degrees of wear and tear during their careers, and are both competing with younger backs on their roster.

We know the wheels will fall off for these players. But do we know when? And how severe the drop-off will be? Each running back is unique, with his own genetics, history, and supporting cast. It’s difficult to find true comparisons to any one running back, let alone a group of runners. Still, we can try to identify the general aging pattern of top tier running backs.

I looked at all running backs who entered the league in 1990 or later, rushed for at least 5,000 rushing yards, averaged at least 40 rushing yards per game for their careers, and are retired. There were 36 such running backs.

Now we need a metric to measure running back productivity. Generally, I don’t think people worry about running backs failing to be factors in the passing game as they age; Kevin Faulk set a career high in receiving yards at age 32. I don’t think the focus is on touchdown production, either, and we all remember Jerome Bettis still being a short-yardage force even when he was well past his prime. No, when people discuss running backs hitting a wall and deteriorating, the focus is on declining rushing yards and rushing yards per carry. One metric I’ve used before is called “Rushing Yards Over 2.0 Yards Per Carry” or RYO2.0, for short. As the name implies, a running back gets credit for his yards gained over 2.0 yards per carry, so 300 carries for 1000 yards is worth 400 marginal yards, as is 1,060 yards on 330 carries. Essentially, we’re looking at just rushing yards with a small adjustment depending on the player’s yards per carry average.

I calculated the RYO2.0 for each of the 36 running backs at ages 22 through 34. The red line represents the average RYO2.0 for the group at each age for all 36 backs; the green line represents the average RYO2.0 only for those backs who were active in the league at that age.

Running Back production by age


[continue reading…]

{ 9 comments }