
In 1999 and 2000, no team in NFL history relied on one running back quite like the Indianapolis Colts. During those two seasons, Edgerrin James was responsible for 98% of all carries given to Colts running backs, 99% of all rushing yards from Indianapolis running backs, and 98% of all yards from scrimmage and 97% of all touchdowns scored by Colts running backs. The table below shows the stats from the nine running backs to play for the Colts during these two seasons: [continue reading…]
Barry Sanders and Emmitt Smith are two of the greatest running backs in NFL history. They also happened to be contemporaries, which let NFL fans and analysts compare them year after year. Today, I want to review how the media viewed these two players.
Sanders entered the NFL a year before Smith, and was an instant success. As a rookie, Sanders and Christian Okoye were the top running backs in the NFL, with Thurman Thomas, Neal Anderson, and Dalton Hilliard rounding out the top five. Here was the voting by the Associated Press, Pro Football Writers Association, Sporting News, Newspaper Enterprise Association, Pro Football Weekly, and the UPI. I have noted whether each award was a 1st-team All-Pro honor, a 1st-team All-Conference honor, or a 2nd-team All-Pro honor.
 In 1990, Smith entered the league, and while he earned the AP Offensive Rookie of the Year award, he couldn’t compete for honors on a larger scale. This was the start of a two-year period where the former Oklahoma State Cowboys, Sanders and Thomas, were the clear top two running backs in the NFL, with Anderson and Marion Butts also picking up some honors.

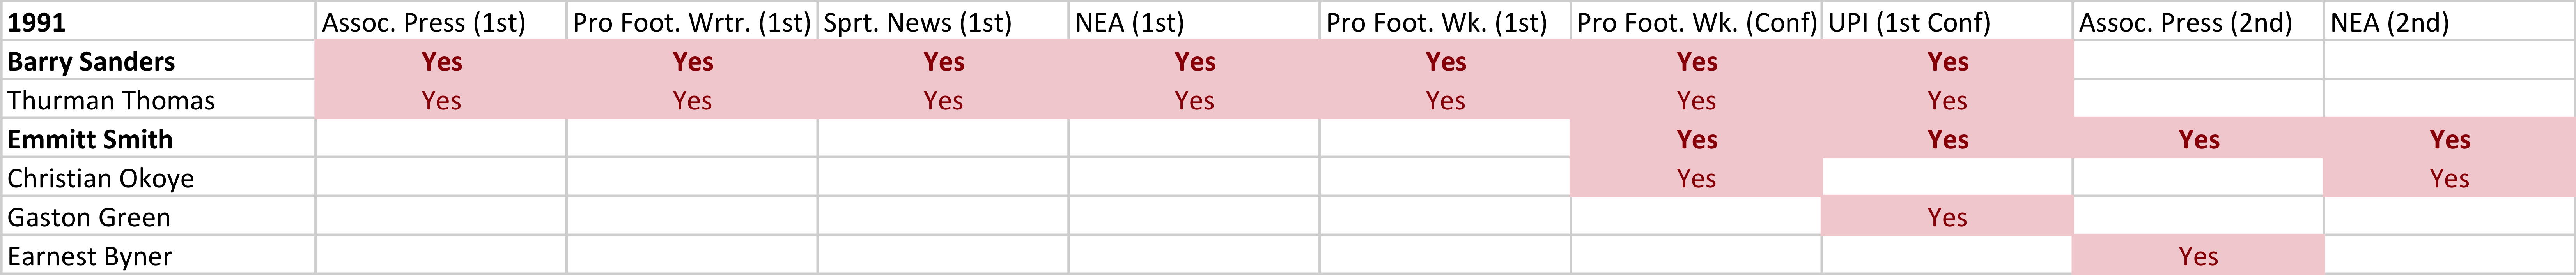
In 1991, Thurman Thomas was the MVP of the league according to the AP, PFWA, and the NEA, and he also picked up the AP Offensive Player of the Year award. Sanders, however, also won his first MVP this season, snagging the Bert Bell Award. Smith started to get some honors, and was the media’s choice as the third best running back in the NFL this season.
 In ’92, Steve Young was outstanding and won most of the major MVP awards, but Smith earned his first MVP honors this season, being selected by the NEA as the best player in the NFL. Barry Foster had a career season, and it was he — and not Sanders — who shared the first-team All-Pro awards. Pro Football Weekly also made All-Conference choices this season.

The next season, 1993, Smith swept all the major awards, winning the AP, NEA, PFWA, and Bert Bell MVP honors. Jerome Bettis (on the Rams) was probably the second-best RB this season, with Thomas the best running back in the AFC and fighting with Sanders for the title of third best running back in the NFL. [continue reading…]
On Thursday, I looked at a measure of passing efficiency and gray ink: where a first place finish rewards a player with 10 points, a second-place finish 9 points, a third-place finish 8 points, and so on. Today, I’m going to do the same thing but with rushing yards, so a rushing crown is worth 10 points, a runner-up title is worth 9 points, and so on. You can read a few twists in this footnote. [1]I want to give more credit to seasons where there were more teams. So when Kareem Hunt led the 32-team NFL last season, that was worth 10 points. What about when Pug Manders led the 9-team NFL in … Continue reading
Let’s use Barry Sanders as an example. In four seasons, he led the NFL in rushing (+40 points), and in three other seasons, he was the runner up (+27 points). He also had two seasons where he ranked 4th in rushing yards (+14) and one season where he ranked 5th (+6), for a total of 87 points. Using the pro-rated method explained in the footnote, since there were fewer than 32 teams during his career, Sanders actually gets credit for 82.7 points. That is still the most of any player in history: [continue reading…]
References
| ↑1 | I want to give more credit to seasons where there were more teams. So when Kareem Hunt led the 32-team NFL last season, that was worth 10 points. What about when Pug Manders led the 9-team NFL in 1941? That feels less meaningful, and that is especially true when comparing a 9th-place finish in 2017 to a 9th-place finish in 1941. One option is to take the number of points — say, 10 — and divided it (32/X), with X being the number of teams in the league. So if there are 9 teams, you would take 10 and divide it by 3.55, and get 2.8 points. That feels too extreme to me: it would make a first-place finish in a 9-team league less valuable than an 8th-place finish in a 32-team league. So do I use 10 points or 2.8 points… or do I split the baby? Well, that’s what I did: I averaged those two numbers to get 6.4 points, equal to a 4th- or 5th-place finish today. I was comfortable with that result, but your mileage may vary.
Other thoughts: I combined all AFL and AAFC seasons. Probably not ideal, but it was the quickest/simplest thing to do. |
|---|
In 2008, Jamaal Charles had 67 carries and averaged 5.33 yards per carry. Those 67 carries represent 5% of Charles’ career attempts to date (excluding playoffs). That season, the NFL league average was 4.20 yards per carry, which means Charles was 1.12 (after rounding) YPC above average in 2008, or 1.12 YPC above average on 5% of his career carries.
In ’09, Charles had 190 carries, representing 15% of his career YPC. He averaged 5.89 YPC, and the league average was 4.24, which means Charles was 1.65 YPC above average for 15% of his career carries.
In 2010, those numbers were 230, 18%, 6.38, and 4.21, so Charles was 2.17 YPC above league average on 18% of his career carries.
I performed that analysis for every season of Charles’ career — and every other player in NFL history — to determine each player’s career YPC average relative to league average. The table below shows the 200 running backs (by default, only the top 10 are shown) in pro football history with the most carries. The table is sorted by YPC over league average. Here’s how to read it. Jamaal Charles ranks 1st in YPC over league average. His first year was 2008 and his last year (so far) was 2014. For his career, Charles has 1,249 career rush attempts, which ranks 118th in pro football history. He has 6,856 yards, giving him a 5.49 career YPC average. His “expected” career yards per carry average — based on the league average YPC in each season of his career, weighted by his number of carries — is 4.21. Therefore, Charles has averaged 1.28 YPC above league average for his career, the highest rate in football history. [continue reading…]
Peyton Manning’s time in Indianapolis was peppered with record-breaking moments that have been very well-publicized. But a relatively unknown record occurred during the nascent days of the Manning Era. In 1999, Edgerrin James rushed for 1,553 yards, an impressive accomplishment in any era. But here’s what’s really crazy: Manning was second in the team in rushing yards with 73! Keith Elias was the only other running back to record a carry, and he finished with 28 yards (Marvin Harrison and Terrence Wilkins added six total rushing yards). This means James recorded 93.6% of all Indianapolis rushing yards that season, still an NFL record, and one that is in no danger of being broken in the near future.
Second on the list of “largest percentage of the rushing pie” is … Edgerrin James for the Colts the following season. In 2000, he was responsible for 91.9% of all Indianpolis rushing yards. Only three other players have ever gained 90% of all team rushing yards: Emmitt Smith, Barry Sanders, and … Travis Henry. The table below shows the top 100 seasons as far as percentage of team rushing yards: [continue reading…]
When I went on the Advanced NFL Stats Podcast in late December, I discussed my use of Z-scores to measure the Seattle pass defense. Host Dave Collins asked me if I was planning on using Z-scores to measure other things, like say, Adrian Peterson’s 2012 season. I told him that would be an interesting idea to look at in the off-season.
Well, it’s the off-season. So here’s what I did.
1) For every season since 1932, I recorded the number of rushing yards for the leading rusher for each team in each league. So for the Minnesota Vikings in 2012, this was 2,097.
2) Next, I calculated the average number of rushing yards of the top rusher of each other team in the NFL. In 2012, the leading rusher on the other 31 teams averaged 974 yards.
3) Then, I calculated the standard deviation of the leading rushers for all teams in the NFL. In 2012, that was 386 yards.
4) Finally, I calculated the Z-score. This is simply the difference between the player’s average and the league average (for Peterson, that’s 1,123), divided by the standard deviation. Peterson’s Z-score was 2.91, good enough for 15th best since 1932. The table below shows the top 250 seasons using this method from 1932 to 2013; it’s fully searchable and sortable, and you can change the number of entries shown by using the dropdown box on the left. [continue reading…]
Yesterday, I looked at the players who threw for the most yards and touchdowns against each franchise. Today I will do the same but with rushing statistics.
But before going on, I’d urge you to take a few minutes and re-read this incredible document our founders signed 237 years ago. It’s great having a day off in the summer to barbecue and celebrate with family and friends, but it’s important to take a few moments and remember what this holiday really means. Like preventing this site from becoming Futbol Perspective.
Let’s again start with a bit of trivia. Do you know which player has rushed for the most yards against any one opponent?
| Click Show for the Answer | Show |
|---|---|
What about the most rushing touchdowns?
| Click Show for the Answer | Show |
|---|---|
Let’s take a look at the players who have rushed for the most yards against each franchise:
[continue reading…]

www.notacompiler.com.
I’m going to do something similar for running backs, but instead will focus on individual game performances. I have game logs for every running back (post-season included) for every game since 1960. What I did was zero out all rushing yards in games where a player had 50 or fewer rushing yards; in the remaining games, I only gave those runners credit for the rushing yards they gained after their first 50 rushing yards. The “RYov50” column shows the running back’s career rushing yards after removing the first 50 rushing yards he had in every game; the next column shows each player’s career rushing yards (since 1960, including post-season), and the first “Perc%” column shows the ratio of the “RYov50” column to the career rushing yards. A higher percentage means the player spent most of his time as the lead back for his team, while a lower percentage indicates that the player spent significant time in a committee and/or stuck around for several years past his prime. Obviously for still active players, the percentage column could be misleading as they may not have entered the decline portion of their careers just yet.
The #50YG column shows how many games the player had over 50 rushing yards, and the next column shows what percentage of games the running back gained over 50 yards. For players like Jim Brown, this study only includes his seasons starting in 1960, and for active players, 2012 data is *not* included:
[continue reading…]