≡ Menu

Leonard Fournette and Yards per Carry

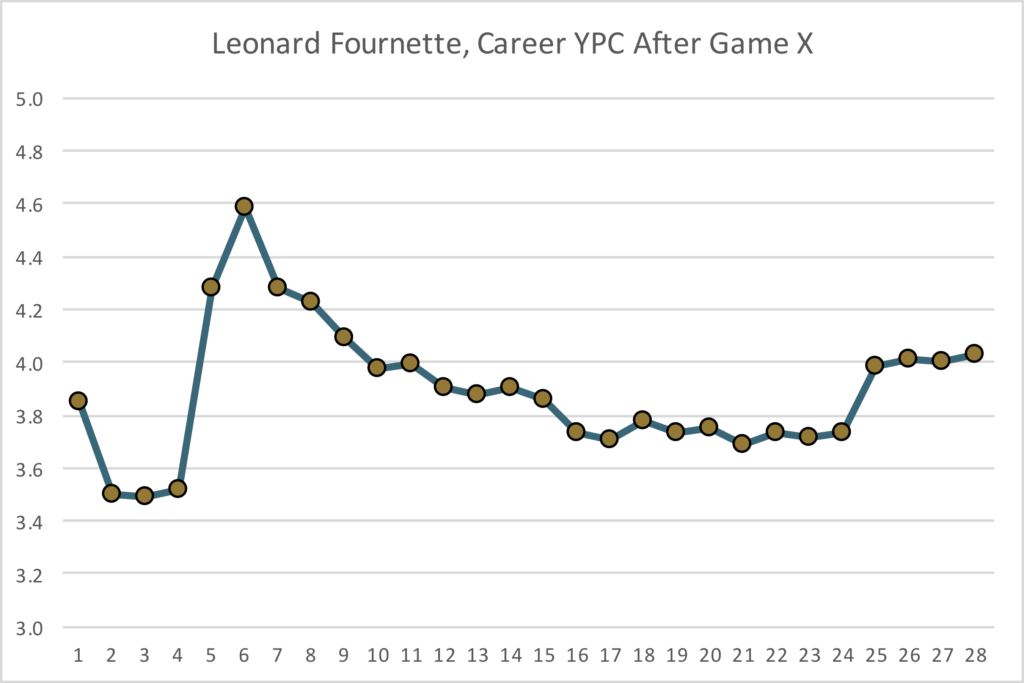
Leonard Fournette is averaging 5.0 yards per carry this season, a year after producing an anemic 3.3 average in 2018. After Fournette’s latest performance against the Bengals, his career average gain has once again bounced north of four yards. This prompted our friend Adam Harstad to note on Twitter that all those who were down Fournette because of his low yards per carry average could now rest easy since his YPC is once again above 4.0.

The graph below shows Fournette’s career yards per carry average after every game of his 28-game career.

[continue reading…]

{ 0 comments }

How Sticky Is Yards per Carry From Year To Year?

In 2015, Thomas Rawls averaged 5.65 yards per carry, best in the NFL. The next year, Rawls averaged just 3.20 YPC, the second-worst rate in the league. That’s an extreme case (actually, the most extreme case), but it does represent the general idea that yards per carry is simply not very sticky from year to year.

In the graph below, I have shown all running backs who had at least 100 carries in back to back years since 1970. The X-Axis shows the YPC each player had in Year N, and the Y-Axis shows the YPC that player had the following year, Year N+1. The R^2 shows the correlation between those two numbers. The best-fit formula to predict Year N+1 Yards per Carry from Year N Yards per Carry is 3.05 + 0.28 * Year N YPC. The R^2, of course, is the square of that 0.28 coefficient. Take a look at this graph:

What if we raise the minimums to 150 carries both years? [continue reading…]

{ 0 comments }

Aaron Jones led the NFL (much to my dismay) in yards per carry in 2018, averaging 5.48 yards per carry courtesy of 729 yards on 133 carries. But there are many problems with focusing too much on a simple metric like yards per carry, which doesn’t tell you very much.

Every year, I like to conduct a study on all running backs who had above average YPC averages and then figure out how many carries we would need to remove to drop his YPC to below average. Why do I like to do this? Because it’s the offseason, and why not! But also because it helps to highlight and remind us how sensitive YPC is to outlier runs.

When I looked at the top running backs in the NFL last year, as a group, they rushed 8,153 times for 35,989 yards, a 4.41 YPC average. So for all running backs who had an above-average YPC number last year, how many carries would we have to remove to get them below 4.41?

Jones had a 67-yard run last year; take that away, and his YPC drops to 5.02. Remove his next 3 best runs — 33, 30, and 29 yards — and his YPC drops to 4.42. You need to take away his 5th best carry, an 18-yard rush, to drop his YPC to 4.31. So for Jones, the answer is 5 carries is how many you need to take away to get his YPC to below the threshold.

You might think, hey, this is biased against running backs with a low number of carries! Well, that’s the point! We should be skeptical of placing too much emphasis on a player’s YPC average if that running back doesn’t have a lot of carries. The “leader” in this statistic is actually a two-way tie between Todd Gurley and Gus Edwards. For Gurley, you need to take away his top 6 runs — which were only 36, 29, 26, 24, 24, and 23 yards — to get his YPC down to 4.36. This serves as a good way of noting that Gurley actually had a “down” year when it comes to YPC: he was only a couple of long runs away from an even more dominant season. Edwards had only 127 carries, but he also didn’t have many big runs: even if you take away his best 5 runs, his YPC would drop to 4.45; you need to remove his 6th best carry to get him to 4.34.

The graph below shows the results for each player who had an above-average YPC last year. The first four columns should be self-explanatory. The “TakeAway” column shows how many carries you need to take away to get that player’s YPC to below 4.41. Note that for Barkley, McCaffrey, and Chubb — despite each topping 5.0 YPC — that answer is only 3! And for Chubb and Barkley, removing their best 5 runs brings both players to a sub-4.00 YPC average. The next 10 columns show the 10 longest runs that player had. Then, the final 10 columns show that player’s YPC average once you remove each of his best X carries. [continue reading…]

{ 0 comments }

Rushing yards per carry continues to rise: a month ago, I noted that the league-wide yards per carry average was 4.34. If that held, it would set a new record, breaking the 4.29 mark set in 2011.

Since then, rushing efficiency has soared: since week 9, the Panthers are averaging over 6 yards per carry, 9 more teams are averaging over 5 yards per carry, and a total of 23 teams are averaging 4.29 YPC or better. The great rushing performance of the last month (4.61 YPC) has raised the 2018 league average mark to an incredible 4.44 yards per carry.

And yet, rushing quantity has never been lower. For the season, teams are rushing just 25.7 times per game, and even since week 9, that level is just 26.0 rushing attempts per game. This will go down as the season with the fewest rushing attempts in history, and also the season with the highest yards per carry average in history. The common theme here is passing: teams are passing more than ever, and defenses don’t seem very concerned about stopping the run. Offenses want to pass, and defenses are more than happy to allow teams to run (including via non-running back runs). That’s how you get crazy results like this.

And how crazy are these results? Well, take a look at the graph below, which shows every NFL season since 1932.  Each year is on the X-Axis, and there are two Y-Axes: the left Y-Axis shows yards per carry, and the right Y-Axis shows rushing attempts per game.  The NFL average yards per carry is shown in blue dots against that left Y-Axis, and the NFL rushing attempts per game is shown in red diamonds against the right Y-Axis.

{ 0 comments }

Rushing Efficiency Has Soared, With A Twist

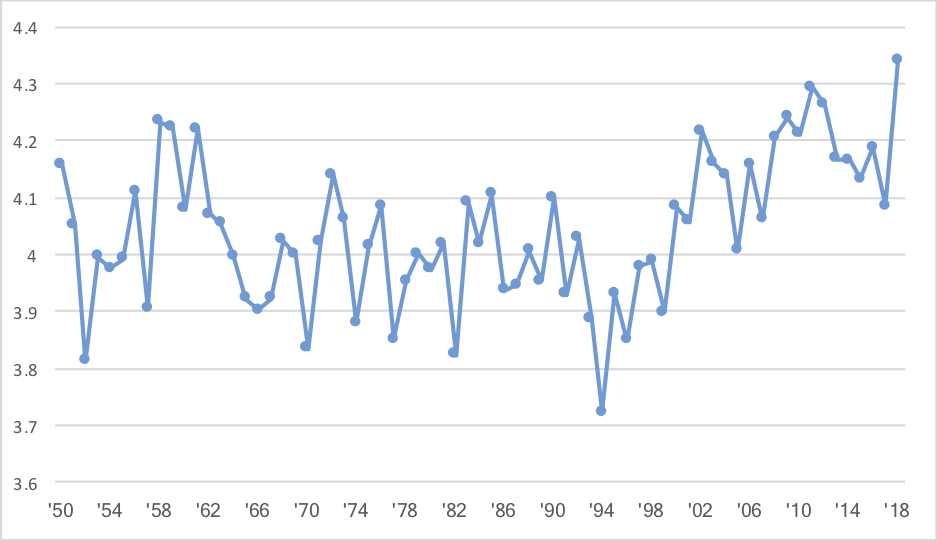
This season, the average carry in the NFL has gained 4.34 yards. That would set a new record, and it would also represent a large 0.25 YPC increase over last season’s average. The graph shows the YPC average in every NFL season since 1950:

[continue reading…]

{ 1 comment }

Regular readers know that I am not a big fan of yards per carry to measure a running game, on either the team or the individual level. That also goes for team defense. If you look at this year’s standings, though, and compare a team’s record to its yards per carry allowed, you will in fact notice a correlation.

And a moderately strong one at that. The correlation coefficient between a team’s winning percentage in 2017 and that team’s yards per carry allowed is 0.37. That indicates a positive correlation between the two stats, but… well, there isn’t supposed to be a positive correlation. This means that allowing more yards per rush is correlated with winning more games. See for yourself: [continue reading…]

{ 15 comments }

Two years ago, I wrote this post titled “Take Away His X Best Carries and He’s Average.” The idea was simple: Suppose you sort each running back’s carries in descending order by yards gained. How many carries would we need to take away from him to drop his production to at or below average?

Browns running back Isaiah Crowell ranked 9th in yards per carry last year, with an impressive 4.81 average gain. But that number may be a bit misleading, to the extent it made you think that Crowell was consistently churning out big gains. Crowell was responsible for the longest run of the season last year, an 85-yard run in week 2 against the Ravens. And, for what it’s worth, it was one of the easiest long runs you’ll ever see:

In the last game of the year, Crowell had a more impressive 67-yard run against the Steelers. But here’s the thing: outside of those two runs, Crowell averaged just 4.08 yards per carry on his other 196 carries.

There were 42 running backs last year who had at least 100 rush attempts; those players averaged 4.19 yards per carry last year. So if you remove Crowell’s two best carries, he falls below that average.

An impressive Powell movement

On the other hand, Steelers running back Le’Veon Bell averaged 4.86 yards per carry last year, and his six best runs went for 44, 38, 33, 26, 25, and 24 yards. Remove those, and Bell still averaged 4.23 yards per carry, which means you need to remove his seven best runs to drop him below average.

Jets running back Bilal Powell was the star of this metric.  He averaged 5.51 yards per carry last year, but he was a consistent producer of big gains.  He had 12 runs of 13+ yards, and you need to remove all 12 to bring Powell below average.  Remove those 12 carries and his average finally dips to 4.16 yards per carry.

Below are the 19 running backs to exceed that 4.19 yards per carry average last year, and the fewest number of carries you would need to remove to bring their production below average: [continue reading…]

{ 15 comments }

Yards per Carry: RB1 vs. RB2

Regular readers know that I’m not a huge fan of yards per carry as a metric to evaluate running backs, or even rushing attacks. Given the limited numbers of metrics available, sometimes it is a useful measure, but we also much caution ourselves against relying on it too often. Today’s post is another example of that.

I looked at all rushing attacks since 2002, and calculated the yards per carry gained by each team’s top running back and second running back (excluding pure fullbacks and situations where the second running back had fewer than 50 carries), as measured by carries. If yards per carry was the best way to evaluate running backs, and coaches wanted to play their best players most frequently (and, of course, coaches were able to identify their best players), then RB1s should be better at RB2s at yards per carry.

Last year, Bears rookie Jordan Howard averaged 5.2 yards per carry on 252 carries, while backup Jeremy Langford (who actually opened the season as the starter) gained just 3.2 yards per carry on 62 carries.  That’s a piece of evidence that YPC is useful: Howard was much better than Langford at YPC, and he gained way more carries.  But that +2.0 discrepancy was the largest in football last year: this is an outlier, not a typical example.

How about an outlier in the other direction? The Jets top running back last year was Matt Forte, who started 13 games and handled 218 carries; he averaged 3.7 yards per rush. Meanwhile, backup Bilal Powell averaged 5.5 yards per carry on 131 carries.  This might mean that Powell is better than Forte, but at least last year, the Jets didn’t seem to think so — or maybe thought so too late.

These are two interesting examples because they show some of the drawbacks to actually trying to properly analyze the issue.  Howard was the backup, but because he was so much better than Langford, he gets graded as Chicago’s top running back.  This biases the study in favor of RB1s: if a running back is producing at a high rate, even if he’s the backup, he may wind up leading his team in rushes that year (thanks to earning more carries in the second half of the season), which means RB1s in generally will appear to have higher yards per carry than RB2s.  In that way, it becomes a self-fulfilling prophecy.

On the other hand, look at the Jets example.  I think we would all agree that Powell was the Jets best running back last season. He actually finished with more yards from scrimmage than Forte (thanks to playing in two more games), and nearly outrushed him, too. Forte was the (moderately) high priced veteran free agent signing, while Powell was intended to be the backup. By the end of the year, it was clear Powell was the Jets best running back (if not best player), but he didn’t have enough carries to overtake Forte for RB1 status. So in some ways, this study may not properly identify a team’s true top running back and backup running back, if we only classify those players by carries.

So there is some issues with this on a case-by-case basis.  That’s why the best thing to do is to aggregate the data.  The graph below shows the average yards per rush gained by the average team’s RB1 and average team’s RB2 in each year since 2002: [continue reading…]

{ 15 comments }

The most efficient runner in NFL history? That depends.

Jamaal Charles is now a Denver Bronco, making him the second superstar running back in two weeks to join a new team at the tail end of his career. In his prime, Charles was a very good receiver and a player that could be the centerpiece of an offense. However, he will likely be remembered for a singular skill: rushing efficiency.

Charles has a career YPC average of 5.45, easily the best in history among running backs in the NFL. That number is at least a little misleading. While rushing efficiency has not soared the way passing efficiency has, we are currently in a high-YPC environment. Two years ago, I calculated era-adjusted yards per carry: at the time, Charles was at 5.49, while the league average was 4.21. For reference, the league average during the careers of Jim Brown, Gale Sayers, and Barry Sanders was 4.08, 3.95, and 3.93, respectively.

I am not a big fan of yards per carry as a statistic, but hey, it’s still interesting trivia. It’s a little silly and mostly an academic exercise, but let’s pretend that we replaced every Charles rush attempt with a league average rush attempt. How much worse off would Kansas City have been? Well, a whole lot. Let’s use his 2010 season as an example. He had 230 carries for 1,467 yards, producing an incredible 6.38 YPC average. The league average that season was 4.21, meaning he was 2.17 YPC above-average. Given his 230 carries, we would have expected him to rush for just 968 yards, meaning he produced 499 rushing yards above average. And for his career? Charles is at +1657. [continue reading…]

{ 8 comments }

I appeared on Chris Harris’s podcast today, talking yards per carry and game scripts. You can listen to it here.

{ 0 comments }

In 2008, Jamaal Charles had 67 carries and averaged 5.33 yards per carry. Those 67 carries represent 5% of Charles’ career attempts to date (excluding playoffs). That season, the NFL league average was 4.20 yards per carry, which means Charles was 1.12 (after rounding) YPC above average in 2008, or 1.12 YPC above average on 5% of his career carries.

In ’09, Charles had 190 carries, representing 15% of his career YPC. He averaged 5.89 YPC, and the league average was 4.24, which means Charles was 1.65 YPC above average for 15% of his career carries.

In 2010, those numbers were 230, 18%, 6.38, and 4.21, so Charles was 2.17 YPC above league average on 18% of his career carries.

I performed that analysis for every season of Charles’ career — and every other player in NFL history — to determine each player’s career YPC average relative to league average. The table below shows the 200 running backs (by default, only the top 10 are shown) in pro football history with the most carries. The table is sorted by YPC over league average. Here’s how to read it. Jamaal Charles ranks 1st in YPC over league average. His first year was 2008 and his last year (so far) was 2014. For his career, Charles has 1,249 career rush attempts, which ranks 118th in pro football history. He has 6,856 yards, giving him a 5.49 career YPC average. His “expected” career yards per carry average — based on the league average YPC in each season of his career, weighted by his number of carries — is 4.21. Therefore, Charles has averaged 1.28 YPC above league average for his career, the highest rate in football history. [continue reading…]

{ 30 comments }

On Friday, I asked the question: how many carries would we need to take away from DeMarco Murray in order to drop his YPC average to at or below league average?

Today, I want to look at it from the other side. How many of Trent Richardson’s worst carries would we need to erase to bring his YPC above league average? For this experiment, assume that we are sorting each running back’s carries in ascending order by yards gained. I’ll give you a moment to think about the answer.

[Final Jeopardy Music]

[Keep thinking…]

[Are you ready?]

[Your time is now up. Post your answer in the comments!] [continue reading…]

{ 12 comments }

DeMarco, how many Cowboys fans still think you're great?

DeMarco, how many Cowboys fans still think you’re great?

DeMarco Murray was really, really good last year. He rushed 393 times for 1,845 yards, producing a strong 4.69 YPC average. Jamaal Charles was also really, really good — he averaged 5.07 yards per rush last year, albeit on “only” 205 carries. The NFL average yards gained per rush was 4.16 last season, down a tick from in previous years. But that brings us to the question of the day:

Suppose we sort each running back’s carries in descending order by yards gained. How many carries would we need to take away from Murray in order to drop his YPC average to at or below league average? Same question for Charles. I’ll give you a moment to think about this one.

[Final Jeopardy Music]

[Keep thinking…]

[Are you ready?]

[Your time is now up. Post your answer in the comments!]
[continue reading…]

{ 50 comments }
Bettis ran for only five yards on this play

Bettis ran for only five yards on this play

Congrats to the newest members of the Pro Football Hall of Fame. You can read my thoughts on the candidates here; while this class is not exactly the one I would have picked, Jerome Bettis, Tim Brown, Charles Haley, Junior Seau, Will Shields, and Mick Tingelhoff were all outstanding players. In addition, Bill Polian and Ron Wolf were the inaugural selections for the Contributors spots, so congratulations to them as well.

The Bettis candidacy is an interesting one. Many want to focus on his underwhelming 3.9 career yards per carry average. But as I have written many times, I am not keen on putting much weight on YPC as a statistic. Brian Burke has also written about how coaches don’t view running backs in terms of yards per carry, but rather by success rate (which correlates poorly with yards per carry). Danny Tuccitto calls yards per carry essentially “a bunkum stat.” [continue reading…]

{ 17 comments }

Checkdowns: YPC Differential Leaders

Wilson's rushing prowess has powered Seattle this year

Wilson's rushing prowess has powered Seattle this year

[End of Year update: Seattle finished the season with 2,762 rushing yards on 525 carries, good enough for a 5.26 YPC average. The Seahawks allowed just 1,304 yards on 380 carries, which translates to a 3.43 YPC average. Therefore, the 2014 Seahawks averaged 1.83 more yards per carry than they allowed; that’s the second best differential since the merger, and just a behind the ’63 Browns for the third best since 1950.]

Last season, the Seahawks posted the best ANY/A differential in the NFL. In fact, it was the 9th best ANY/A differential of any team since the merger, and Seattle wound up becoming the 5th team in the top ten in that statistic to win the Super Bowl.

You heard all about Richard Sherman and Earl Thomas and the great Seahawks pass defense, and it’s not as though Russell Wilson was flying under the radar, either. But this year, the Seahawks are recording even more extreme statistics in a different differential stat.

Yards per carry is super overrated: Danny Tuccitto did a nice job revealing that just a couple of days ago. But hey, I love trivia, so let’s move on.

Seattle ranks 1st in the NFL in yards per carry (5.08). Marshawn Lynch is at 4.2 YPC on 132 carries, but it’s Wilson’s 7.6 yards per carry average on 52 carries that sets the Seahawks apart. But the defense — so unstoppable against the pass in 2013 — ranks 1st in this metric, too. Seattle is allowing just 3.19 yards per carry this year; if it holds, that would be the best mark since the 2010 Steelers.

Combine, though, is where the Seahawks really stand out. Seattle has a 1.89 YPC differential, defined as YPC for the offense minus YPC allowed for the defense. How good is that? If it holds, it would be the 2nd best mark since 1950: [continue reading…]

{ 3 comments }

Thoughts on Running Back Yards per Carry

The man in odd-numbered games

The man in odd-numbered games.

Regular readers know that I’m skeptical of using “yards per carry” to evaluate running backs. That’s because YPC is not very consistent from year to year. But it’s also not consistent even within the same year. For example, In 2013, Giovani Bernard rushed 92 times for 291 yards in even-numbered games last year, producing a weak 3.16 YPC average. But in odd-numbered games, Bernard averaged 5.18 YPC, rushing 78 times for 404 yards!

Jamaal Charles also showed a preference for odd-numbered games, averaging 5.80 YPC in games 1, 3, 5, etc., and only 3.96 YPC in even-numbered games. Buffalo’s C.J. Spiller had a reverse split, producing 5.57 YPC in even games and 3.61 YPC in odd games.

Okay, this stuff is meaningless, you say. Who cares about these random splits? Well, there are a couple of reasons to care. For starters, these splits serve as a great reminder that splits happen. If Spiller averaged 3.61 YPC in the first half of the year and 5.57 in the second half, the narrative would be that Spiller was finally healthy by the end of the year, and was set up for a monster 2014 campaign. Meanwhile, if Charles had seen his YPC fall from 5.8 YPC in the first eight games to 3.96 in the back eight, the narrative would be that he couldn’t handle a heavy workload, was breaking down, and could be a huge bust this year. Narratives are easy to invent, and remembering that “splits happen” is an important part of any analysis. [continue reading…]

{ 26 comments }

2014 Running Back Free Agent Market

The free agent running back market has been as peculiar as it’s been quiet. There have been no big contracts doled out and only a few sizable ones of note, although some of the ensuing narrative about the demise of the running back position has been overblown. Today I want to look at the ten biggest free running back signings [1]Excluding Joique Bell, who was a restricted free agent. of 2014 and see what conclusions we can draw.

Player contracts are notoriously complicated to analyze; I won’t pretend that we can truly and fully measure contracts handed out by ten different teams. But I won’t let the perfect be the enemy of the great: armed with the understanding that this analysis is not perfect, we march onwards. Over The Cap publishes detailed salary cap information, including the total value of the contract, the average per year, the amount of guaranteed money (which is never as clear as it sounds), the guaranteed money per year, the percent guaranteed, and the number of years.  I’ve added one additional column: the approximate value of the contract in the first two years, which in itself is pretty tricky to calculate. [2]For players on one-year contracts, I averaged the guaranteed amount and the total amount, and multiplied that average by two. For players on two-year contracts, I averaged the guaranteed amount and … Continue reading It’s not close to perfect, but no method is, and I thought this was a better metric by which to sort the table than any other. Take a look: [continue reading…]

References

References
1 Excluding Joique Bell, who was a restricted free agent.
2 For players on one-year contracts, I averaged the guaranteed amount and the total amount, and multiplied that average by two. For players on two-year contracts, I averaged the guaranteed amount and total amount. For players on three- or four-year contracts, I treated the first two years as fully guaranteed and ignored the remainder.
{ 3 comments }

Ellington races for a long touchdown

Ellington races for a long touchdown.

Arizona is one of many teams in the NFL employing a running back by committee philosophy, but no team — now, or at any point in modern history — allocated time quite like the Cardinals. Through nine weeks, Rashard Mendenhall has 105 rushes for 323 yards, giving him a miniscule 3.1 yards per carry average. Mendenhall arrived in the desert this offseason, as part of a reunion with new Cardinals head coach Bruce Arians. The duo worked together for three years in Pittsburgh, where Mendenhall rushed for 3,309 yards and 29 touchdowns and averaged 4.2 yards per carry. But Mendenhall hasn’t been close to the best back added this offseason, as Clemson’s Andre Ellington — a sixth round of the 2013 Draft — has 388 yards this year on 54 carries. Thanks to his spectacular 7.2 yards per carry average, he has outgained Mendenhall despite seeing roughly half as many carries.

How crazy is it for one back in a committee to average more than four more yards per carry than the other back? I ran the following query for every team since 1970:

  • First, I noted the two running backs who recorded the most carries for each team
  • Next, I eliminated all running back pairs where the lead back had over 150 more carries than the backup.
  • I also eliminated all pairings where the lead back was a lead back in name only due to injury to the starter (otherwise, years where Maurice Jones-Drew and Darren McFadden ranked second on their team in carries would be inappropriately included). To do that, I deleted sets where the “lead” back — defined as the back with the most carries — averaged fewer carries per game than the second running back.

After running through those criteria, the table below shows all situations where the backup averaged at least one more yard per rush than the lead back. As always, the table is fully searchable and sortable. It is currently sorted by the difference between the YPC average of the backup and the starter, but you can sort by year to bring the recent instances to the top.
[continue reading…]

{ 8 comments }

Is Ray Rice Already Washed Up?

Rice is averaging just over five feet, nine inches per carry

Rice is averaging just over five feet, nine inches per carry.

In many ways, the post-Ray Lewis Ravens have flown under the radar. The defending Super Bowl champions are just 3-5, thanks mostly to a mediocre offense. But unless you have Ray Rice on your fantasy team, you probably haven’t noticed just how rough a season the star running back is having. Of course, “Ray Rice” is just a euphemism for “Ray Rice, running behind the Ravens offensive line, playing alongside Joe Flacco and the rest of his Baltimore teammates.” Rice is averaging just 2.7 yards per carry on 97 carries, well below the 4.5 YPC career average he produced prior to 2013. Backup running back Bernard Pierce isn’t doing any better, putting up the same average on 85 rush attempts. As a team, Baltimore is averaging just 2.78 yards per rush, making the Ravens one of just six teams since the merger to average fewer than 2.80 yards per carry through nine games.

As you might expect, much of the blame falls on the Baltimore offensive line. In particular, tackles Michael Oher and Bryant McKinnie have been terrible, so much so that McKinnie was traded to Miami. Pro Football Focus also gives poor run-blocking grades to Ed Dickson, Dallas Clark (unsurprisingly), and Vonta Leach (very surprisingly). I haven’t watched enough of Baltimore to tell you why the Ravens have struggled so significantly to run the ball, but I can provide some perspective on how poorly Rice’s numbers are.

We don’t have play-by-play data going back to 1960, but we do have game-by-game data back that far. I went back and noted every running back who had a season-to-date yards per carry average below 2.80 following the game where he recorded his 97th carry. The table below shows the 43 players to do so from 1960 to 2012, sorted in reverse chronological order. The last player was former Raven Chester Taylor, and here is how his line reads: In 2010, playing for the Bears at age 31, Taylor had 105 carries for 252 yards, producing a 2.4 yards per carry average, following the game where he received his 97th carry of the year. The rest of the season, he had 7 rushes for 15 yards, a 2.14 YPC average.
[continue reading…]

{ 4 comments }

Trent Richardson and 400 carries

Richardson powers through for three yards

Richardson powers through for three yards.

Trent Richardson has been a frequent topic of discussion at Football Perspective. In about 14 months, I’ve written the following articles:

  • How often does the first running back selected in the draft become the best running back from his class? The field is always a better bet than one player: Only about 40% of the highest-drafted backs led their class in rushing yards as a rookie, with that number dropping to about 33% on a career basis. On the other hand, that’s better than the production of the first-drafted wide receiver.
  • In 2012, the field won, as both Doug Martin and Alfred Morris rushed for more yards than Richardson. I then tried to project the number of yards for all three players for 2013 based on their draft status and rookie production; as it turns out, draft status remained extremely important, and Richardson projected to average the most yards per game in year two out of that group (a projection that doesn’t look very good right now).
  • In July, I continued to voice my disdain for the use of yards per carry as the main statistic for running backs, when I argued that Richardson’s 3.6 average last year was not important. More specifically, I said if you loved Richardson as a prospect, his 3.6 YPC average in 2012 was not a reason to downgrade him (of course, if you didn’t like Richardson, that’s a different story). Richardson still received a huge percentage of Cleveland carries and had a strong success rate, and I argued that his low YPC was simply a function of a lack of big plays. For a more in-depth breakdown of his rookie season, Brendan Leister compiled a good film-room breakdown of some of Richardson’s mistakes in 2012. Leister noted that Richardson had some mental mistakes, which isn’t atypical of a rookie, and still fawned over the former Alabama star’s physical potential.
  • After the trade to Indianapolis, I wrote that Richardson’s ability as a pass blocker was tough to analyze, and advised you to view some of the numbers thrown around in support of Richardson with skepticism. Believe it or not, I still have thoughts on that trade that I just haven’t gotten around to finishing, so look for my hot take on the Richardson deal to be published in say, March.

In 75 carries with the Colts, Richardson is averaging just 3.0 yards per carry. Even though I find yards per carry overrated, there is a certain baseline level of production needed for every running back, and 3.0 falls well short of that number. For his career, Richardson now has 1,283 yards on 373 yards, a 3.44 YPC average. He’ll reach 400 career carries in a couple of weeks, so I thought it might be interesting to look at the YPC averages of all running backs after their first 400 carries.

We can’t measure that exactly through game logs, but what we can do is calculate the career YPC average of each running back after the game in which they hit 400 career carries. The table below shows that number for all running backs who entered the league in 1960 or later and is current through 2012. Let’s start with the top 50 running backs:
[continue reading…]

{ 6 comments }

Yards per Carry and Points per Drive

I’ve written a couple of times about “yards per carry” as a key statistic to grade running backs. The usual argument in favor of using YPC is that a running back who rushes for 1200 yards on 300 carries is less valuable, all else being equal, than one who rushes for 1200 yards on 250 carries. But when it comes to running backs and yards per carry, “all else” is is never equal. Two players come to mind whenever yards per carry is cited for running backs: Eddie George and Curtis Martin.

From 1996 to 2002, George led the league with 2,421 carries. Only Martin (2,236) was within 300 carries of George. In NFL history, Eric Dickerson is the only player to ever record more carries during a player’s first seven seasons. But some would have you believe that George wasn’t very good during those seven years, because he averaged just 3.71 yards per carry. During that stretch, the Titans went 68-44, giving them the fourth best record in the NFL and the second-best mark in the AFC during that span. But, the yards-per-carry proponents would argue, Jeff Fisher didn’t know what he was doing when he kept handing the ball off to George, play after play, game after game, year after year.

In 1998, the Jets went 12-4 and earned a first-round bye; New York went 12-1 in Vinny Testaverde’s thirteen starts, and finished in the top five of the league in points, yards, and first downs. That season, Curtis Martin received 369 carries despite missing one game due to injury. Martin rushed 25+ times in seven games and recorded at least 17 carries in every game that year… and averaged only 3.49 yards per carry. There are some who would have you believe that the Hall of Fame head coach didn’t quite know what he was doing that year, and the Jets would have been even better had the team called Martin’s number less frequently.
[continue reading…]

{ 12 comments }

Last week, I wrote about why I was not concerned with Trent Richardson’s yards per carry average last season. I like using rushing yards because rush attempts themselves are indicators of quality, although it’s not like I think yards per carry is useless — just overrated. One problem with YPC is that it’s not very stable from year to year. In an article on regression to the mean, I highlighted how yards per carry was particularly vulnerable to this concept. Here’s that chart again — the blue line represents yards per carry in Year N, and the red line shows YPC in Year N+1. As you can see, there’s a significant pull towards the mean for all YPC averages.

regression ypc

I decided to take another stab at examining YPC averages today.  I looked at all running backs since 1970 who recorded at least 50 carries for the same team in consecutive years. Using yards per carry in Year N as my input, I ran a regression to determine the best-fit estimate of yards per carry in Year N+1. The R^2 was just 0.11, and the best fit equation was:

2.61 + 0.34 * Year_N_YPC

So a player who averages 4.00 yards per carry in Year N should be expected to average 3.96 YPC in Year N+1, while a 5.00 YPC runner is only projected at 4.30 the following year.

What if we increase the minimums to 100 carries in both years? Nothing really changes: the R^2 remains at 0.11, and the best-fit formula becomes:

2.63 + 0.34 * Year_N_YPC

150 carries? The R^2 is 0.13, and the best-fit formula becomes:

2.54 + 0.37 * Year_N_YPC

200 carries? The R^2 stays at 0.13, and the best-fit formula becomes:

2.61 + 0.36 * Year_N_YPC

Even at a minimum of 250 carries in both years, little changes. The R^2 is still stuck on 0.13, and the best-fit formula is:

2.68 + 0.37 * Year_N_YPC

O.J. Simpson typifies some of the issues. It’s easy to think of him as a great running back, but starting in 1972, his YPC went from 4.3 to 6.0 to 4.2 to 5.5 to 5.2 to 4.4. Barry Sanders had a similar stretch from ’93 to ’98, bouncing around from 4.6 to 5.7 to 4.8 to 5.1 to 6.1 and then finally 4.3. Kevan Barlow averaged 5.1 YPC in 2003 and then 3.4 YPC in 2004, while Christian Okoye jumped from 3.3 to 4.6 from 1990 to 1991.

This guy knows about leading the league

This guy knows about leading the league.

Those are isolated examples, but that’s the point of running the regression. In general, yards per carry is not a very sticky metric. At least, it’s not nearly as sticky as you might think.

That was going to be the full post, but then I wondered how sticky other metrics are.  What about our favorite basic measure of passing efficiency, Net Yards per Attempt? For purposes of this post, an Attempt is defined as either a pass attempt or a sack.

I looked at all quarterbacks since 1970 who recorded at least 100 Attempts for the same team in consecutive years. Using NY/A in Year N as my input, I ran a regression to determine the best-fit estimate of NY/A in Year N+1. The R^2 was 0.24, and the best fit equation was:

3.03 + 0.49 * Year_N_NY/A

This means that a quarterback who averages 6.00 Net Yards per Attempt in Year N should be expected to average 5.97 YPC in Year N+1, while a 7.00 NY/A QB is projected at 6.45 in Year N+1.

What if we increase the minimums to 200 attempts in both years? It has a minor effect, bringing the R^2 up to 0.27, and producing the following equation:

2.94 + 0.51 * Year_N_NY/A

300 Attempts? The R^2 becomes 0.28, and the best-fit formula is now:

2.94 + 0.53 * Year_N_NY/A

400 Attempts? An R^2 of 0.26 and a best-fit formula of:

3.18 + 0.50 * Year_N_NY/A

After that, the sample size becomes too small, but the takeaway is pretty clear: for every additional yard a quarterback produces in Year N, he should be expected to produce another half-yard in NY/A the following year.

So does this mean NY/A is sticky and YPC is not? I’m not so sure what to make of the results here. I have some more thoughts, but first, please leave your ideas and takeaways in the comments.

{ 8 comments }

An ordinary hit

An ordinary hit.

Just about every article about Trent Richardson references his unimpressive 3.6 yards per carry average from last season. That stat is pretty meaningless, in my opinion. I suppose if you took a random running back from NFL history, and his YPC average in one random season was 3.6, and I knew nothing else about the player, I suppose I would probably assume that the running back was not (or was not going to become) a star. But Richardson isn’t a random running back from a database, because…

  • His 3.6 YPC average came on 267 carries, which represented 77% of all carries by Cleveland running backs
  • He was a rookie last year
  • He was a high first round pick

Since 1970, only 13 first round rookies have recorded 70% of all running back carries by their team. Two of those players were Richardson and Tampa Bay’s Doug Martin last year. Of that group, Richardson did post the lowest YPC average, but he was within 0.1 YPC of LaDainian Tomlinson. The next two lowest averages belong to Robert Edwards and Emmitt Smith; the former suffered a career-debilitating injury in a beach football game after his rookie season, while the latter ran for the most yards in NFL history.

Yeah, Richardson’s yards per carry average was well below average. But the universe of first round running backs who became workhorses right away as rookies and had a low YPC average consists of a HOF running back, a future HOF running back, and a player who suffered the flukiest of injuries. Richardson has something else in common with Emmitt Smith: after both of their rookie seasons, Norv Turner came on board as offensive coordinator.

But let’s say you don’t want to give Richardson any credit for his draft status. And you’re not in the mood to give him a pass just because he was a rookie. OK. Since 1990, 48 running backs have averaged fewer than 3.8 yards per carry while recording at least 70% of all running back carries for their team. Twenty-six of those players were at least 27 years old, and on the back half of their careers. Here are the other 22 running backs:
[continue reading…]

{ 22 comments }

Trivia of the Day – Sunday, July 29th

One of the five most versatile running backs of the last 30 years -- P.K.

Yesterday’s question focused on which leading wide receiver led the NFL in yards per reception. Today, we’ll look at running backs in a similar light.

Carolina’s Cam Newton led the league in yards per carry in 2011, which isn’t that unusual. Michael Vick led the league in that category in five of the last ten seasons, and it wouldn’t be shocking to see Robert Griffin III, Newton, or Vick lead the NFL in yards per carry in 2012. But today’s trivia is focused on running backs.

Darren Sproles not only led the Saints in rushing yards, but he averaged an incredible 6.9 yards per carry last season. Sproles may be the game’s most dominant space player, but he fell 13 carries shy of the 100 carries necessary to qualify for the yards-per-carry crown. So which qualifying running back led the league in yards per carry in 2011?

Trivia hint 1 Show


Trivia hint 2 Show


Trivia hint 3 Show


Click 'Show' for the Answer Show

{ 0 comments }