≡ Menu

Regression to the mean and Team Wins

The two Texas teams had much better seasons in 2014 than they did in 2013. Houston jumps from 2 to 9 wins, while Dallas improved from 8 to 12 wins. Which season was more impressive as far as team improvement?

If you like math, you probably are thinking that improving by 7 wins is more impressive than improving by 4 wins. But if you love math, you are probably thinking about regression to the mean. After all, sure, Houston won only 2 games in 2013, but nobody expected them to be that bad last year. In fact, the Texans were arguably projected to be the best team in the state last year! [1] Just before the season, both Houston and Dallas had Vegas over/under odds of 7.5 wins, but the way the money lines were set up hinted that Vegas wanted to get more action on Dallas and the over.

But instead of using Vegas odds, I thought it would be interesting to take a quick look at the effects of regression to the mean on team wins. I looked at every team season from 2003 to 2014, and noted how many wins each team won in the prior year and in the current year. I then ran a linear regression using prior year (Year N-1) wins to create a best-fit formula for current (Year N) wins. That formula was:

5.51 + 0.31 * Year N-1 Wins

What this means is that to predict future wins, start with a constant for all teams (5.51 wins), and then add only 0.31 wins for every prior win. In other words, three additional wins in Year N-1 aren’t even enough to project one full extra win in Year N! That’s a remarkable amount of regression to the mean, even if not necessarily surprising. [2]Since this has been studied to death. For those curious, the R^2 was just 0.094, another sign of how not valuable it is to just know how many games a team won in the prior year. [continue reading…]

References

References
1 Just before the season, both Houston and Dallas had Vegas over/under odds of 7.5 wins, but the way the money lines were set up hinted that Vegas wanted to get more action on Dallas and the over.
2 Since this has been studied to death.
{ 1 comment }

Last week, I wrote about why I was not concerned with Trent Richardson’s yards per carry average last season. I like using rushing yards because rush attempts themselves are indicators of quality, although it’s not like I think yards per carry is useless — just overrated. One problem with YPC is that it’s not very stable from year to year. In an article on regression to the mean, I highlighted how yards per carry was particularly vulnerable to this concept. Here’s that chart again — the blue line represents yards per carry in Year N, and the red line shows YPC in Year N+1. As you can see, there’s a significant pull towards the mean for all YPC averages.

regression ypc

I decided to take another stab at examining YPC averages today.  I looked at all running backs since 1970 who recorded at least 50 carries for the same team in consecutive years. Using yards per carry in Year N as my input, I ran a regression to determine the best-fit estimate of yards per carry in Year N+1. The R^2 was just 0.11, and the best fit equation was:

2.61 + 0.34 * Year_N_YPC

So a player who averages 4.00 yards per carry in Year N should be expected to average 3.96 YPC in Year N+1, while a 5.00 YPC runner is only projected at 4.30 the following year.

What if we increase the minimums to 100 carries in both years? Nothing really changes: the R^2 remains at 0.11, and the best-fit formula becomes:

2.63 + 0.34 * Year_N_YPC

150 carries? The R^2 is 0.13, and the best-fit formula becomes:

2.54 + 0.37 * Year_N_YPC

200 carries? The R^2 stays at 0.13, and the best-fit formula becomes:

2.61 + 0.36 * Year_N_YPC

Even at a minimum of 250 carries in both years, little changes. The R^2 is still stuck on 0.13, and the best-fit formula is:

2.68 + 0.37 * Year_N_YPC

O.J. Simpson typifies some of the issues. It’s easy to think of him as a great running back, but starting in 1972, his YPC went from 4.3 to 6.0 to 4.2 to 5.5 to 5.2 to 4.4. Barry Sanders had a similar stretch from ’93 to ’98, bouncing around from 4.6 to 5.7 to 4.8 to 5.1 to 6.1 and then finally 4.3. Kevan Barlow averaged 5.1 YPC in 2003 and then 3.4 YPC in 2004, while Christian Okoye jumped from 3.3 to 4.6 from 1990 to 1991.
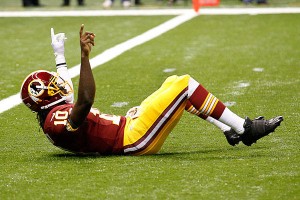
This guy knows about leading the league

This guy knows about leading the league.

Those are isolated examples, but that’s the point of running the regression. In general, yards per carry is not a very sticky metric. At least, it’s not nearly as sticky as you might think.

That was going to be the full post, but then I wondered how sticky other metrics are.  What about our favorite basic measure of passing efficiency, Net Yards per Attempt? For purposes of this post, an Attempt is defined as either a pass attempt or a sack.

I looked at all quarterbacks since 1970 who recorded at least 100 Attempts for the same team in consecutive years. Using NY/A in Year N as my input, I ran a regression to determine the best-fit estimate of NY/A in Year N+1. The R^2 was 0.24, and the best fit equation was:

3.03 + 0.49 * Year_N_NY/A

This means that a quarterback who averages 6.00 Net Yards per Attempt in Year N should be expected to average 5.97 YPC in Year N+1, while a 7.00 NY/A QB is projected at 6.45 in Year N+1.

What if we increase the minimums to 200 attempts in both years? It has a minor effect, bringing the R^2 up to 0.27, and producing the following equation:

2.94 + 0.51 * Year_N_NY/A

300 Attempts? The R^2 becomes 0.28, and the best-fit formula is now:

2.94 + 0.53 * Year_N_NY/A

400 Attempts? An R^2 of 0.26 and a best-fit formula of:

3.18 + 0.50 * Year_N_NY/A

After that, the sample size becomes too small, but the takeaway is pretty clear: for every additional yard a quarterback produces in Year N, he should be expected to produce another half-yard in NY/A the following year.

So does this mean NY/A is sticky and YPC is not? I’m not so sure what to make of the results here. I have some more thoughts, but first, please leave your ideas and takeaways in the comments.

{ 8 comments }

Correlating passing stats with wins

Which stats should be used to analyze quarterback play? That question has mystified the NFL for at least the last 80 years. In the 1930s, the NFL first used total yards gained and later completion percentage to determine the league’s top passer. Various systems emerged over the next three decades, but none of them were capable of separating the best quarterbacks from the merely very good. Finally, a special committee, headed by Don Smith of the Pro Football Hall of Fame, came up with the most complicated formula yet to grade the passers. Adopted in 1973, the NFL has used passer rating ever since to crown its ‘passing’ champion.

Nearly all football fans have issues with passer rating. Some argue that it’s hopelessly confusing; others simply think it just doesn’t work. But there are some who believe in the power of passer rating, like Cold Hard Football Facts founder Kerry Byrne. A recent post on a Cowboys fan site talked about Dallas’ need to improve their passer rating differential. Passer rating will always have supporters for one reason: it has been, is, and always will be correlated with winning. It is easy to test how closely correlated two variables are; in this case, passer rating (or any other statistic) and wins. The correlation coefficient is a measure of the linear relationship between two variables on a scale from -1 to 1. Essentially, if two variables move in the same direction, their correlation coefficient them will be close to 1. If two variables move with each other but in opposite directions (say, the temperature outside and the amount of your heating bill), the CC will be closer to -1. If the two variables have no relationship at all, the CC will be close to zero.

The table below measures the correlation coefficient of certain statistics with wins. The data consists of all quarterbacks who started at least 14 games in a season from 1990 to 2011:

CategoryCorrelation
ANY/A [1]Adjusted Net Yards per Attempt, calculated as follows: (Passing Yards + 20*Passing Touchdowns - 45*Interceptions - Sack Yards Lost) / (Pass Attempts + Sacks) 0.55
Passer Rating0.51
NY/A [2]Net Yards per attempt, which includes sack yards lost in the numerator and sacks in the denominator.0.50
Touchdown/Attempt0.44
Yards/Att0.43
Comp %0.32
Interceptions/Att-0.31
Sack Rate-0.28
Passing Yards0.16
Attempts-0.14

As you can see, passer rating is indeed correlated with wins; a correlation coefficient of 0.51 indicates a moderately strong relationship; the two variables (passer rating and wins) are clearly correlated to some degree. Interception rate is also correlated with wins; there is a ‘-‘ sign next to the correlation coefficient because of the negative relationship, but that says nothing about the strength of the relationship. As we would suspect, as interception rate increases, wins decrease. On the other hand, passing yards bears almost no relationships with wins — this is exactly what Alex Smith was talking about last month:
[continue reading…]

References

References
1 Adjusted Net Yards per Attempt, calculated as follows: (Passing Yards + 20*Passing Touchdowns - 45*Interceptions - Sack Yards Lost) / (Pass Attempts + Sacks)
2 Net Yards per attempt, which includes sack yards lost in the numerator and sacks in the denominator.
{ 43 comments }