≡ Menu

Hail to the Newest Passer Rating King

[[Update: Mahomes hit the 1,500 pass attempt mark in week 11 against Tampa Bay, and did so with exactly 1,000 completions. He had thrown for 12,782 passing yards, with 105 TDs and 20 INTs. That translates to an amazing 110.9 passer rating. When he threw that 1500th pass, a 9-yard completion to Demarcus Robinson right after the 2-minute warning in the first half, he automatically became the all-time career leader in passer rating. He moved ahead of Deshaun Watson (103.6), who had just moved ahead of Rodgers (103.3) after his great performance on Thanksgiving. Mahomes is now the newest career passer rating king, and will finish the 2020 season — and probably several more — as the all-time leader.]]

To qualify for the career leaderboard in rate statistics, a passer needs to record 1,500 pass attempts.

Aaron Rodgers reached the 1,500 pass attempt threshold on November 28, 2010 in a loss to the Falcons.  At the time, his career passer rating was a few hundredths of a point behind Philip Rivers (97.34 to 97.28). As of Christmas, 2010, Rivers still held a narrow lead, but Rodgers passed him (with little fanfare) in week 16. And since week 16 of the 2010 season, Rodgers has been alone atop the passer rating leaderboard.

But in a couple of weeks, he will lose his crown. That’s because Patrick Mahomes, he of the 110.5 career passer rating, is coming up on 1,500 career pass attempts. When he does, he will become the newest passer rating king. The statistic wasn’t first used in the NFL until the 1973 season, but we can still create a historical archive (which is exactly what PFR’s Mike Kania did). The graph below shows the career leader in passer rating after every season, minimum 1,500 NFL attempts, color-coded by team. [continue reading…]

{ 0 comments }

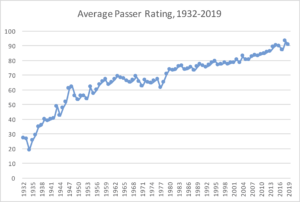
Over the last few years, I have been updating the career passer ratings for NFL quarterbacks to adjust for era. Over the last 100 years, the NFL has consistently approved rules changes to make passing easier, and as a result, passer rating has consistently spiked:

[continue reading…]

{ 1 comment }

Why Have Passer Ratings Become More Compressed?

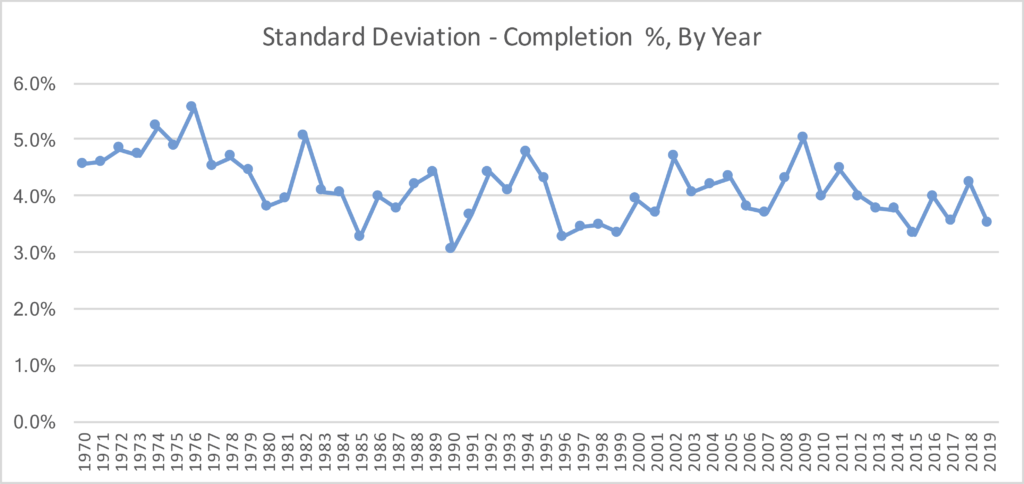
Yesterday, I wrote that the range of passer ratings is getting smaller.  Today, let’s investigate why.  As you know, passer rating is made up of four variables: completion percentage, yards per attempt, touchdown rate, and interception rate.

For each of the four variables, I calculated the standard deviation in that metric for all of the teams in the league in that season.  Last year, for example, the standard deviation in completion percentage was about 3.5%.  That’s on the low end historically, although not the absolute lowest mark.  But in general, it’s fair to say that the league-wide completion percentages are getting more compressed.  Last season, the Saints completed 72% of the team’s passes, and the Bengals were last at 58%. But in 1976, the Raiders were at 64%, while the Bills were at 41%.  That In 1994, the 49ers were a big outlier as they completed 70% of their passes at a time when two teams (Washington, Houston) completed just under 50% of their passes.

With a much higher floor now — the league average completion percentage was 58% in 1994, the same as what the 32nd-ranked Bengals did in 2019 — completion percentages as a whole are simply more compressed.

When it comes to yards per attempt, there isn’t much of a trend.  The variation was a bit higher in the ’70s, but over the last 40 years, the standard deviation is around 0.7 yards per attempt each season.

[continue reading…]

{ 0 comments }

The Range Of Passer Ratings Is Getting Smaller

In 1988, the passer rating for the entire NFL was 72.9. In 2019, every single team had a passer rating higher than that mark! Last season, the Carolina Panthers finished with a 74.7 passer rating, which was both the lowest in the 2019 NFL season and also the highest mark in history by a team that ranked last in that statistic.

This is part of two general trends: passer ratings are going up, but also, the variance in passer ratings is declining. [continue reading…]

{ 0 comments }

2019 Era-Adjusted Passer Ratings

In what is becoming a yearly tradition, today I am going to post the era-adjusted passer ratings from the 2019 season.

Passer rating is made up of four variables: completion percentage, yards per attempt, touchdown percentage, and interception percentage. The reason passer rating needs to be adjusted for era? Well, that’s pretty simple to explain.

When the formula was derived in the early ’70s, an average rating in each variable was achieved with a 50% completion rate, averaging 7.0 yards per pass attempt, a 5% touchdown rate, and a 5.5% interception rate. Since those numbers are wildly out of date, I came up with a formula that perfectly matches the intent of passer rating but ties the variables to the league average in any given season. You can get the formulas and read more background in the linked posts.

In 2019, the four averages were 63.5%, 7.22, 4.46%, and 2.30%, respectively. The big changes, of course, are in completion percentage and interception rate; yards per attempt is much more stable throughout history, while touchdown rate is actually slightly lower than it was in the ’70s.

One thing to keep in mind: these adjustments will not change the order of passer ratings in a given season. So Ryan Tannehill, Drew Brees, Lamar Jackson, Kirk Cousins, and Russell Wilson will remain your top 5 leaders; the way the formula works, it simply subtracts a fixed amount from each passer’s actual passer rating. In 2019, that amount was a whopping 23.7 points from each passer.

Below are the 2019 passer ratings: [continue reading…]

{ 0 comments }

Lamar Jackson Leads The NFL In Adjusted Passer Rating

Jackson is the overwhelming favorite to win the MVP award.

Six years ago, I wrote about tweaking the passer rating formula. I am going to update that article today, to better analyze the remarkable season that Ravens second-year quarterback Lamar Jackson is having.

The main updates:

1) There’s no reason to exclude sack data from passer rating. Sacks happen on passing plays, and a quarterback should *not* get more credit in the passer rating formula for taking a sack rather than throwing an incomplete pass.

2) Scrambles should be treated like completed passes, and rushing yards should be counted the same as passing yards. I am going to broaden this today to include all rushing attempts, excluding kneels. A 10-yard run is just as valuable as a 10-yard pass, and a scramble on 3rd down should impact completion percentage the same way a check down to the running back does.  However, I am going to exclude all kneels from the data, which really shouldn’t be recorded as rushing plays to begin with.

3) Rushing touchdowns should be counted with passing touchdowns. This is self-evident.

4) Lost Fumbles should be counted with interceptions. Also self-evident.

Passer rating consists of four metrics, all weighted equally: completions per attempt, yards per attempt, touchdowns per attempt, and interceptions per attempt. I will use the same formula with the same weights and the same variables, but redefine what those variables are. Here are the new definitions, with the additions in blue. I have then shown the 2019 results, using the data as of this morning (i.e., through 14 weeks, plus the Ravens/Jets Thursday night game in week 15), for the 32 players with the most pass attempts so far this year. [continue reading…]

{ 1 comment }

For the last week, I’ve posted about the career passer ratings for quarterbacks after adjusting for era. Today is a simple data dump of the single season passer ratings.

Below are the era-adjusted passer ratings for every player in every season since 1932.  Here’s how to read the table below, which is fully sortable and searchable.  Sid Luckman has the best single season, playing in the NFL for Chicago in 1943.  That season counted for 11.58% of his career pass attempts (useful if you want to calculate a player’s career passer rating), as he threw 202 passes, completed 110 of them for 2,194 yards with 28 TDs and 12 INTs.  That was enough attempts to qualify for the passer rating crown; his actual passer rating was 107.5, and his Era Adjusted Passer Rating was 135.0, the best ever. [continue reading…]

{ 0 comments }

On Saturday, I looked at the era-adjusted leaders in completion percentage. On Sunday, I did the same for yards/attempt, on Monday, I analyzed the era-adjusted leaders in touchdown rate, and yesterday continued the analysis but for interception percentage.

I thought it would be helpful to have all the information in one place, so that’s what today’s post is.  Here’s how to read the table below.
Otto Graham threw 2,626 pass attempts, and played from 1946 to 1955. He is in the Hall of Fame. Based on the passer rating formula — where 1.00 represents league average (a 66.67 era-adjusted passer rating), and a 1.50 in each category translates to a 100.00 passer rating — Graham scored a 1.40 in completion percentage, 1.53 in yards/attempt, 1.25 in touchdown rate, and 1.53 in interception rate. If you add those four numbers and divide by 6 — yes, this is exactly how passer rating is calculated! — you get 95.2, which is Graham’s era-adjusted passer rating. The full results are below.
[continue reading…]

{ 0 comments }

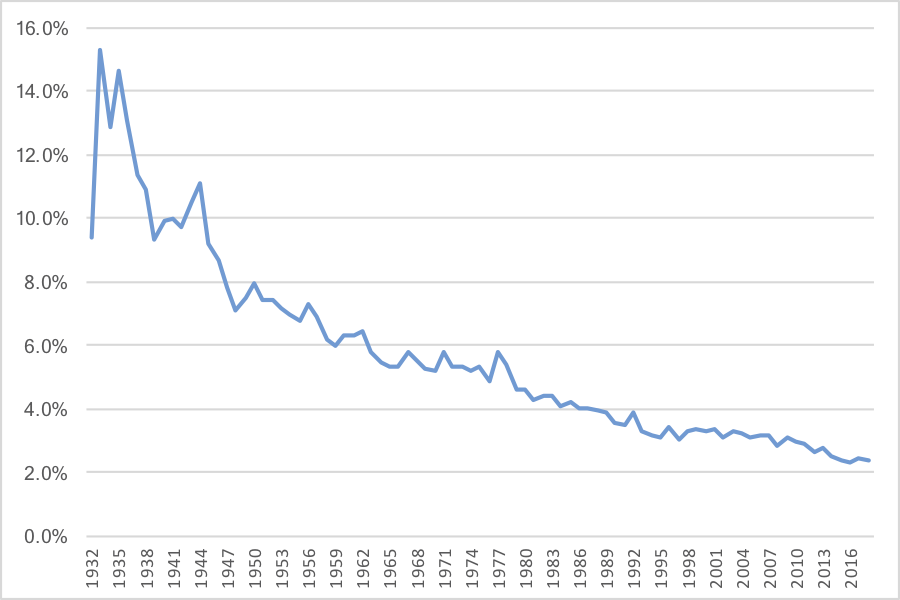
On Saturday, I looked at the era-adjusted leaders in completion percentage. On Sunday, I did the same for yards/attempt, and yesterday, I analyzed the era-adjusted leaders in touchdown rate.  Today, we continue the analysis but for interception percentage.

Here’s a look at the interception rate in each year since 1932.  As you can see, there is much more variation (and in a much more straightforward manner) than there was with TD rate:

[continue reading…]

{ 0 comments }

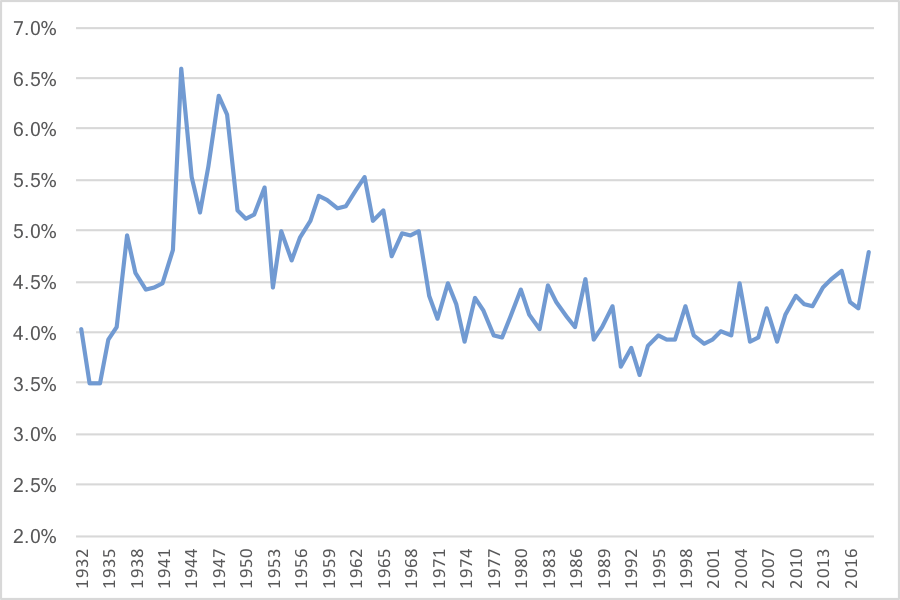
On Saturday, I looked at the era-adjusted leaders in completion percentage. Yesterday, I did the same for yards/attempt; today, we continue the analysis but for touchdown percentage.

Here’s a look at the touchdown rate in each year since 1932:

[continue reading…]

{ 0 comments }

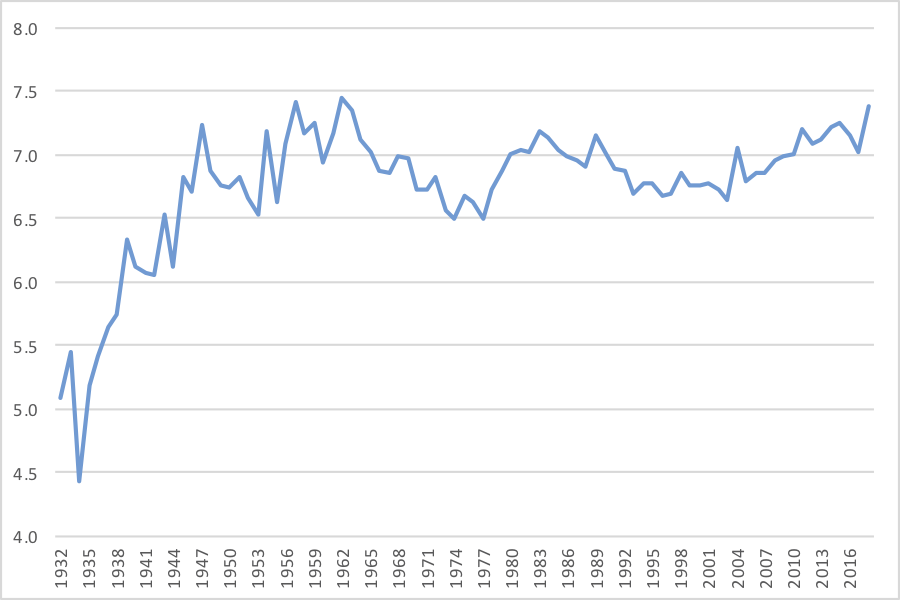
Yesterday, I looked at the era-adjusted leaders in completion percentage. Today, we’ll do the same thing but with yards per attempt.

The traditional passer rating formula measures Y/A by taking a passer’s Y/A, subtracting 3.0, and dividing the result by four. This makes sense when the average Y/A is around 7.0; in that case, 7.0 minus 3.0 equals 4.0, and dividing that by 4 gives a result of 1.00. But when the average passer isn’t averaging 7.0 yards per attempt, this formula isn’t so great. The graph below shows the average Y/A for all passers since 1932:

[continue reading…]

{ 0 comments }

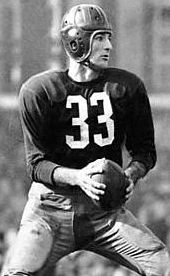
Baugh about to complete a pass, probably.

Regular readers know that I have spent some time over the past few years adjusting passer rating for era. One valuable part of the methodology is that we can also adjust each of the four component parts — completion percentage, yards per attempt, touchdown percentage, and interception percentage — for era.

Let’s take completion percentage. The passer rating formula measures completion percentage by taking a passer’s completion percentage, subtracting 30%, and multiplying the result by five. This made sense when the average completion percentage was around 50%; in that case, 50% minus 30% equals 20%, and multiplying that by 5 gives a result of 1.00.

To adjust for era, we replace “30%” in that formula with “league average minus 20%.” So in 2018, the league average completion percentage was 64.9%, which means we would use 44.9% for this formula. Drew Brees completed 74.4% of his passes; if we subtract the baseline from his result, we get 29.5%. Multiply that result by 5, and Brees gets a completion percentage score of 1.48 for 2018.

If we do this for every quarterback in every season of his career, and then weight each season by his number of pass attempts, we can get career grades. This is one way to come up with career completion percentages adjusted for era.

The overwhelming champion in this regard is Sammy Baugh, who led the NFL in completion percentage 8 times during the decade of the ’40s. As recently as 1975, Baugh was still 4th all-time in career completion percentage, and less than 1% off of the leader. Baugh has a rating of 1.58, which means on average he was better at completing passes relative to his era than Brees was in 2018.

The top passers in measuring completion percentage this way are Baugh followed by a who’s who of the completion percentage kings: Len Dawson, Otto Graham, Steve Young, Joe Montana, Sid Luckman, and Drew Brees.

The bottom 5? Rex Grossman, Jay Schroeder, Doug Williams, Mike Pagel, and the man at the very bottom of the list is… Derek Anderson. [continue reading…]

{ 0 comments }

Two years ago, I wrote a 6-part series describing how to adjust passer rating for era. I posted the career results in Part V, and the whole series is background reading for anyone who wants to learn how to adjust passer rating for era.

Last year, I updated those numbers based on the 2017 results. Earlier this year, I posted the 2018 single-season results, and today, I am going to update the career ratings.

Here’s how to read the table below. Otto Graham threw 2,626 passes, and played from 1946 to 1955. His actual passer rating was 86.6, but his era adjusted passer rating was 95.2, the best in pro football history. The final column shows whether a player is in the Hall of Fame, is a HOF lock (attributed to five players), is not in the Hall of Fame, or has never been eligible for the HOF. [continue reading…]

{ 1 comment }

2018 Era-Adjusted Passer Ratings

Two years ago, I wrote a six-part series on adjusting passer ratings for era.

Last year, after the 2017 regular season ended, I posted the single-season results and also updated the career ratings. Today is the 2018 update.

Passer rating is made up of four variables: completion percentage, yards per attempt, touchdown percentage, and interception percentage. The reason passer rating needs to be adjusted for era? Well, that’s pretty simple to explain.

When the formula was derived in the early ’70s, an average rating in each variable was achieved with a 50% completion rate, averaging 7.0 yards per pass attempt, a 5% touchdown rate, and a 5.5% interception rate.  Since those numbers are wildly out of date, I came up with a formula that perfectly matches the intent of passer rating but ties the variables to the league average in any given season. You can get the formulas and read more background in the linked posts.

In 2018, the four averages were 64.9%, 7.37, 4.79%, and 2.37%. The big changes, of course, are in completion percentage and interception rate; yards per attempt is much more stable throughout history (although 2018 was higher than in recent years), while touchdown rate is actually slightly lower than it was in the ’70s.

One thing to keep in mind: these adjustments will not change the order of passer ratings in a given season. So Drew Brees, Patrick Mahomes, Russell Wilson, Matt Ryan, Philip Rivers will remain your top 5 leaders; the way the formula works, it simply subtracts a fixed amount from each passer’s actual passer rating. In 2018, that amount was an enormous 26.3 points from each passer. [continue reading…]

{ 1 comment }

Single-Season Era-Adjusted Passer Ratings

On Monday, I published updated (through 2017) career passer ratings that are adjusted for era. Last year, I published the single-season ratings, so I wanted to update that post today.

Passer rating is a bad stat, and era-adjusted passer ratings have all of those same flaws, too. But EA-PR is without question better than passer rating, and since passer rating is such a ubiquitous stat, I wanted to post all of the EA-PRs so you could have them at your disposal (the table below has over 7,700 rows!).

Below are the era-adjusted passer ratings for every player in every season since 1932.  Here’s how to read the table below, which is fully sortable and searchable.  Sid Luckman has the best single season, playing in the NFL for Chicago in 1943.  That season counted for 11.58% of his career pass attempts (useful if you want to calculate a player’s career passer rating), as he threw 202 passes, completed 110 of them for 2,194 yards with 28 TDs and 12 INTs.  That was enough attempts to qualify for the passer rating crown; his actual passer rating was 107.5, and his Era Adjusted Passer Rating was 135.0, the best ever. [continue reading…]

{ 0 comments }

Background reading (Part I, Part II, Part III, Part IV, Part V: Career Era-Adjusted Passer Ratings Through 2016, 2017 Era-Adjusted Passer Ratings). You can also view the single-season era-adjusted passer ratings here.

The NFL’s passer rating formula can be broken down into the following.

A = (Cmp% – .30) * 5
B = (Y/A – 3.0) * .25
C = TD% * 20
D = 2.375 – Int% * 25

Passer Rating = 100 * (A + B + C + D) / 6

Let’s use Tom Brady as an example.  He has a completion percentage of 63.93 (making A = 1.696), a yards per attempt average of 7.514 (making B = 1.128), a TD percentage of 5.54% (making C = 1.108), and an INT percentage of 1.82% (making D = 1.921).  If you sum A, B, C, and D, multiply by 100, and divide by 6, you get 97.6, which is Brady’s career passer rating.

Last year, I derived the formula to create era-adjusted passer ratings.  This is necessary because the league averages in these variables — particularly completion percentage and interception rate — have changed dramatically over the last 50 years.  For example, when passer rating was created in the early 1970s, the average completion percentage was 50%.  So instead of taking each passer’s completion percentage and subtracting 0.30 (before multiplying by 5), we take each passer’s completion percentage and subtract from that the league average in a given season minus 0.20.  This makes a completion percentage of 60% in the 1970s equivalent to a completion percentage of 70% when the league average completion rate is 60%.

We can do that for all the four variables, and keep the same formula/structure largely in place.

Here are the new formulas for each of the four variables:

A = (Cmp% – (League_Avg_Cmp% – 0.20) ) * 5
B = ( Y/A – (League_Avg_Y/A – 4.0) ) * .25
C = TD% * 20 + (1 – 20 * LgAvgTD_Rate)
D = 2.375 – (Int% * 25 + (1.375 – 25 * LgAvgINT_Rate) )

Then we sum A through D, multiply by 100, and divide by 6.  The table below shows the career era-adjusted passer ratings for the 186 passers with at least 1,500 attempts. Here is how to read the table below. Otto Graham is the career leader in era adjusted passer rating (this analysis includes AAFC and AFL data — we are only adjusting for era in this analysis, not strength of league). He threw 2,626 passes in his career, began in 1946 and finished in 1955, had an actual passer rating of 86.6, and an era adjusted passer rating is 95.2. Graham, of course, is in the Hall of Fame. [continue reading…]

{ 0 comments }

2017 Era-Adjusted Passer Ratings

Last year, I wrote a six-part series on adjusting passer ratings for era.

Background reading:

Part I

Part II

Part III

Part IV

Part V (Career Passer Ratings)

Part VI (Single Season Ratings)

Passer rating is made up of four variables: completion percentage, yards per attempt, touchdown percentage, and interception percentage.  The reason passer rating needs to be adjusted for era? When it was derived, in order to get an average rating in each of the four variables, a passer needed to complete 50% of his passes, average 7.0 yards per pass, have a touchdown rate of 5%, and have an interception rate of 5.5% (yes, INT rates used to be higher than TD rates).  But those numbers — 50%, 7.0, 5%, 5.5% — were pegged in the 1970s and are not dynamic.  However, I came up with a formula that matches the intent of passer rating but just ties the variables to the league average in any given season. You can get the formulas and read more background in the linked posts.

Now, in 2017, the four averages were 62.1%, 7.02, 4.24%, and 2.46%.  One thing to keep in mind: these adjustments will not change the order of passer ratings in a given season.  So Alex Smith, Drew Brees, Tom Brady, Carson Wentz, and Jared Goff remain the top five; the way the formula works, it just subtracts a fixed amount from each passer’s actual passer rating.  In 2017, that amount was 20.26 during a poor passing season; it was 22.59 lower than actual in 2016. [continue reading…]

{ 0 comments }

Background reading:

Part I

Part II

Part III

Part IV

Part V (Career Passer Ratings)

In the interest of making all data available to you, the reader, the table below shows the averages for each professional football league since 1932 in the relevant passing statistics used to calculate passer rating: [continue reading…]

{ 9 comments }

Adjusting Passer Rating for Era: Part V: The Results

Background reading:

Part I

Part II

Part III

Part IV

All week, I have been discussing how to adjust passer rating by era. Now that I have explained the formula, it’s time to generate the results. In a given season, ratings won’t change (unless a player moves below or above a limit as a result of the era adjustment), so the most interesting thing to do is to present career passer ratings.

To calculate career passer ratings, I first calculated each player’s passer rating in each season. Then, I created their career rating by averaging the player’s passer rating in each season, weighted of course by their number of attempts in that season. And now, the results.

The table below shows all 185 players with at least 1500 career pass attempts (this includes the 2016 season). Here is how to read the table below. Otto Graham is the career leader in era adjusted passer rating (this includes his AAFC time). He ranks 115th in career pass attempts with 2,626. Since passer rating is the sum of four variables multiplied by 100 and divided by 6, I figured we might as well present the era adjusted variables, too. In completion percentage, Graham scores a 1.40; in yards per attempt, he is at a whopping 1.53; in touchdown percent, 1.25, and in interception percentage, a remarkable 1.53. As a result, his era adjusted passer rating is 95.2. [continue reading…]

{ 17 comments }

Background reading:

Part I

Part II

Part III

I’m going to assume you have read the first three parts of this series; today, I want to go through how to adjust passer rating by era while keeping the weights of 5, .25, 20, and 25 on the four variables. As a reminder, here are the formulas used for the four variables in passer rating, once you ignore the upper and lower limits:

A = (Cmp% – .30) * 5
B = (Y/A – 3.0) * .25
C = TD% * 20
D = 2.375 – Int% * 25

Adjusted Completion Percentage

For completion percentage, we can do a simple era adjustment because the multiplier is not directly tied to league average. Instead, league average is intended to be 20% higher than the floor, which is 0.30 in the original formula. So we need to rewrite completion percentage as simply

A = (Cmp% – (League_Avg_Cmp% – 0.20) ) * 5

So in an environment where the league average completion percentage was 50%, you would insert 0.3 in the blue parenthetical; in 2016, tho, you would insert 43.0%. [continue reading…]

{ 13 comments }

There are no fewer than four problems with passer rating.

1. It does not adjust for era.

2. It only includes four variables — completion percentage, yards per attempt, touchdown rate, and interception rate — which means valuable information like sacks, first downs, and rushing are excluded.

3. The variables it does include are improperly weighted: a completion is worth 20 yards (too much), a touchdown is worth 80 yards (also too much), and an interception is worth -100 ways (again, too much).

4. Like nearly all non-proprietary formulas, it does not provide any situational context: an interception on 1st-and-goal from the 1 is the same as an interception on a Hail Mary, a 10-yard catch on 4th-and-9 is the same as a 10-yard catch on 3rd-and-30, etc.

These are just some of the reasons why passer rating is stupid. For reasons I can’t quite articulate, I only want to focus on solving the issue presented by problem number one. Yes, it may be silly to artificially tie one hand behind my back, but my goal here is not to come up with a new formula, but just to fix one specific issue with passer rating that everyone can acknowledge.

The past two days, I have been writing about passer rating. If you ignore the upper and lower limits in the formula, passer rating’s four variables can be re-written like this: [continue reading…]

{ 14 comments }

In yesterday’s post, I examined the methodology behind passer rating. Here were the passer ratings for the 30 quarterbacks who threw enough passes to qualify for the crown in 2016:

RkPlayerTmAttCmpYdsTDIntCmp%Yd/AttTD%INT%Rating
1Matt Ryan*+ATL534373494438769.9%9.267.1%1.3%117.1
2Tom Brady*NWE432291355428267.4%8.236.5%0.5%112.2
3Dak Prescott*DAL459311366723467.8%7.995.0%0.9%104.9
4Aaron Rodgers*GNB610401442840765.7%7.266.6%1.1%104.2
5Drew BreesNOR6734715208371570.0%7.745.5%2.2%101.7
6Sam BradfordMIN552395387720571.6%7.023.6%0.9%99.3
7Kirk CousinsWAS6064064917251267.0%8.114.1%2.0%97.2
8Derek Carr*OAK560357393728663.8%7.035.0%1.1%96.7
9Andrew LuckIND5453464240311363.5%7.785.7%2.4%96.4
10Marcus MariotaTEN451276342626961.2%7.605.8%2.0%95.6
11Ben Roethlisberger*PIT5093283819291364.4%7.505.7%2.6%95.4
12Ryan TannehillMIA3892612995191267.1%7.704.9%3.1%93.5
13Matthew StaffordDET5943884327241065.3%7.284.0%1.7%93.3
14Russell WilsonSEA5463534219211164.7%7.733.8%2.0%92.6
15Andy DaltonCIN563364420618864.7%7.473.2%1.4%91.8
16Alex SmithKAN489328350215867.1%7.163.1%1.6%91.2
17Colin KaepernickSFO331196224116459.2%6.774.8%1.2%90.7
18Tyrod TaylorBUF436269302317661.7%6.933.9%1.4%89.7
19Philip RiversSDG5783494386332160.4%7.595.7%3.6%87.9
20Carson PalmerARI5973644233261461.0%7.094.4%2.3%87.2
21Jameis WinstonTAM5673454090281860.8%7.214.9%3.2%86.1
22Eli ManningNYG5983774027261663.0%6.734.3%2.7%86.0
23Trevor SiemianDEN4862893401181059.5%7.003.7%2.1%84.6
24Joe FlaccoBAL6724364317201564.9%6.423.0%2.2%83.5
25Carson WentzPHI6073793782161462.4%6.232.6%2.3%79.3
26Blake BortlesJAX6253683905231658.9%6.253.7%2.6%78.8
27Case KeenumLAR322196220191160.9%6.842.8%3.4%76.4
28Cam NewtonCAR5102703509191452.9%6.883.7%2.7%75.8
29Brock OsweilerHOU5103012957151659.0%5.802.9%3.1%72.2
30Ryan FitzpatrickNYJ4032282710121756.6%6.723.0%4.2%69.6

Now, as we learned yesterday, passer rating is the result of four variables: completion percentage, yards per attempt, touchdown rate, and interception rate. Those variables are all scaled so that the average score is 1.0 for each variable. Then, we take an average of the four variables and multiply it by 66.67, since that was intended to be the league average passer rating (or, said differently and how it is more commonly represented in formulas, we sum the four numbers, divide by six, and multiply by 100).

So let’s take a look at the scores in each of the four variables for these 30 quarterbacks to better understand their 2016 passer ratings. The far right column shows the average of those variables, which again, is equivalent to their passer rating divided by 66.67. [continue reading…]

{ 28 comments }

Adjusting Passer Rating for Era: Part I

Passer rating is a dumb stat. Let’s get that out of the way. As I’ve written before, passer rating is stupid because it gives a 20-yard bonus for each completion, a 100-yard penalty for each interception, and an 80-yard bonus for each touchdown. In reality, there should be no (or a very small) weight on completions (or, better yet, a bonus for completions that go for a first down), a 45-yard weight on interceptions, and a 20-yard weight on touchdowns. But given how ubiquitous passer rating is in analysis of passing, let’s at least try to understand it more.

Let’s begin with the formula one needs to calculate passer rating in Excel:

=IF(C2>223,SUM(MEDIAN(0,2.375,(D2/C2-0.3)*5),MEDIAN(0,2.375,[1]E2)/C2-3)*0.25),MEDIAN(0,2.375,F2/C2*20),MEDIAN(0,2.375,2.375-(G2/C2*25)/6*100,0)

To make this formula work, you need to put the following categories in these cells:

C2 = Attempts
D2 = Completions
E2= Passing Yards
F2 = Passing Touchdowns
G2 = Interceptions

That formula probably seems like gibberish to you, so let’s unpack it a little bit.

=IF(C2>223,SUM(MEDIAN(0,2.375,(D2/C2-0.3)*5),MEDIAN(0,2.375,[2]E2)/C2-3)*0.25),MEDIAN(0,2.375,F2/C2*20),MEDIAN(0,2.375,2.375-(G2/C2*25)/6*100,0)

This part is simple enough: if a quarterback doesn’t have at least 224 pass attempts (during a 16-game season), they fail to qualify for the passer rating crown.  You can lower this number for non-16-game seasons as necessary.

Passer Rating – Four Components

Passer rating comprises four components: completion percentage, yards per attempt, touchdowns per attempt, and interceptions per attempt.  Let’s see how the above formula addresses these concerns:

Completion Percentage

=IF(C2>223,SUM(MEDIAN(0,2.375,(D2/C2-0.3)*5),MEDIAN(0,2.375,[3]E2)/C2-3)*0.25),MEDIAN(0,2.375,F2/C2*20),MEDIAN(0,2.375,2.375-(G2/C2*25)/6*100,0)

Take a look at the bolded blue text — What are we doing? Taking completions and dividing them by attempts is how we come up with completion percentage, of course.  You take that result and subtract 0.3, or 30%.  Savvy readers will pick up on the fact that if your completion percentage is 29% or 0%, you get the same credit in passer rating: there is a floor of 30%. [continue reading…]

References

References
1, 2, 3 E2)/C2-3)*0.25),MEDIAN(0,2.375,F2/C2*20),MEDIAN(0,2.375,2.375-(G2/C2*25
{ 9 comments }

One of the very first posts at Football Perspective measured how various passing stats were correlated with wins.  One of the main conclusions from that post was that passer rating, because of its heavy emphasis on completion percentage and interception rate, was not the ideal way to measure quarterback play. But what about ESPN’s Total QBR, a statistic invented specifically to improve on — and supersede — traditional passer rating?

As a reminder, we can’t simply correlate a statistic with wins to determine the utility of that metric. The simplest way to remember this is that 4th quarter kneeldowns are highly correlated with wins. Just because you notice it’s raining when the ground is wet doesn’t mean a wet ground causes rain; i.e., just because two variables are correlated doesn’t mean variable A leads to variable B (alternatively, variable B could lead to variable A, variable C could lead to both variable A and B, or the sample size could be too small to determine any legitimate causal relationship). That said, it at least makes sense to begin with a look at how various statistics have correlate with wins.

The Sample Set

Throughout this post, I will be looking at a set of quarterback data consisting of the 152 quarterback seasons from 2006 to 2013 where the player had at least 14 games with 20+ action plays. Games where the quarterback had fewer than 20 plays were excluded, but the quarterback was still included if he otherwise had 14 such games.

The next step was to sum the weekly quarterback data on various metrics, including wins, and create season data. [1]For ESPN’s QBR, I took a weighted average of the weekly QBR data. I should note that this is not the way ESPN calculates QBR. As explained to me via email, the scaling function that gives the … Continue reading This allowed me to measure the correlation between a quarterback’s statistics over those 14+ games with that player’s winning percentage in those games.

As it turns out, ESPN’s Total QBR is very highly correlated with wins, with a 0.68 correlation coefficient. [2]As a reminder, the correlation coefficient is a measure of the linear relationship between two variables on a scale from -1 to 1. If two variables move in the same direction, their correlation … Continue reading This is to be expected; after all, Total QBR is based off Expected Points Added on the team level, which generally tracks wins and losses. The second most correlated statistic with wins was Adjusted Net Yards per Attempt, my favorite non-proprietary quarterback metric. After ANY/A, both traditional passer rating and touchdowns per attempt were the next most correlated statistics with wins (after all, this is only a step or two away from saying scoring points is correlated with wins). In another unsurprising result, passing yards had almost no correlation with wins, while pass attempts had a slight negative correlation (as any Game Scripts observer would know).  Take a look:

StatCC
ESPN QBR0.68
ANY/A0.57
Passer Rating0.56
TD/Att0.54
NY/A0.46
Yd/Att0.45
INT/Att-0.43
Cmp%0.33
Sack Rate-0.21
Pass Yds0.16
Attempts-0.10

When ESPN first introduced QBR, I wrote that I was intrigued by the possibility of this metric, but frustrated that the specific details of the formula remained confidential. At the time, a clutch weight feature was included in the calculations, which made the metric more of a retrodictive statistic than a predictive one. Since then, ESPN has tweaked the formula several times, and the clutch weight has been capped. [3]When Dean Oliver was on the Advanced NFL Stats podcast, he noted that the formula was tweaked in 2013 so that the “clutch index” part of the formula was essentially capped. He added … Continue reading ESPN is not engaged in academia, so I understand why they have not published all the fine print; as a researcher, I’m still frustrated by that decision. Still, with 8 years of QBR data now publicly available, we can answer two questions: does Total QBR predict wins and how sticky is Total QBR?

We know that a high Total QBR is correlated with winning games, but we also know that there’s limited value to such a statement. If having a high Total QBR was one of the driving factor behind winning games, than such a variable would manifest itself in all games, not just the current one. So with my sample of 152 quarterbacks, I used a random number generator to divide each quarterback season into two half-seasons. Then I calculated each quarterback’s average in several different categories and measured the correlation between a quarterback’s average in such category in each half-season with his winning percentage in the other half-season. [4]Then I did the entire process again, using a new set of random numbers, and averaged the results. The results:

StatCC
ESPN QBR0.31
Wins0.28
ANY/A0.25
Passer Rating0.25
TD/Att0.24
NY/A0.22
Yd/Att0.20
Cmp%0.17
Pass Yds0.16
INT/Att0.15
Sack Rate0.14
Attempts0.06

As you would expect, all of our correlations are now smaller. But ESPN’s quarterback rating metric remains the best measure to predict wins. Perhaps even more impressively, Total QBR is more correlated with future wins than past wins. That’s pretty interesting. Another interesting result is that passer rating fares pretty well here, although much of the same issues as before remain with using correlation to derive causal direction. [5]For example, because passer rating is biased towards high completion percentage and low interception rates, quarterbacks who play with the lead tend to produce strong passer ratings; well, playing … Continue reading

One other concept to remember is that our sample of quarterbacks consists of players who were heavily involved in at least 14 games. That makes sure Peyton Manning, Tom Brady, and Drew Brees are involved, while filtering out some Christian Ponder, Blaine Gabbert, and Brandon Weeden seasons. In other words, the data set contains more above-average quarterbacks than a random sample would, so we may not be able to justify certain conclusions from this study.

The other important question is whether Total QBR is predictive of itself; i.e., how “sticky” is this metric over different time periods. We know that interceptions are very random, and knowing a quarterback’s prior interception rate is not all that helpful in predicting his future interception rate. Where does Total QBR fall along those lines?

StatCC
Pass Yds0.69
Attempts0.66
Sack Rate0.56
Cmp%0.49
Passer Rating0.49
ESPN QBR0.47
ANY/A0.46
NY/A0.45
TD/Att0.43
Yd/Att0.42
Wins0.28
INT/Att0.2

The most “sticky” stats were passing yards and pass attempts, which in retrospect isn’t too surprising. These reflect the style of the offense, the talent of the quarterback, and the quality of the defense, so they should be easier to predict. The second-least sticky metric was wins, which also makes sense. After that, ESPN’s Total QBR fits in a narrow tier with most of our other metrics as being somewhat predictable.

Conclusion

The numbers here indicate that Total QBR is worth examining.  It may be a proprietary measure of quarterback play, but it’s not a subjective one with no basis in reality.  It does seem to be the “best” measure of quarterback play, although whether the tradeoff in accuracy for transparency is worth it remains up to each individual reader. One of the drawbacks I see in Total QBR is the failure to incorporate strength of schedule. And while no other traditional passer metric does, either, it’s also easy enough to make those adjustments. Hopefully, an SOS-adjusted Total QBR measure will be released soon (I’ll note that the college football version does include a strength-of-schedule adjustment).  My sense is that Total QBR is underutilized because (1) ESPN haters hate it because it’s an ESPN statistic, (2) it’s proprietary, and (3) analytics types disliked it because of the (now-eliminated) clutch rating.  While I would not suggest making it the only tool at your disposal, it does appear to deserve a prominent place in your toolbox.

References

References
1 For ESPN’s QBR, I took a weighted average of the weekly QBR data. I should note that this is not the way ESPN calculates QBR. As explained to me via email, the scaling function that gives the “final” QBR on a 0-100 scale is nonlinear; as a result, you can’t just calculate a weighted average of the individual game QBR values to get season QBR. Instead, you need to have the “points per play”-like value that’s behind QBR and calculate the weighted average of that (and weight based on the capped clutch weights, not even the action plays), then re-apply the scaling function to get it back on the 0-100 scale. So while I’m recreating QBR, I’m not recreating it the way ESPN would. That disclaimer aside, I don’t think my method will bias these results.
2 As a reminder, the correlation coefficient is a measure of the linear relationship between two variables on a scale from -1 to 1. If two variables move in the same direction, their correlation coefficient will be close to 1. If two variables move with each other but in opposite directions (say, the number of hours you spend watching football and your significant other’s happiness level), then the CC will be closer to -1. If the two variables have no relationship at all, the CC will be close to zero.
3 When Dean Oliver was on the Advanced NFL Stats podcast, he noted that the formula was tweaked in 2013 so that the “clutch index” part of the formula was essentially capped. He added (beginning at 13:45): “The most clutch plays are ending up counting essentially the same as all other plays. [What] we ended up deciding is that for games that are out of reach, when quarterbacks are putting up meaningless statistics because they are playing against a defense that is not trying as hard because they know that the game is essentially over – so that you can get your yards but we’re just trying to run out the clock – so we still keep in a clutch weight reduction effectively, associated with garbage time. But there isn’t the increase in clutch weight associated with clutch plays.”
4 Then I did the entire process again, using a new set of random numbers, and averaged the results.
5 For example, because passer rating is biased towards high completion percentage and low interception rates, quarterbacks who play with the lead tend to produce strong passer ratings; well, playing with the lead is pretty highly correlated with winning, and winning is also correlated with future wins.
{ 26 comments }

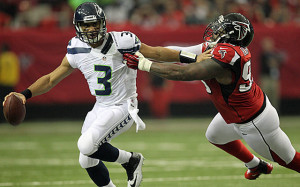
Wilson scrambles and gets credit for it.

Wilson scrambles and gets credit for it.

I hate passer rating. So do you. Everyone does, except for Kerry Byrne. Passer rating is stupid because it gives a 20-yard bonus for each completion, a 100-yard penalty for each interception, and an 80-yard bonus for each touchdown. In reality, there should be no (or a very small) weight on completions, a 45-yard weight on interceptions, and a 20-yard weight on touchdowns.

But let’s ignore those issues today. Reading Mike Tanier’s recent article inspired me to make see what passer rating would look like if we make three tweaks. I’m not going to change any of the weights in the formula, but just redefine the variables.

1) There’s no reason to exclude sack data from passer rating. I’ve stopped writing about how sacks are just as much (if not more) on the quarterback than other passing metrics, because I think that horse has been pretty well beaten by Jason Lisk and me.

2) Scrambles should be treated like completed passes. If Russell Wilson is about to be sacked, but escapes and run for 7 yards, why should that be treated any differently than if Peyton Manning is about to be sacked, but throws a seven-yard pass at the last second?

3) Lost Fumbles should be counted with interceptions. One could make a few advanced arguments here — we should use all fumbles instead of lost fumbles, or fumbles should be given an even stronger weight than interceptions (although consider that in light of this post), or that we should limit ourselves to just fumbles lost on passing plays. I’m going to play the simple card here, and just use lost fumbles data on the season level.

Passer rating consists of four metrics, all weighted equally: completions per attempt, yards per attempt, touchdowns per attempt, and interceptions per attempt. I will use the same formula with the same weights and the same variables, but redefine what those variables are. Here are the new definitions, with the additions in blue.

Completion percentage is now (Completions plus Scrambles) / (Pass Attempts plus Sacks plus Scrambles)

Yards per Attempt is now (Passing Yards plus Yards on Scrambles minus Sack Yards Lost) / (Pass Attempts plus Sacks plus Scrambles)

Touchdown Rate is now (Passing Touchdowns plus Touchdowns on Scrambles) / (Pass Attempts plus Sacks plus Scrambles)

Turnover Rate will replace Interception Rate in the formula, and is calculated as (Interceptions plus Fumbles Lost) / (Pass Attempts plus Sacks plus Scrambles)

The table below lists all of those metrics for the 32 quarterbacks who had enough pass attempts to qualify for the passer rating crown, along with Alex Smith and Colin Kaepernick, who just missed qualifying. Let’s look at the Robert Griffin III line.

He completed 258 of 393 pass attempts for 3200 yards, with 20 touchdowns and five interceptions. Those are the standard stats that make up passer rating, but he also took 30 sacks and lost 217 yards on those sacks. That makes Griffin’s numbers worse, but he also had 38 scrambles for 302 yards (which gets recorded as 38 completed passes for 302 yards), with no scramble touchdowns. Finally, he lost two fumbles. His new completion percentage is 64.2%, his new yards per attempt is 7.13, his new touchdown rate is 4.3%, and his turnover rate (which includes fumbles) is 1.5%. The final two columns show each quarterback’s passer rating under the normal system and their passer rating using these metrics, which I’ll call the FPPR for short.
[continue reading…]

{ 14 comments }

Correlating passing stats with wins

Which stats should be used to analyze quarterback play? That question has mystified the NFL for at least the last 80 years. In the 1930s, the NFL first used total yards gained and later completion percentage to determine the league’s top passer. Various systems emerged over the next three decades, but none of them were capable of separating the best quarterbacks from the merely very good. Finally, a special committee, headed by Don Smith of the Pro Football Hall of Fame, came up with the most complicated formula yet to grade the passers. Adopted in 1973, the NFL has used passer rating ever since to crown its ‘passing’ champion.

Nearly all football fans have issues with passer rating. Some argue that it’s hopelessly confusing; others simply think it just doesn’t work. But there are some who believe in the power of passer rating, like Cold Hard Football Facts founder Kerry Byrne. A recent post on a Cowboys fan site talked about Dallas’ need to improve their passer rating differential. Passer rating will always have supporters for one reason: it has been, is, and always will be correlated with winning. It is easy to test how closely correlated two variables are; in this case, passer rating (or any other statistic) and wins. The correlation coefficient is a measure of the linear relationship between two variables on a scale from -1 to 1. Essentially, if two variables move in the same direction, their correlation coefficient them will be close to 1. If two variables move with each other but in opposite directions (say, the temperature outside and the amount of your heating bill), the CC will be closer to -1. If the two variables have no relationship at all, the CC will be close to zero.

The table below measures the correlation coefficient of certain statistics with wins. The data consists of all quarterbacks who started at least 14 games in a season from 1990 to 2011:

CategoryCorrelation
ANY/A [1]Adjusted Net Yards per Attempt, calculated as follows: (Passing Yards + 20*Passing Touchdowns - 45*Interceptions - Sack Yards Lost) / (Pass Attempts + Sacks) 0.55
Passer Rating0.51
NY/A [2]Net Yards per attempt, which includes sack yards lost in the numerator and sacks in the denominator.0.50
Touchdown/Attempt0.44
Yards/Att0.43
Comp %0.32
Interceptions/Att-0.31
Sack Rate-0.28
Passing Yards0.16
Attempts-0.14

As you can see, passer rating is indeed correlated with wins; a correlation coefficient of 0.51 indicates a moderately strong relationship; the two variables (passer rating and wins) are clearly correlated to some degree. Interception rate is also correlated with wins; there is a ‘-‘ sign next to the correlation coefficient because of the negative relationship, but that says nothing about the strength of the relationship. As we would suspect, as interception rate increases, wins decrease. On the other hand, passing yards bears almost no relationships with wins — this is exactly what Alex Smith was talking about last month:
[continue reading…]

References

References
1 Adjusted Net Yards per Attempt, calculated as follows: (Passing Yards + 20*Passing Touchdowns - 45*Interceptions - Sack Yards Lost) / (Pass Attempts + Sacks)
2 Net Yards per attempt, which includes sack yards lost in the numerator and sacks in the denominator.
{ 43 comments }