
Yesterday, I looked at the era-adjusted leaders in completion percentage. Today, we’ll do the same thing but with yards per attempt.
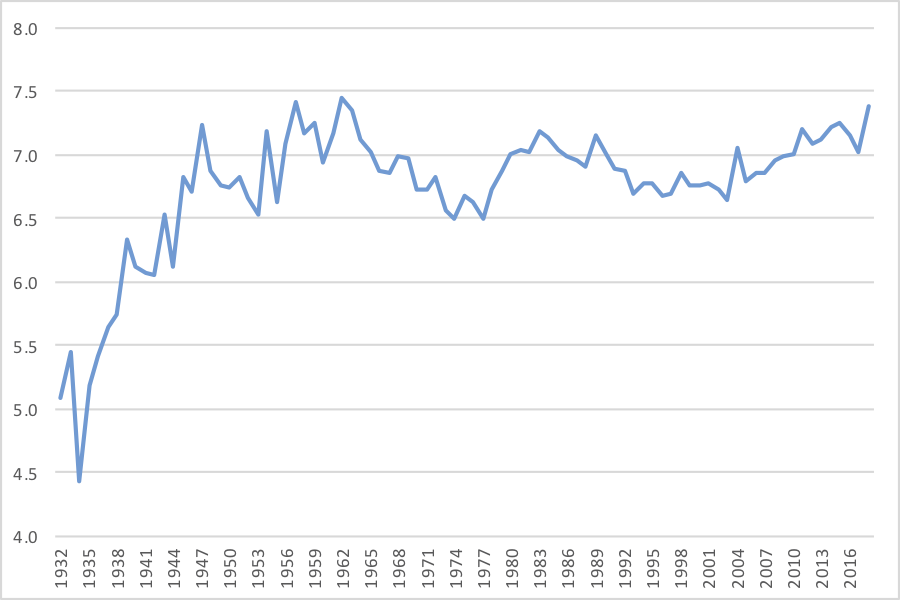
The traditional passer rating formula measures Y/A by taking a passer’s Y/A, subtracting 3.0, and dividing the result by four. This makes sense when the average Y/A is around 7.0; in that case, 7.0 minus 3.0 equals 4.0, and dividing that by 4 gives a result of 1.00. But when the average passer isn’t averaging 7.0 yards per attempt, this formula isn’t so great. The graph below shows the average Y/A for all passers since 1932:
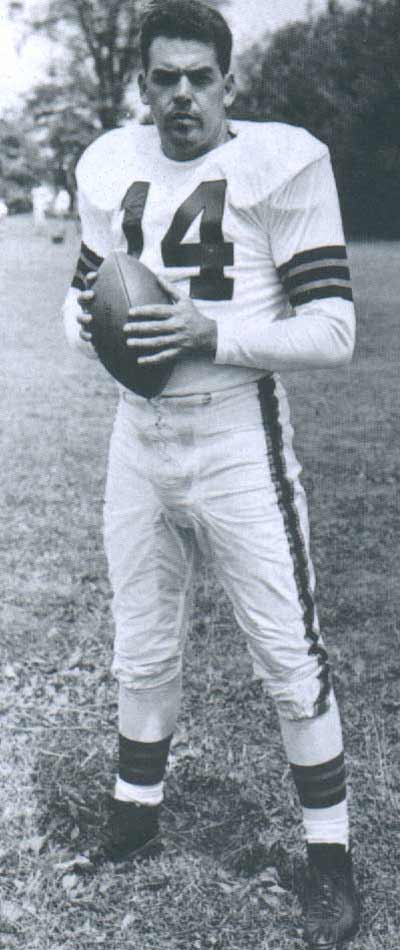
Automatic Otto.
Otto Graham and Sid Luckman were far ahead of their peers and lead this category. Norm Van Brocklin and Steve Young were extremely efficient passers who were great in this category and were dominant players. Kurt Warner, Roger Staubach, and Len Dawson were Hall of Fame passers with great stats who unsurprisingly were great at yards per attempt. The rest of the top 10 are Tony Romo, Sammy Baugh, and Trent Green, three quarterbacks you probably never put in the same sentence before. But make no mistake: Romo and Green were outstanding players in their prime who didn’t have much in the way of down years: nearly all of their pass attempts came during their prime.
The worst 10? Joey Harrington (who was great at avoiding sacks, so he would fare better in NY/A) is at the bottom of the list, followed by Kyle Boller, Mike Phipps, Rick Mirer, Mark Malone, Mike Pagel, Frank Tripucka, Jack Trudeau, Dan Pastorini, and Steve Bono (who had a great record but was not very good at moving the ball down the field).
The full results are below. Once again, I’ve also included in the final column a measure of how each passer fares in Y/A relative to the other 3 (completion percentage, touchdown rate, interception rate) components of passer rating. More on that after the jump.
| Y/A Rk | Player | Att | First Yr | Last Year | EA PR | EA PR Rk | Y/A | Y/A vs. Other3 |
|---|---|---|---|---|---|---|---|---|
| 1 | Otto Graham | 2626 | 1946 | 1955 | 95.2 | 1 | 1.53 | 0.13 |
| 2 | Sid Luckman | 1744 | 1939 | 1950 | 93.9 | 2 | 1.45 | 0.05 |
| 3 | Norm Van Brocklin | 2895 | 1949 | 1960 | 81.6 | 10 | 1.29 | 0.09 |
| 4 | Steve Young | 4149 | 1985 | 1999 | 86.5 | 5 | 1.29 | -0.01 |
| 5 | Kurt Warner | 4070 | 1998 | 2009 | 79.8 | 14 | 1.27 | 0.10 |
| 6 | Roger Staubach | 2958 | 1969 | 1979 | 84.6 | 6 | 1.25 | -0.02 |
| 7 | Len Dawson | 3741 | 1957 | 1975 | 86.6 | 4 | 1.22 | -0.10 |
| 8 | Tony Romo | 4335 | 2004 | 2016 | 79.2 | 18 | 1.21 | 0.03 |
| 9 | Sammy Baugh | 2995 | 1937 | 1952 | 92 | 3 | 1.20 | -0.23 |
| 10 | Trent Green | 3740 | 1997 | 2008 | 73 | 48 | 1.20 | 0.14 |
| 11 | Dan Fouts | 5604 | 1973 | 1987 | 75.4 | 30 | 1.19 | 0.08 |
| 12 | Ben Roethlisberger | 7168 | 2004 | 2018 | 75 | 32 | 1.19 | 0.09 |
| 13 | Peyton Manning | 9380 | 1998 | 2015 | 81 | 11 | 1.19 | -0.04 |
| 14 | Daunte Culpepper | 3199 | 1999 | 2009 | 74.1 | 39 | 1.18 | 0.10 |
| 15 | Philip Rivers | 7000 | 2004 | 2018 | 76.1 | 27 | 1.18 | 0.05 |
| 16 | Aaron Rodgers | 5492 | 2005 | 2018 | 82.9 | 8 | 1.17 | -0.09 |
| 17 | Russell Wilson | 3261 | 2012 | 2018 | 78.4 | 21 | 1.17 | -0.01 |
| 18 | Joe Namath | 3762 | 1965 | 1977 | 68.7 | 93 | 1.16 | 0.18 |
| 19 | Bart Starr | 3149 | 1956 | 1971 | 78.7 | 20 | 1.15 | -0.04 |
| 20 | Steve Grogan | 3593 | 1975 | 1990 | 65.9 | 116 | 1.15 | 0.21 |
| 21 | Bob Griese | 3429 | 1967 | 1980 | 79 | 19 | 1.15 | -0.05 |
| 22 | Drew Brees | 9783 | 2001 | 2018 | 79.4 | 17 | 1.15 | -0.06 |
| 23 | Craig Morton | 3786 | 1965 | 1982 | 72.6 | 49 | 1.14 | 0.07 |
| 24 | Earl Morrall | 2689 | 1956 | 1976 | 73.4 | 43 | 1.14 | 0.05 |
| 25 | Ken Stabler | 3793 | 1970 | 1984 | 73.3 | 45 | 1.14 | 0.06 |
| 26 | Johnny Unitas | 5186 | 1956 | 1973 | 77.2 | 23 | 1.14 | -0.02 |
| 27 | Matt Schaub | 3281 | 2004 | 2018 | 71.7 | 58 | 1.14 | 0.09 |
| 28 | Daryle Lamonica | 2601 | 1963 | 1974 | 76.5 | 26 | 1.14 | -0.01 |
| 29 | Bob Waterfield | 1617 | 1945 | 1952 | 74.6 | 35 | 1.14 | 0.02 |
| 30 | Jim Kelly | 4779 | 1986 | 1996 | 74.9 | 33 | 1.14 | 0.02 |
| 31 | Ed Brown | 1987 | 1954 | 1965 | 63.3 | 152 | 1.14 | 0.25 |
| 32 | Joe Montana | 5391 | 1979 | 1994 | 83.8 | 7 | 1.13 | -0.17 |
| 33 | Ken Anderson | 4475 | 1971 | 1986 | 79.8 | 13 | 1.13 | -0.09 |
| 34 | Lynn Dickey | 3125 | 1971 | 1985 | 66.3 | 113 | 1.13 | 0.18 |
| 35 | Tom Brady | 9375 | 2000 | 2018 | 79.7 | 15 | 1.13 | -0.09 |
| 36 | Bill Nelsen | 1905 | 1963 | 1972 | 68.9 | 90 | 1.12 | 0.11 |
| 37 | Steve Beuerlein | 3328 | 1988 | 2003 | 69.8 | 81 | 1.11 | 0.08 |
| 38 | Sonny Jurgensen | 4262 | 1957 | 1974 | 80.3 | 12 | 1.11 | -0.13 |
| 39 | Dan Marino | 8358 | 1983 | 1999 | 76.9 | 25 | 1.11 | -0.06 |
| 40 | Jameis Winston | 1922 | 2015 | 2018 | 64.7 | 135 | 1.10 | 0.18 |
| 41 | John Hadl | 4687 | 1962 | 1977 | 71 | 66 | 1.10 | 0.05 |
| 42 | Danny White | 2950 | 1976 | 1988 | 74.3 | 38 | 1.10 | -0.02 |
| 43 | Matt Ryan | 6201 | 2008 | 2018 | 74.6 | 36 | 1.10 | -0.02 |
| 44 | Kirk Cousins | 2702 | 2012 | 2018 | 72.2 | 53 | 1.10 | 0.02 |
| 45 | Terry Bradshaw | 3901 | 1970 | 1983 | 70.3 | 75 | 1.10 | 0.06 |
| 46 | Boomer Esiason | 5205 | 1984 | 1997 | 71.7 | 57 | 1.10 | 0.03 |
| 47 | Y.A. Tittle | 4395 | 1948 | 1964 | 77.8 | 22 | 1.10 | -0.10 |
| 48 | Bert Jones | 2551 | 1973 | 1982 | 77.2 | 24 | 1.09 | -0.08 |
| 49 | Chad Pennington | 2471 | 2000 | 2010 | 75.4 | 29 | 1.09 | -0.06 |
| 50 | Marc Bulger | 3171 | 2002 | 2009 | 69.8 | 82 | 1.08 | 0.05 |
| 51 | Warren Moon | 6823 | 1984 | 2000 | 71.2 | 63 | 1.08 | 0.02 |
| 52 | Fran Tarkenton | 6467 | 1961 | 1978 | 79.7 | 16 | 1.08 | -0.15 |
| 53 | Chris Chandler | 4005 | 1988 | 2004 | 68.8 | 92 | 1.08 | 0.07 |
| 54 | Eddie LeBaron | 1796 | 1952 | 1963 | 65.1 | 128 | 1.08 | 0.13 |
| 55 | Carson Palmer | 6307 | 2004 | 2017 | 69.8 | 83 | 1.08 | 0.04 |
| 56 | Marcus Mariota | 1605 | 2015 | 2018 | 66.5 | 111 | 1.07 | 0.10 |
| 57 | Frank Ryan | 2133 | 1958 | 1970 | 75.1 | 31 | 1.07 | -0.08 |
| 58 | Jake Delhomme | 2932 | 1999 | 2011 | 66.6 | 108 | 1.07 | 0.09 |
| 59 | Brett Favre | 10169 | 1991 | 2010 | 73.3 | 44 | 1.06 | -0.05 |
| 60 | Jeff Hostetler | 2338 | 1985 | 1997 | 70 | 79 | 1.06 | 0.02 |
| 61 | Bobby Layne | 3700 | 1948 | 1962 | 70.1 | 78 | 1.06 | 0.01 |
| 62 | Dave Krieg | 5311 | 1980 | 1998 | 72.3 | 51 | 1.06 | -0.03 |
| 63 | Greg Landry | 2300 | 1968 | 1984 | 73.6 | 41 | 1.06 | -0.06 |
| 64 | Phil Simms | 4647 | 1979 | 1993 | 70.6 | 72 | 1.05 | -0.01 |
| 65 | Jay Schroeder | 2808 | 1985 | 1994 | 62.9 | 154 | 1.05 | 0.14 |
| 66 | Tom Flores | 1715 | 1960 | 1969 | 73.1 | 46 | 1.05 | -0.06 |
| 67 | John Elway | 7250 | 1983 | 1998 | 70.4 | 74 | 1.05 | -0.01 |
| 68 | Jim Everett | 4923 | 1986 | 1997 | 68.8 | 91 | 1.05 | 0.02 |
| 69 | Don Meredith | 2308 | 1960 | 1968 | 71.6 | 59 | 1.05 | -0.03 |
| 70 | Neil Lomax | 3153 | 1981 | 1988 | 74.9 | 34 | 1.05 | -0.10 |
| 71 | Wade Wilson | 2428 | 1981 | 1998 | 66.9 | 105 | 1.05 | 0.06 |
| 72 | Troy Aikman | 4715 | 1989 | 2000 | 71.1 | 64 | 1.04 | -0.03 |
| 73 | Mark Rypien | 2613 | 1988 | 2001 | 69.4 | 88 | 1.04 | 0.00 |
| 74 | Jim Plunkett | 3701 | 1971 | 1986 | 65.1 | 127 | 1.04 | 0.09 |
| 75 | Jeff George | 3967 | 1990 | 2001 | 69.7 | 84 | 1.04 | 0.00 |
| 76 | Gary Danielson | 1932 | 1976 | 1988 | 71.2 | 62 | 1.04 | -0.04 |
| 77 | Jeff Garcia | 3676 | 1999 | 2009 | 74.3 | 37 | 1.04 | -0.10 |
| 78 | Brian Griese | 2796 | 1998 | 2008 | 69.6 | 86 | 1.04 | -0.01 |
| 79 | Rodney Peete | 2346 | 1989 | 2004 | 62.3 | 156 | 1.04 | 0.14 |
| 80 | Mark Brunell | 4640 | 1994 | 2011 | 71.9 | 56 | 1.04 | -0.06 |
| 81 | Cam Newton | 3892 | 2011 | 2018 | 65.1 | 129 | 1.04 | 0.08 |
| 82 | Jay Fiedler | 1717 | 1995 | 2005 | 64.8 | 134 | 1.03 | 0.08 |
| 83 | Charley Johnson | 3392 | 1961 | 1975 | 67 | 104 | 1.03 | 0.04 |
| 84 | Jack Kemp | 3073 | 1957 | 1969 | 62.2 | 157 | 1.03 | 0.13 |
| 85 | Steve McNair | 4544 | 1995 | 2007 | 70.3 | 77 | 1.03 | -0.04 |
| 86 | Elvis Grbac | 2445 | 1994 | 2001 | 68.5 | 94 | 1.03 | 0.00 |
| 87 | Charlie Batch | 1604 | 1998 | 2012 | 65.1 | 126 | 1.03 | 0.06 |
| 88 | Billy Kilmer | 2984 | 1961 | 1978 | 72.3 | 50 | 1.02 | -0.08 |
| 89 | Gus Frerotte | 3106 | 1994 | 2008 | 61.9 | 159 | 1.02 | 0.12 |
| 90 | David Garrard | 2281 | 2002 | 2010 | 69.9 | 80 | 1.02 | -0.03 |
| 91 | Colin Kaepernick | 1692 | 2011 | 2016 | 67.6 | 99 | 1.02 | 0.01 |
| 92 | Jay Cutler | 4920 | 2006 | 2017 | 66.5 | 109 | 1.02 | 0.03 |
| 93 | Randall Cunningham | 4289 | 1985 | 2001 | 72.1 | 54 | 1.02 | -0.08 |
| 94 | Bobby Hebert | 3121 | 1985 | 1996 | 69.4 | 87 | 1.02 | -0.03 |
| 95 | Donovan McNabb | 5374 | 1999 | 2011 | 71.3 | 61 | 1.02 | -0.07 |
| 96 | Jim McMahon | 2573 | 1982 | 1996 | 69.7 | 85 | 1.02 | -0.04 |
| 97 | Tony Eason | 1564 | 1983 | 1990 | 71.5 | 60 | 1.02 | -0.08 |
| 98 | Stan Humphries | 2516 | 1989 | 1997 | 65.2 | 124 | 1.02 | 0.05 |
| 99 | Vinny Testaverde | 6701 | 1987 | 2007 | 64 | 143 | 1.01 | 0.07 |
| 100 | Jim Hart | 5076 | 1966 | 1984 | 66.1 | 114 | 1.01 | 0.03 |
| 101 | Bill Kenney | 2430 | 1980 | 1988 | 69.1 | 89 | 1.01 | -0.03 |
| 102 | Aaron Brooks | 2963 | 2000 | 2006 | 65.2 | 123 | 1.01 | 0.04 |
| 103 | Rich Gannon | 4206 | 1987 | 2004 | 73.5 | 42 | 1.01 | -0.12 |
| 104 | Steve Bartkowski | 3456 | 1975 | 1986 | 70.7 | 71 | 1.01 | -0.07 |
| 105 | Joe Theismann | 3602 | 1974 | 1985 | 72.3 | 52 | 1.01 | -0.10 |
| 106 | Doug Flutie | 2151 | 1986 | 2005 | 65.6 | 120 | 1.01 | 0.03 |
| 107 | Michael Vick | 3217 | 2001 | 2015 | 64.3 | 141 | 1.01 | 0.06 |
| 108 | Mike Tomczak | 2337 | 1985 | 1999 | 59.9 | 171 | 1.00 | 0.14 |
| 109 | Babe Parilli | 3330 | 1952 | 1969 | 65.7 | 119 | 1.00 | 0.02 |
| 110 | Andy Dalton | 3921 | 2011 | 2018 | 67.7 | 97 | 1.00 | -0.02 |
| 111 | Brian Sipe | 3439 | 1974 | 1983 | 70.9 | 67 | 1.00 | -0.08 |
| 112 | Andrew Luck | 3290 | 2012 | 2018 | 67.5 | 100 | 1.00 | -0.02 |
| 113 | Billy Wade | 2523 | 1954 | 1966 | 70.8 | 69 | 1.00 | -0.09 |
| 114 | Norm Snead | 4353 | 1961 | 1976 | 63.5 | 150 | 1.00 | 0.06 |
| 115 | Frankie Albert | 1564 | 1946 | 1952 | 81.8 | 9 | 1.00 | -0.31 |
| 116 | Richard Todd | 2967 | 1976 | 1985 | 62.4 | 155 | 1.00 | 0.08 |
| 117 | Ken O'Brien | 3602 | 1984 | 1993 | 72 | 55 | 1.00 | -0.11 |
| 118 | Charlie Conerly | 2833 | 1948 | 1961 | 75.7 | 28 | 0.99 | -0.19 |
| 119 | Matthew Stafford | 5405 | 2009 | 2018 | 67.7 | 98 | 0.99 | -0.03 |
| 120 | Jeff Blake | 3241 | 1992 | 2005 | 66.5 | 110 | 0.99 | -0.01 |
| 121 | Vince Ferragamo | 1615 | 1977 | 1986 | 63.6 | 149 | 0.99 | 0.05 |
| 122 | Brad Johnson | 4326 | 1994 | 2008 | 70.4 | 73 | 0.99 | -0.09 |
| 123 | Bernie Kosar | 3365 | 1985 | 1996 | 73 | 47 | 0.99 | -0.14 |
| 124 | Scott Mitchell | 2346 | 1991 | 2001 | 64.6 | 137 | 0.99 | 0.03 |
| 125 | Eli Manning | 7972 | 2004 | 2018 | 65.2 | 125 | 0.99 | 0.02 |
| 126 | Matt Hasselbeck | 5330 | 1999 | 2015 | 66.8 | 106 | 0.99 | -0.02 |
| 127 | Neil O'Donnell | 3229 | 1991 | 2003 | 71.1 | 65 | 0.99 | -0.11 |
| 128 | John Brodie | 4491 | 1957 | 1973 | 70.9 | 68 | 0.98 | -0.11 |
| 129 | George Blanda | 4007 | 1949 | 1975 | 67.4 | 101 | 0.98 | -0.04 |
| 130 | Jake Plummer | 4350 | 1997 | 2006 | 62 | 158 | 0.98 | 0.07 |
| 131 | Milt Plum | 2419 | 1957 | 1969 | 70.7 | 70 | 0.98 | -0.11 |
| 132 | Jon Kitna | 4442 | 1997 | 2011 | 64.3 | 139 | 0.97 | 0.01 |
| 133 | Jim Harbaugh | 3918 | 1987 | 2000 | 67.3 | 102 | 0.97 | -0.05 |
| 134 | Ron Jaworski | 4117 | 1974 | 1989 | 67.8 | 95 | 0.97 | -0.06 |
| 135 | Erik Kramer | 2299 | 1987 | 1999 | 65.8 | 118 | 0.97 | -0.02 |
| 136 | Cotton Davidson | 1752 | 1954 | 1968 | 60.5 | 168 | 0.97 | 0.08 |
| 137 | Drew Bledsoe | 6717 | 1993 | 2006 | 65.1 | 130 | 0.97 | -0.01 |
| 138 | Nick Foles | 1581 | 2012 | 2018 | 66.7 | 107 | 0.97 | -0.04 |
| 139 | Marc Wilson | 2081 | 1980 | 1990 | 59.5 | 173 | 0.97 | 0.10 |
| 140 | Eric Hipple | 1546 | 1980 | 1989 | 61.6 | 161 | 0.97 | 0.06 |
| 141 | Steve DeBerg | 5024 | 1978 | 1998 | 67.3 | 103 | 0.96 | -0.06 |
| 142 | Jim Zorn | 3149 | 1976 | 1987 | 64 | 144 | 0.96 | 0.00 |
| 143 | Ryan Tannehill | 2911 | 2012 | 2018 | 65.3 | 122 | 0.96 | -0.03 |
| 144 | Doug Williams | 2507 | 1978 | 1989 | 63.7 | 148 | 0.96 | 0.00 |
| 145 | Alex Smith | 4941 | 2005 | 2018 | 67.8 | 96 | 0.95 | -0.09 |
| 146 | Tommy Kramer | 3651 | 1977 | 1990 | 66.4 | 112 | 0.95 | -0.06 |
| 147 | Mike Livingston | 1751 | 1968 | 1979 | 65.1 | 131 | 0.95 | -0.04 |
| 148 | Archie Manning | 3642 | 1971 | 1984 | 66 | 115 | 0.94 | -0.06 |
| 149 | Chris Miller | 2892 | 1987 | 1999 | 65.4 | 121 | 0.94 | -0.05 |
| 150 | Tim Couch | 1714 | 1999 | 2003 | 63.2 | 153 | 0.94 | -0.01 |
| 151 | Tony Banks | 2356 | 1996 | 2005 | 61.4 | 162 | 0.94 | 0.02 |
| 152 | Ryan Fitzpatrick | 4285 | 2005 | 2018 | 61.3 | 163 | 0.93 | 0.02 |
| 153 | Kerry Collins | 6261 | 1995 | 2011 | 60.6 | 167 | 0.93 | 0.03 |
| 154 | Joe Ferguson | 4519 | 1973 | 1990 | 65 | 132 | 0.93 | -0.06 |
| 155 | Byron Leftwich | 1605 | 2003 | 2012 | 64.5 | 138 | 0.93 | -0.06 |
| 156 | Trent Dilfer | 3172 | 1994 | 2007 | 58.2 | 175 | 0.93 | 0.07 |
| 157 | Don Majkowski | 1905 | 1987 | 1996 | 63.9 | 147 | 0.92 | -0.04 |
| 158 | Josh McCown | 2628 | 2002 | 2018 | 61 | 165 | 0.92 | 0.01 |
| 159 | Josh Freeman | 2048 | 2009 | 2015 | 59.8 | 172 | 0.92 | 0.03 |
| 160 | Jason Campbell | 2518 | 2006 | 2014 | 64.9 | 133 | 0.92 | -0.07 |
| 161 | Case Keenum | 1844 | 2012 | 2018 | 61.7 | 160 | 0.92 | -0.01 |
| 162 | Roman Gabriel | 4498 | 1962 | 1977 | 73.6 | 40 | 0.91 | -0.25 |
| 163 | Kyle Orton | 2712 | 2005 | 2014 | 63.9 | 146 | 0.91 | -0.06 |
| 164 | Bubby Brister | 2212 | 1986 | 2000 | 63.5 | 151 | 0.91 | -0.06 |
| 165 | Joe Flacco | 5670 | 2008 | 2018 | 64.1 | 142 | 0.91 | -0.07 |
| 166 | Bill Munson | 1982 | 1964 | 1979 | 70.3 | 76 | 0.90 | -0.20 |
| 167 | Rex Grossman | 1562 | 2003 | 2012 | 55.8 | 180 | 0.89 | 0.08 |
| 168 | Chad Henne | 1959 | 2008 | 2018 | 57.5 | 177 | 0.89 | 0.04 |
| 169 | David Carr | 2267 | 2002 | 2012 | 60.7 | 166 | 0.89 | -0.03 |
| 170 | Dave Brown | 1634 | 1992 | 2001 | 56.6 | 179 | 0.88 | 0.05 |
| 171 | Derek Anderson | 1674 | 2006 | 2018 | 53.6 | 187 | 0.88 | 0.10 |
| 172 | Tobin Rote | 2907 | 1950 | 1966 | 63.9 | 145 | 0.88 | -0.11 |
| 173 | Mark Sanchez | 2320 | 2009 | 2018 | 54.9 | 185 | 0.88 | 0.07 |
| 174 | Blake Bortles | 2632 | 2014 | 2018 | 57.8 | 176 | 0.88 | 0.02 |
| 175 | Kordell Stewart | 2358 | 1995 | 2005 | 59.2 | 174 | 0.88 | -0.02 |
| 176 | Derek Carr | 2800 | 2014 | 2018 | 65.8 | 117 | 0.87 | -0.15 |
| 177 | Matt Cassel | 2684 | 2005 | 2018 | 60.4 | 169 | 0.87 | -0.05 |
| 178 | Billy Joe Tolliver | 1707 | 1989 | 1999 | 57.3 | 178 | 0.86 | 0.00 |
| 179 | Sam Bradford | 2967 | 2010 | 2018 | 64.3 | 140 | 0.86 | -0.15 |
| 180 | Steve Bono | 1701 | 1985 | 1999 | 64.7 | 136 | 0.84 | -0.17 |
| 181 | Dan Pastorini | 3055 | 1971 | 1983 | 59.9 | 170 | 0.84 | -0.08 |
| 182 | Jack Trudeau | 1644 | 1986 | 1995 | 55.1 | 183 | 0.82 | -0.01 |
| 183 | Frank Tripucka | 1745 | 1949 | 1963 | 61.3 | 164 | 0.80 | -0.16 |
| 184 | Mike Pagel | 1509 | 1982 | 1993 | 55.3 | 182 | 0.79 | -0.05 |
| 185 | Mark Malone | 1648 | 1980 | 1989 | 54.3 | 186 | 0.79 | -0.03 |
| 186 | Rick Mirer | 2043 | 1993 | 2003 | 52.4 | 189 | 0.78 | 0.00 |
| 187 | Mike Phipps | 1799 | 1970 | 1981 | 53.2 | 188 | 0.78 | -0.02 |
| 188 | Kyle Boller | 1519 | 2003 | 2011 | 55.1 | 184 | 0.75 | -0.11 |
| 189 | Joey Harrington | 2538 | 2002 | 2007 | 55.3 | 181 | 0.74 | -0.11 |
Yards per Attempt stars
If you sort the table by the final column, who are the yards/attempt stars — i.e., the players who fare notably better in Y/A than, on average, they do in Cmp%/TD%/INT%?
Regular readers remember that Ed Brown is the career leader in yards per completion. He didn’t have a good completion percentage, threw a ton of interceptions, and wasn’t a good quarterback, but man could he sling it down the field (often to Harlon Hill). His remarkable Y/C average gives him a very good Y/A average even with a poor completion percentage, so Brown is the biggest outlier here. Did you know: Ed Brown has a better career yards/attempt average than Aaron Rodgers?
Steve Grogan, Lynn Dickey, and Jameis Winston are the next three passers who are Y/A superstars; Grogan and Winston have a similar but muted version of Brown’s story. Both Grogan and Winston were well below league average in completion percentage but well above league average in yards per attempt, thanks to typically top of the league level yards/completion averages. Dickey has a big interception problem, and he’s probably more thought of as an INT outlier than a Y/A outlier: he was above average in both TD% and CMP%, but his INT rate dragged down the averages of his non-Y/A components. The same could be said about Jay Schroeder, but his awful stat was completion percentage.
Rounding out this group is Joe Namath, who really excelled at net yards per attempt. Namath was remarkably efficient at getting the ball down the field — he lapped the field in this metric for a decade — and has one of the greatest sack rates and NY/A averages of all time. But his average TD% and poor INT% levels drag him out of the inner circle of HOF QBs.
Yards per Attempt underachievers
What about those QBs whose worst metric was Y/A? Frankie Albert was perfectly average when it came to Y/A, but had outstanding completion percentage, TD%, and INT% numbers. In that way, he was like a rich man’s Derek Carr or Sam Bradford — players with strong completion percentage and interception rate numbers, but struggled to get the ball down the field. The difference is Albert also had a stellar TD rate on top of excelling at the game manager stats.
Roman Gabriel is the second biggest outlier, but he’s really an INT% outlier; more on him later. Sammy Baugh is similar: he had historically great completion percentage and interception rate numbers, and then merely “great” TD% and yards/attempt numbers.
Seeing Joe Montana on there was a bit surprising to me, but like Baugh, yards/attempt just happens to be his worst metric. In the 1980s, he and Ken Anderson were well ahead of the entire league in completion percentage, and Montana also ranked 2nd in INT rate and in the top 5 of 34 qualifying passers in TD rate. But yards/attempt? Montana ranked “only” 5th, a hair behind Grogan. Montana was about as dominant as it gets, but yards/attempt was not his category.
What stands out to you?