by Chase Stuart
on September 2, 2013

Fast and Faster.
The number one storyline in the NFL in week one isn’t the health of
Robert Griffin III, but the presence of two other men occupying FedEx Field that night. The football world is anxiously awaiting to see how
Chip Kelly’s offense, piloted by
Michael Vick, will work in the NFL. We don’t know much, but we do know that the coach plans to incorporate the fast-paced, up-tempo style that
his teams used at Oregon to obliterate opponents.
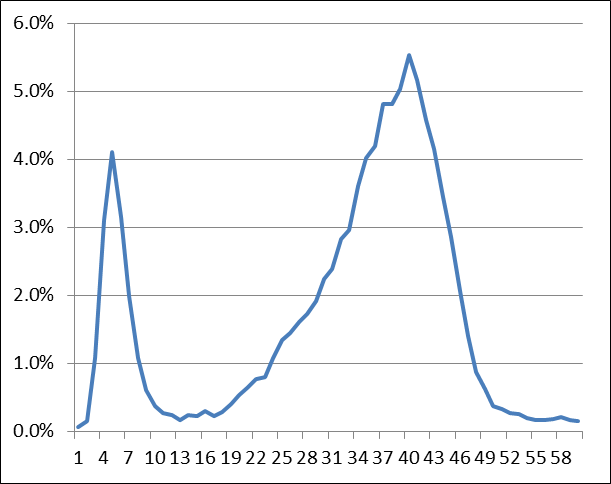
In May, I took a stab at discussing tempo in the NFL, and I presented a couple of lists that measured the number of plays run per second of possession in the NFL. Today, I want to revisit the questions of tempo and pace using more precise measurements. Let’s start with some league-wide data. The table below shows the average number of seconds between snaps for NFL teams last season. I’ve excluded a number of plays from this sample, including all plays at the start of a quarter, all overtime plays, plays after a changes of possession, and plays in the final three minutes of the first half or five minutes of the second half (where teams are less likely to operate at their normal pace).
[continue reading…]
Tagged as:
Chip Kelly,
Eagles,
Michael Vick,
RPO 2013,
Tempo
{ }
by Chase Stuart
on June 8, 2013
In light of the Patriots nearly breaking the NFL record for plays, and the promise of up-tempo offenses in Philadelphia (under Chip Kelly) and Denver (Adam Gase), it’s easy to think that the number of plays run per team is about to reach historic levels. But that seems really unlikely.
The graph below shows the number of plays run per team game for each season since 1950. The total number of plays run is in blue for the NFL; I also added the same data for the AFL in red. As you can see, the number of plays per team game has been relatively steady over the last 64 years, but the high-water marks were the early ’50s and most of the 1980s.
In addition to plays run, the graph also shows:
- The number of rushing plays per team game in green, a number that’s obviously on the decline.
- The number of completions per team game in black, which has risen as the number of runs has declined.
- The number of incomplete passes per team game in orange. Incomplete passes stop the clock, so I thought we might see something interesting there. How’s this for trivia: there were 13.5 incomplete passes per team game in 2012, the same number that existed in 1948! While 1948 is off the graph, you can see that the number of incomplete passes per game has been remarkably consistent throughout NFL history. In fact, the average from 1950 to 2012 is 13.5 incompletions per game, and the league average was 13.5 +/- one incompletion in over 80% of the seasons since 1950.
- The number of sacks per team game is in purple, a number that has also stayed very consistent over time. Only three times since 1950 has the league average been less than two sacks per game or more than three sacks per game.

Tagged as:
Tempo
{ }
by Chase Stuart
on May 13, 2013
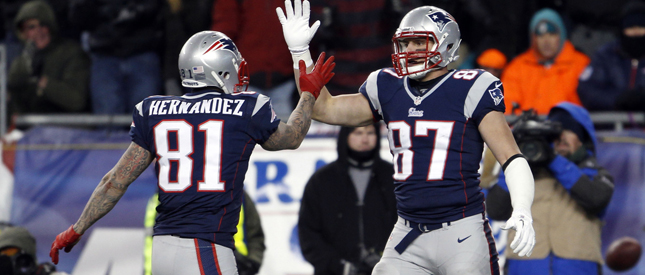
Gronkowski and Hernandez can rest after they score.
It’s no secret that
Bill Belichick’s Patriots ran an
up-tempo offense last year:
Tom Brady and crew ran 1,191 offensive plays in 2012, just eight shy of tying the record set by the
Drew Bledsoe Patriots in 1994. With versatile players like
Aaron Hernandez,
Rob Gronkowski, and
Danny Woodhead, New England was capable of running out of multiple formations without changing personnel and uses that flexibility to prevent defenses from substituting players based on down and distance. As a result, New England ran 31 more plays than any other team and 101 more plays than any other team that had a positive
Game Scripts average. We would expect some teams with negative Game Scripts — especially when they have
Matthew Stafford and
Andrew Luck — to run a lot of plays late in games as they play catch up, which makes the Patriots’ offensive play numbers even more impressive.
New England ran an offensive play every 24.9 seconds, the highest rate in the league. The Saints were second at 26.1, which makes sense: New Orleans also has an MVP quarterback and versatile weapons at tight end (Jimmy Graham) and running back (Darren Sproles). You might be a little surprised to see Joe Flacco’s Ravens come in at #3 in play tempo, but the Ravens finished in the bottom five last year in time of possession. The Eagles will be running a high-octane offense under Chip Kelly in 2013, but Philadelphia already ranked fourth in tempo last year.
Here’s how to read the table below. In 2012, the Patriots ranked 1st in tempo (i.e., seconds per play). New England had an average Time of Possession of 30:56 and ran 1,191 offensive plays, an average of one play every 24.9 seconds. The Patriots Game Script average was 7.7, and New England ran 21.3% of their plays in the 1st quarter, 24.9% in the 2nd quarter, 27% in the 3rd quarter, 25.8% in the 4th quarter, and 0.9% in overtime.
[continue reading…]
Tagged as:
Game Scripts,
Tempo
{ }