
Last Tuesday, James “Four Touchdowns” Hanson posted a great article on the support that Peyton Manning, Tom Brady, Drew Brees and Aaron Rodgers have enjoyed throughout their careers. Two days later, he posted Part 2, and both articles were extremely well-received. Today is the third part in his series. As always, we thank our guest posters for contributing. What follows are James’ words.
Elite Quarterbacks: Measuring Team Support by Wins & Losses
Last time, I took a look at the overall support received by four elite quarterbacks – Peyton Manning, Tom Brady, Drew Brees and Aaron Rodgers – throughout the course of their careers.
In this article we see how that support – and their performances – varies during wins and losses separately. Why separately? Well, I got the idea in 2014…
After another MVP caliber start to the 2014 season, something seemed off about Manning’s quarterback play by the middle of the season. This of course caused Broncos fans to discuss whether they were a still Super Bowl contender if Peyton Manning that wasn’t 100% — and one fan brought up the fact that up to that point with Denver (early November 2014), the Broncos had not won a game when Manning’s passer rating dipped below 90. If Manning dared to be anything less than elite, the Broncos lost.
So how could Denver fans expect their running game and defense to pick up the slack for a lesser Manning when they hadn’t been able to so far? As we now know, the Broncos would go on to show they could pick up the slack for a faltering Manning to a degree beyond anyone’s wildest dreams, with him claiming the dubious “honor” of being considered the worst Super Bowl quarterback of all time based on his 2015 metrics.
Still, the idea intrigued me – if a team still wins despite their quarterback playing a subpar game, doesn’t that indicate positive team support? After all, Manning played the worst season of his life in 2015 and finally came away with his second Super Bowl ring, so there is something to the idea.
It also occurred to me that the inverse could also be intriguing – when a team loses despite their quarterback playing a great game by passing metrics can indicate team poor support.
So what qualifies as a “great” and a “mediocre” game for a passer?
Winning While Playing Poorly, Losing While Playing Well
At least in terms of metrics, of course. There’s only so much we can learn without turning on the game film. It was a tough decision but I ultimately decided on a couple numbers based on the following logic, with an eye on keeping things as simple and clear cut as possible – I didn’t want anyone thinking I selected an overly specific number to favor or disadvantage a particular player.
Relative ANY/A
I went with RANY/A, instead of straight ANY/A, since it intrinsically is a measure of how well a passer played above his peers. As an example, an ANY/A rate of 6.2 would be excellent in 2003 – but merely league average in 2016.
It was easy for me to determine a “mediocre” Relative ANY/A score – by definition, any RANY/A grade below 0.00 is below average, so that was a no-brainer.
What a “great” RANY/A score was a bit more difficult. In the end, I just decided to keep things simple with round numbers and 1.00 based on this analysis which provided that “for every 1.00 ANY/A above league average, a team should expect to win 1.756 more games.” If an RANY/A above 1.00 is worth nearly two wins, that sounds pretty elite to me, so I decided to roll with it.
Passer Rating
I decided to make things simple for myself and came up with the idea of a Relative Passer Rating (rPR) because of the same rise in averages we see with ANY/A since 1998 (the beginning of Manning’s career, the oldest player included in this study). The rate that year was 78.6, making a passer rating of 85.0 well above average that year – but in 2016, the average rate is 87.5, making that same exact rate below average last season.
So again, any rPR below 0.00 is automatically mediocre by the nature of it being below average. As for a “great” passer rating – to keep things simple, I decided that an rPR of +12.0 and above would be considered a great performance. Why 12.0? Well, I originally thought about making it 10.0, but as said, the rating in 1998 was 78.6, so a rate ten points above that would be 88.6… and well, it doesn’t feel right to call a rate below 90.0 “great” for a modern passer, even when the average is 78.6. And when you consider the average rPR of these four QBs as hovering around 15 (with Rodgers at nearly 20!), I think 12.0 sounds about right.
Expected Points
Finally, we have expected points. Again, the bad game criteria is easy – if you’re generating negative EP, you’re actively hurting your team’s margin of victory, so setting it at 0.00 Expected Points or less makes sense.
A great performance is a bit tricky, but in the end I decided to settle on the most common margin of victory in the NFL – 3.00 expected points. Remember, EP applies to the margin of victory, so while this might not seem like a lot, it’s actually a pretty solid threshold. And just to put it to the test, I ran the numbers when generating 3 EP and the average for all four players is a 111.7 passer rating and 8.74 ANY/A – pretty elite numbers.
So with our criteria in place, we can begin –
Wins with Mediocre Passing Stats
First off, we should take a look at each QB’s average statistical output when his team wins a game, just to get a clear picture of what that looks like. The blue indicates a leader in that category while the red indicates the last place finisher in that category. As with my previous article, since Manning is the only one of the four to have undergone a career-ending season, I have placed his pre-2015 numbers in parenthesis next to his actual career averages (but they aren’t considered for this study).
Please note: The metrics here and throughout the remainder of this article represent an average of all games played rather than total career efficiency. For example, ANY/A is calculated from the average ANY/A earned in each game rather than taking each passer’s total career metrics and calculating total career ANY/A. I feel that for the purposes of this study, which is focused on wins and metrics from individual wins and losses, this approach makes the most sense – you get a greater feel for how many good and bad games each player has played.
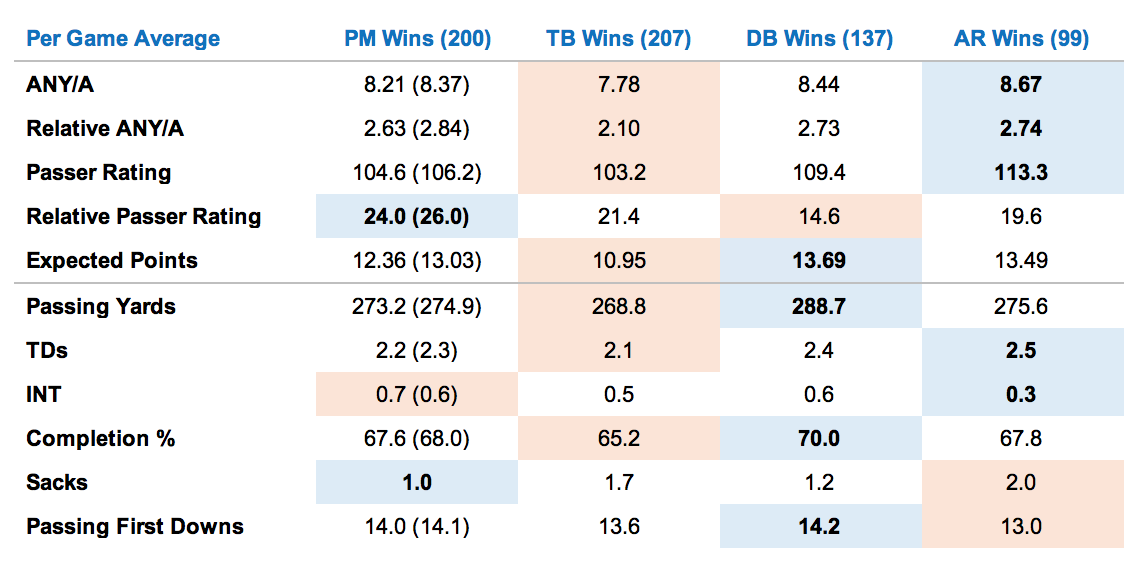
Overall, each player has played very well during wins, contributing a lot to their teams’ success – hence their elite status. You can’t say any of the numbers are poor but it looks like Aaron Rodgers takes the lead in most categories, while Brady is in last place in most categories. If we’re justifying his far higher win percentage on him playing at a higher level than the other passers, we can’t see it in the stats.
That said, he still plays at an elite, Hall of Fame level in his wins, as do the others. But what happens when these passers have a bad game? How often do their teams rally behind them and pick up the slack?
Let’s get down to it. Below we have the averages of each quarterback’s mediocre passing games by Relative ANY/A, Passer Rating and Expected Points. The table starts with the number of bad games each player has had throughout their careers represented as a percentage and what their team’s win record was during those games overall and in the playoffs. I’ve greyed out Drew Brees playoff win percentages because he only has one game and while we go in knowing that analyzing the playoffs from a statistical perspective is problematic due to the small sample size, one game is just too small a number to consider.
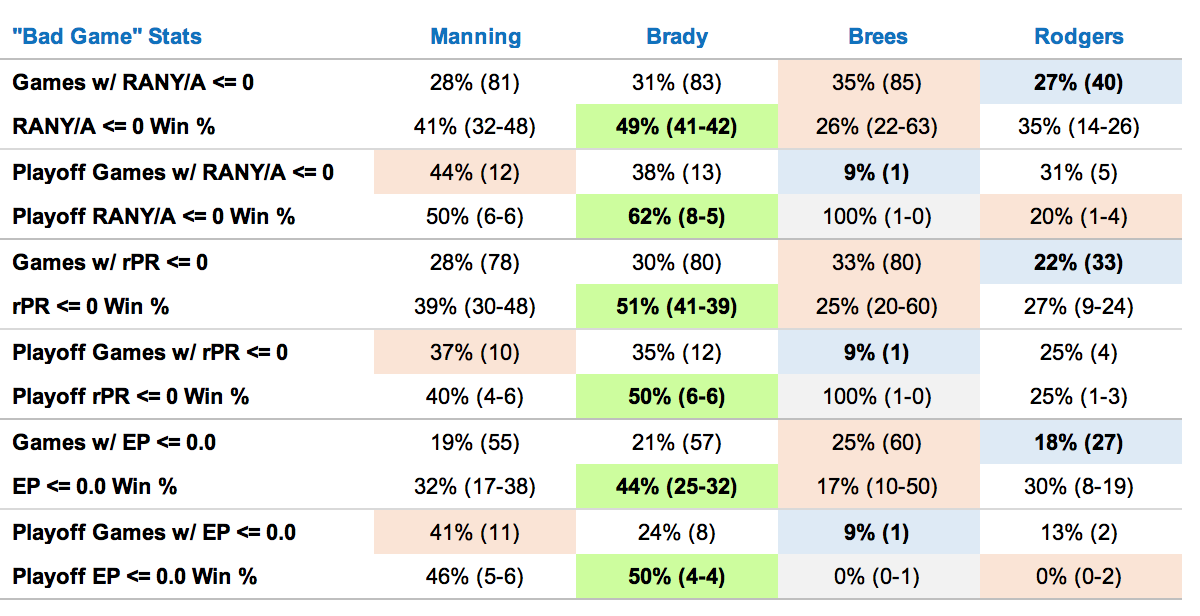
No surprises here if you’ve read the previous article – Rodgers takes the overall lead in QB performance, coming in with the fewest bad games across all metrics, followed by Peyton Manning, Tom Brady and then Drew Brees. In the playoffs, Drew Brees takes the playoff lead as he’s only had one bad game by the numbers, followed by Rodgers, Brady and then Manning.
Across the board, Tom Brady has won the most games while putting in a poor performance, sometimes by massive margins. If you look at the actual number of poor games across all three metrics, Drew Brees has a similar number of poor performances – but Brady has about double the wins across the board. When you look at these numbers, you can see that Peyton Manning has actually had very good support in his bad games when compared to Rodgers and especially Brees; it’s just not the otherworldly support that Belichick and company provided Brady with. Brady wins about half of his bad games and is at least 8 percentage points higher in every category than second place Peyton Manning.
Again, there’s nothing we can see in Brady’s own stats that we can see that would explain such a dramatically higher win percentage. If you go back up to the “passing stats in a win” table above and their overall career stats from my previous article, Brees has outperformed Brady in almost every category except for relative passer rating and interceptions per game, where he’s a fraction of a percent behind Brady. He’s ahead of Brady in efficiency ratings and provided more EP per game in his teams’ wins. Yet Brady boasts over double the win percentage when they have a bad game – to me, that looks like he’s enjoyed far greater support than Brees and the other two passers in the study when they have a bad performance.
Losses with Great Passing Stats
If winning while playing poorly indicates great team support, surely losing while playing well indicates poor team support? I think so.
As before, I figured we should take a look at each QB’s stats when his team loses a game. The blue indicates a leader in that category while the red indicates the last place finisher in that category. Unlike the previous section, we won’t be including Manning’s pre-2015 numbers here – thanks to the phenomenal support he had that year, he only lost two games he started that season despite playing horribly, so those games don’t impact his numbers as much as his wins and overall career production.
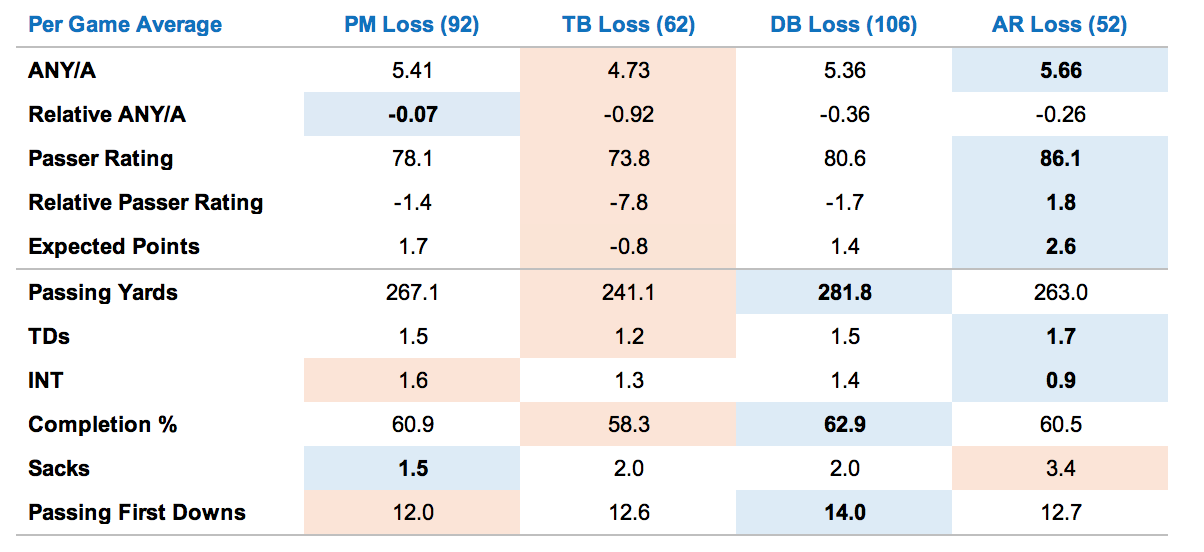
Again, nothing too shocking here – except that unlike the others, Aaron Rodgers numbers are actually still above average even in a loss! He leads most passing categories, while Brady comes in last in the most categories.
When contrasted with the stats during wins, he can see that there is definitely a high correlation between quarterback performance and wins – when they play poorly, they lose more often; and when they play well, they win more often. More often – but not always.
It’s something all of these quarterbacks have had to deal with – playing well enough to win but losing anyway (and sometimes being blamed for that loss, like Matt Ryan in Super Bowl 51). But how often have they had to deal with it? Well, some deal with it more than others…

Here, the trends stay mostly consistent with everything we’ve seen before. Aaron Rodgers has the greatest number of good performances in most categories with a few exceptions – he’s tied with Peyton Manning for the most games with a RANY/A above 3.00, while Brees has a higher percentage of playoff games with a rPR above 12.0, and Brady has more playoff games with 3.00 Expected Points or more.
On the flip side, Brady has the lowest percentage of games with RANY/A and rPR above the thresholds while Brees has the lowest number of +3.00 EP games. In the playoffs, Peyton Manning has the fewest great RANY/A and rPR games while Drew Brees has the fewest games with EP above 3.00.
But again, the winning stats seem to tell a different narrative – at least if you think great QB performances equal wins. The Patriots almost never lose if their QB plays a great game. The only one with a higher win percentage is Aaron Rodgers when he has +3.00 RANY/A in the playoffs – otherwise, Brady’s teams dominate the win percentages by a huge margin.
Overall, it seems that Brees’ teams have lost the most when he’s played well while in the postseason, Peyton Manning’s teams have lost the most when he’s played well. While Manning has won a fair amount of games in bad playoff performances, he also has lost more games when he’s had great playoff performances – going by the numbers, it looks like Manning has performed poorly in the playoffs but his teams have also let him down in the playoffs as well outside of the 2006 and 2015 post-seasons.
Rewriting History: Fun with Expected Points
The nature of EP and its relationship to the margin of victory and defeat allows us to have a little fun and play “what if” based on the numbers above. As explained in the previous column, Expected Points represent “the contributions each team’s various squads made to the margin of victory.” Those last few words are key; EP are applicable to the margin of victory – or defeat.
Now keep in mind – this is just for fun and doesn’t represent a serious look into the numbers as all the work to this point does.
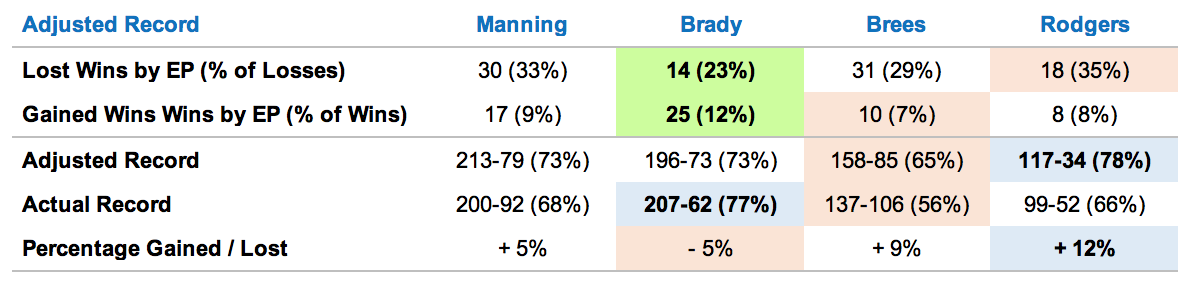
The first idea I had is a stat I call “Lost Wins”. It occurred to me that if the QB’s passing EP output was one point greater than the margin of a loss, you could say that it’s a game the QB should have won – hence the label “Lost Wins”.
On the other hand, you could also say that any win the QB had with zero or negative Expected Points generated by the passing game is a situation in which the QB was carried to that win. After all, if he isn’t generating any points toward the margin of victory or actually costing the team points, he isn’t really contributing to that win – so I’ll call this number “Gained Wins”.
And if you add “Lost Wins” and subtract “Gained Wins” from a QB’s record, you can see what his “earned” record would be going by EP.
Again – not scientific, just for fun. As mentioned, stats by their very nature only tell part of the story and all of these passers have had games where a bad performance was caused more by pass protection, poor WR play and/or poor play-calling than their own efforts. That said…
In Conclusion
So what have we seen? In terms of overall team support, we saw that Drew Brees played at a comparable level to the other three quarterbacks but suffered the worst support among the three – this was evident in both his win percentages and all defensive stats measured. He’s only had one bad playoff game, earning 7.58 ANY/A and a 101.1 passer rating, but has a 55% win percentage to show for it. People may criticize him for his teams missing the playoffs so many times, but his career passer rating, ANY/A and Expected Points averages nearly mirror Tom Brady’s – so I’m not sure much of that blame can be laid at his feet.
Aaron Rodgers was the leader on passing stats across the most categories, both in the regular season and post-season – sometimes by a substantial margin – but while his overall win percentage was 10 points higher than Brees, it was still behind Peyton Manning and far behind Tom Brady. And while his playoff averages were behind Brees, they were still substantially better than both Manning and Brady – with only a 56% win percentage to show for it. By the passing numbers, he’s consistently the best performing quarterback of the four but this isn’t represented in his win percentage.
Peyton Manning tended to hover between second and third in most passing stat categories overall and enjoyed the second highest overall win percentage overall. However, he played at a far lesser rate on average in the playoffs, even when taking out his 2015 numbers. He also enjoyed better playoff support on average than both Rodgers and Brees (though still far behind Brady’s support), though those numbers were skewed by the 2006 and 2015 post-seasons, where he enjoyed incredible playoff support – like Tom Brady, he’s only lost two games with positive team support behind him.
And just going by the metrics observed over my last two articles, Tom Brady has received the most support from his running game, special teams, and defense by a large margin. He’s received the most overall support, the most support while playing poorly, and the most support while playing well. Additionally, while his numbers were on par with the other three, we didn’t see anything to indicate that he played better to justify having such a higher win percentage across almost all categories.
That said, it doesn’t mean he’s any less of a quarterback than the others. In fact, I wonder if his career metrics have been affected by having such great support – he hasn’t been forced to create unnecessary volume as often as the other guys because his teams don’t blow leads and put him in bad positions as often as the rest. I have no real evidence of this, of course, but it’s an interesting thought.
Needless to say (but I will), level of team support has no bearing on the quality of the passer. For example, I think it’s safe to claim that Russell Wilson has had better team support from the Seahawks than Blaine Gabbert has had from the Jaguars and Niners – but it’s even more safe to say that Wilson is the better quarterback, regardless of support.
Rather than a black mark or something to be defended, Patriots fans should be happy to see that their team and coaches have been able to support their Hall of Fame quarterback while lesser organizations have wasted so many seasons of their elite QBs careers.
Looking just at support, we also see how it affects the win percentage of these QBs. Tom Brady has both the highest win percentage and highest levels of support metrics by large margins. Peyton Manning and Aaron Rodgers have similar overall support metrics and similar overall win percentages. And Drew Brees had substantially lower win percentages and support metrics than the other quarterbacks.
To test this idea out, I ran correlations between wins and both Passing EP and Support EP – I found that among these four quarterbacks, Passing EP had an average of 0.493 correlation with wins; meanwhile, Support EP had an average of 0.478. This shows that among these four quarterbacks, Expected Points from Support was about as important as EP from Passing for their teams’ win records.
Hey, maybe the other 52 men on a team’s roster matter after all!