by Chase Stuart
on September 6, 2015
A couple of weeks ago, I looked at the Adjusted Yards per Carry data for 2014 offenses; today, the same information but for the other side of the ball. As a reminder, here’s the formula for calculating Adjusted Yards per Carry:
Adjusted Rushing Yards per Carry = (Rush Yards + 11 * Rush TDs + 9 * Rush First Downs – Kneel Yards Lost ) / (Rushes – Kneels)
Let’s use the Detroit Lions defense as an example. The Lions faced 350 rush attempts last year and allowed 1,109 rushing yards and eight touchdowns. However, seven of those rushing attempts were actually kneels by the opponent (for -7 “rushing yards”), so we need to back those out of the data. The Lions also allowed 59 rushing first downs, or a first down on 17.2% of all carries. As a result, Detroit allowed 5.06 Adjusted Rushing Yards per Carry last year, the best rate in the NFL. The league average last year was 6.63, which means the Lions were over a yard and a half above average per carry. Multiply that difference by the 343 non-kneel runs that Detroit faced, and the Lions rush defense was 541 Adjusted Rushing Yards above average (here, negative is better), the top value-producing rush defense in the NFL in 2014. [continue reading…]
Tagged as:
Adjusted YPC
{ }
by Chase Stuart
on August 28, 2014
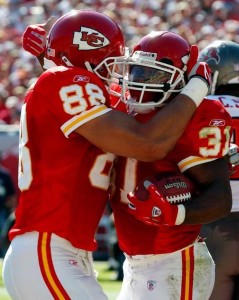
A common sight on any fall Sunday in the early '00s.
From 2002 to 2005,
Peyton Manning was the best quarterback in the NFL, at least statistically, by a wide margin. But the #2 quarterback in Adjusted Net Yards per Attempt was
Trent Green, and there was
a wide gap between Green and all other quarterbacks not named Manning. Over that same period,
Tony Gonzalez led all tight ends in
receptions, receiving yards, and touchdowns. And the Chiefs rushed for 34 more touchdowns than any other team, in addition to ranking
third in rushing yards and fourth in yards per carry.
Kansas City ranked 4th in Adjusted Net Yards per Attempt in 2002, 1st in 2003, 3rd in 2004, and 2nd in 2005. In terms of Adjusted Yards per Carry, the Chiefs were 2nd in 2002, 3rd in 2003, 1st in 2004, and 3rd in 2005. That’s an incredible streak of not just dominance, but balanced dominance. And Kansas City missed the playoffs in three of those four years! (pours one out for Jason Lisk).
On Monday, we looked at some great defenses that missed the playoffs. Today, a look at some of the best offenses to stay home for the winter. And in the last 15 years, the 2002 Chiefs, 2004 Chiefs, and 2005 Chiefs are the only teams to rank in the top five in both ANY/A and AYPC and miss the playoffs.
What other teams since the merger met those criteria? [continue reading…]
Tagged as:
Adjusted YPC
{ }

