
Today’s guest post/contest comes from Thomas McDermott, a licensed land surveyor in the State of California, a music theory instructor at Loyola Marymount University, and an NFL history enthusiast. As always, we thank him for his hard work. You can read all of his guest posts at Football Perspective at this link.
The following is a bunch of data I’ve gathered regarding home-field advantage; hopefully some of you will find it useful for analysis, or for picking winners against the spread in your pick’em games this year!
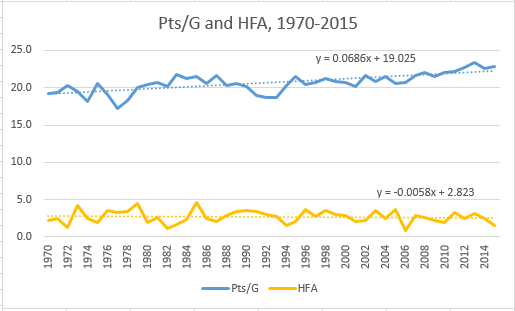
The general consensus is that the home team in a typical NFL game has an advantage of around 2.5 to 3 points, and this is right on: since 1970, the average team wins their regular season home games [1]The HFA number during the playoffs over that same period is 6.5, but that’s probably due to playoff seeding than fan/stadium involvement; it might be interesting to look into this further. by 2.7 points, [2]As far as what causes home teams to have an advantage at home, Brian Burke suggests in this article that it has more to do with environmental familiarity, and other factors, than the effect of … Continue reading with a high of 4.6 in 1985 and a low of 0.8 in 2006. If we do a linear regression, we can see that HFA appears to be in decline, but only slightly compared to points per game, which is obviously increasing:
But what about specific teams? If I’m trying to predict who’s going to win a Seahawks game played in Seattle, I’d probably assume the HFA at CenturyLink Field is more than just 2.7 points. To approximate a particular team’s HFA, we can use a very simple formula:
(Home point differential – Road point differential) / 2
This gives us what is called an “observed” home field advantage. [3]Bill Barnwell used this method in a nice article back in 2012. At the time, the Seahawks had the best home field advantage at 5.2 points; since then, they’ve regressed down to a still strong 4.2 … Continue reading
This method has been around for a while, and although it’s not perfect (as I note below), it has the benefit of being intuitive and simple. Below is a table showing the observed HFA for each team for every season since 2002:
| Year | TEAM | Overall Record | Home Record | Playoffs | Overall MOV | PD Home | PD Away | HFA |
|---|---|---|---|---|---|---|---|---|
| 2003 | SFO | 7-9-0 | 6-2-0 | 2.9 | 16.3 | -10.4 | 13.3 | |
| 2007 | DET | 7-9-0 | 5-3-0 | -6.1 | 5.5 | -17.8 | 11.6 | |
| 2013 | NOR | 11-5-0 | 8-0-0 | Lost Div | 6.9 | 18.4 | -4.6 | 11.5 |
| 2009 | SEA | 5-11-0 | 4-4-0 | -6.9 | 4.1 | -17.9 | 11.0 | |
| 2002 | MIA | 9-7-0 | 7-1-0 | 4.8 | 15.6 | -6.0 | 10.8 | |
| 2014 | GNB | 12-4-0 | 8-0-0 | Lost Conf | 8.6 | 19.4 | -2.1 | 10.8 |
| 2011 | NOR | 13-3-0 | 8-0-0 | Lost Div | 13.0 | 23.3 | 2.8 | 10.3 |
| 2008 | CAR | 12-4-0 | 8-0-0 | Lost Div | 5.3 | 15.4 | -4.8 | 10.1 |
| 2013 | CIN | 11-5-0 | 8-0-0 | Lost WC | 7.8 | 17.6 | -2.0 | 9.8 |
| 2003 | STL | 12-4-0 | 8-0-0 | Lost Div | 7.4 | 17.1 | -2.3 | 9.7 |
| 2009 | NWE | 10-6-0 | 8-0-0 | Lost WC | 8.9 | 18.4 | -0.6 | 9.5 |
| 2005 | MIN | 9-7-0 | 6-2-0 | -2.4 | 7.1 | -11.9 | 9.5 | |
| 2006 | JAX | 8-8-0 | 6-2-0 | 6.1 | 15.5 | -3.4 | 9.4 | |
| 2003 | ARI | 4-12-0 | 4-4-0 | -14.2 | -4.8 | -23.6 | 9.4 | |
| 2002 | KAN | 8-8-0 | 6-2-0 | 4.3 | 13.6 | -5.1 | 9.4 | |
| 2007 | HOU | 8-8-0 | 6-2-0 | -0.3 | 8.9 | -9.5 | 9.2 | |
| 2002 | STL | 7-9-0 | 6-2-0 | -3.3 | 5.8 | -12.4 | 9.1 | |
| 2003 | KAN | 13-3-0 | 8-0-0 | Lost Div | 9.5 | 18.5 | 0.5 | 9.0 |
| 2011 | PIT | 12-4-0 | 7-1-0 | Lost WC | 6.1 | 15.0 | -2.8 | 8.9 |
| 2009 | BAL | 9-7-0 | 6-2-0 | Lost Div | 8.1 | 16.9 | -0.6 | 8.8 |
| 2003 | CHI | 7-9-0 | 6-2-0 | -3.9 | 4.8 | -12.6 | 8.7 | |
| 2008 | PHI | 9-6-1 | 6-1-1 | Lost Conf | 7.9 | 16.5 | -0.6 | 8.6 |
| 2005 | BAL | 6-10-0 | 6-2-0 | -2.1 | 6.3 | -10.5 | 8.4 | |
| 2005 | NYJ | 4-12-0 | 4-4-0 | -7.2 | 1.1 | -15.5 | 8.3 | |
| 2004 | BAL | 9-7-0 | 6-2-0 | 3.1 | 11.4 | -5.3 | 8.3 | |
| 2004 | STL | 8-8-0 | 6-2-0 | Lost Div | -4.6 | 3.8 | -12.9 | 8.3 |
| 2010 | SDG | 9-7-0 | 6-2-0 | 7.4 | 15.6 | -0.8 | 8.2 | |
| 2012 | SEA | 11-5-0 | 8-0-0 | Lost Div | 10.4 | 18.5 | 2.4 | 8.1 |
| 2011 | BUF | 6-10-0 | 5-3-0 | -3.9 | 4.1 | -11.9 | 8.0 | |
| 2008 | ARI | 9-7-0 | 6-2-0 | Lost SB | 0.1 | 8.0 | -7.9 | 7.9 |
| 2010 | SFO | 6-10-0 | 5-3-0 | -2.6 | 5.3 | -10.4 | 7.8 | |
| 2003 | MIN | 9-7-0 | 6-2-0 | 3.9 | 11.8 | -3.9 | 7.8 | |
| 2009 | TEN | 8-8-0 | 5-3-0 | -3.0 | 4.6 | -10.6 | 7.6 | |
| 2003 | SEA | 10-6-0 | 8-0-0 | Lost WC | 4.8 | 12.4 | -2.8 | 7.6 |
| 2012 | NYG | 9-7-0 | 6-2-0 | 5.3 | 12.8 | -2.1 | 7.4 | |
| 2010 | ARI | 5-11-0 | 4-4-0 | -9.1 | -1.6 | -16.5 | 7.4 | |
| 2009 | MIN | 12-4-0 | 8-0-0 | Lost Conf | 9.9 | 17.3 | 2.5 | 7.4 |
| 2004 | ARI | 6-10-0 | 5-3-0 | -2.4 | 5.0 | -9.8 | 7.4 | |
| 2011 | SFO | 13-3-0 | 7-1-0 | Lost Conf | 9.4 | 16.8 | 2.1 | 7.3 |
| 2009 | CHI | 7-9-0 | 5-3-0 | -3.0 | 4.3 | -10.3 | 7.3 | |
| 2005 | CHI | 11-5-0 | 7-1-0 | Lost Div | 3.6 | 10.9 | -3.6 | 7.3 |
| 2005 | GNB | 4-12-0 | 3-5-0 | -2.9 | 4.4 | -10.1 | 7.3 | |
| 2008 | DAL | 9-7-0 | 6-2-0 | -0.2 | 7.0 | -7.4 | 7.2 | |
| 2009 | JAX | 7-9-0 | 5-3-0 | -5.6 | 1.5 | -12.8 | 7.1 | |
| 2012 | ARI | 5-11-0 | 4-4-0 | -6.7 | 0.4 | -13.8 | 7.1 | |
| 2002 | GNB | 12-4-0 | 8-0-0 | Lost WC | 4.4 | 11.4 | -2.6 | 7.0 |
| 2006 | IND | 12-4-0 | 8-0-0 | Won SB | 4.2 | 11.1 | -2.8 | 6.9 |
| 2007 | SEA | 10-6-0 | 7-1-0 | Lost Div | 6.4 | 13.3 | -0.5 | 6.9 |
| 2003 | DET | 5-11-0 | 5-3-0 | -6.8 | 0.0 | -13.6 | 6.8 | |
| 2010 | KAN | 10-6-0 | 7-1-0 | Lost WC | 2.5 | 9.3 | -4.3 | 6.8 |
| 2015 | SFO | 5-11-0 | 4-4-0 | -9.3 | -2.6 | -16.0 | 6.7 | |
| 2013 | NYJ | 8-8-0 | 6-2-0 | -6.1 | 0.6 | -12.8 | 6.7 | |
| 2004 | ATL | 11-5-0 | 7-1-0 | Lost Conf | 0.2 | 6.9 | -6.5 | 6.7 |
| 2014 | DEN | 12-4-0 | 8-0-0 | Lost Div | 8.0 | 14.6 | 1.4 | 6.6 |
| 2015 | WAS | 9-7-0 | 6-2-0 | Lost WC | 0.6 | 7.1 | -6.0 | 6.6 |
| 2014 | NWE | 12-4-0 | 7-1-0 | Won SB | 9.7 | 16.3 | 3.1 | 6.6 |
| 2013 | BUF | 6-10-0 | 4-4-0 | -3.1 | 3.5 | -9.6 | 6.6 | |
| 2014 | DET | 11-5-0 | 7-1-0 | Lost WC | 2.4 | 8.9 | -4.0 | 6.4 |
| 2010 | SEA | 7-9-0 | 5-3-0 | Lost Div | -6.1 | 0.4 | -12.5 | 6.4 |
| 2009 | CIN | 10-6-0 | 6-2-0 | Lost WC | 0.9 | 7.3 | -5.5 | 6.4 |
| 2003 | BUF | 6-10-0 | 4-4-0 | -2.3 | 4.1 | -8.6 | 6.4 | |
| 2005 | SFO | 4-12-0 | 3-5-0 | -11.8 | -5.5 | -18.1 | 6.3 | |
| 2009 | DET | 2-14-0 | 2-6-0 | -14.5 | -8.3 | -20.8 | 6.3 | |
| 2005 | NYG | 11-5-0 | 7-1-0 | Lost WC | 6.8 | 13.0 | 0.5 | 6.3 |
| 2011 | GNB | 15-1-0 | 8-0-0 | Lost Div | 12.6 | 18.8 | 6.4 | 6.2 |
| 2011 | IND | 2-14-0 | 2-6-0 | -11.7 | -5.5 | -17.9 | 6.2 | |
| 2015 | JAX | 5-11-0 | 4-4-0 | -4.5 | 1.6 | -10.6 | 6.1 | |
| 2007 | SDG | 11-5-0 | 7-1-0 | Lost Conf | 8.0 | 14.1 | 1.9 | 6.1 |
| 2013 | CAR | 12-4-0 | 7-1-0 | Lost Div | 7.8 | 13.9 | 1.8 | 6.1 |
| 2007 | DEN | 7-9-0 | 5-3-0 | -5.6 | 0.5 | -11.6 | 6.1 | |
| 2012 | BAL | 10-6-0 | 6-2-0 | Won SB | 3.4 | 9.4 | -2.6 | 6.0 |
| 2005 | WAS | 10-6-0 | 6-2-0 | Lost Div | 4.1 | 10.1 | -1.9 | 6.0 |
| 2004 | TAM | 5-11-0 | 4-4-0 | -0.2 | 5.8 | -6.1 | 5.9 | |
| 2010 | GNB | 10-6-0 | 7-1-0 | Won SB | 9.3 | 15.1 | 3.4 | 5.9 |
| 2007 | PIT | 10-6-0 | 7-1-0 | Lost WC | 7.8 | 13.6 | 1.9 | 5.9 |
| 2007 | TAM | 9-7-0 | 6-2-0 | Lost WC | 4.0 | 9.9 | -1.9 | 5.9 |
| 2005 | KAN | 10-6-0 | 7-1-0 | 4.9 | 10.8 | -1.0 | 5.9 | |
| 2003 | BAL | 10-6-0 | 7-1-0 | Lost WC | 6.9 | 12.8 | 1.0 | 5.9 |
| 2002 | DET | 3-13-0 | 3-5-0 | -9.1 | -3.3 | -14.9 | 5.8 | |
| 2012 | IND | 11-5-0 | 7-1-0 | Lost WC | -1.9 | 3.9 | -7.6 | 5.8 |
| 2011 | DAL | 8-8-0 | 5-3-0 | 1.4 | 7.1 | -4.4 | 5.8 | |
| 2003 | NWE | 14-2-0 | 8-0-0 | Won SB | 6.9 | 12.6 | 1.1 | 5.8 |
| 2013 | DAL | 8-8-0 | 5-3-0 | 0.4 | 6.1 | -5.3 | 5.7 | |
| 2007 | BAL | 5-11-0 | 4-4-0 | -6.8 | -1.1 | -12.5 | 5.7 | |
| 2007 | JAX | 11-5-0 | 6-2-0 | Lost Div | 6.7 | 12.4 | 1.0 | 5.7 |
| 2014 | SDG | 9-7-0 | 5-3-0 | 0.0 | 5.6 | -5.6 | 5.6 | |
| 2005 | TEN | 4-12-0 | 3-5-0 | -7.6 | -2.0 | -13.3 | 5.6 | |
| 2012 | GNB | 11-5-0 | 7-1-0 | Lost Div | 6.1 | 11.6 | 0.5 | 5.6 |
| 2008 | IND | 12-4-0 | 6-2-0 | Lost WC | 4.9 | 10.5 | -0.6 | 5.6 |
| 2011 | BAL | 12-4-0 | 8-0-0 | Lost Conf | 7.0 | 12.5 | 1.5 | 5.5 |
| 2011 | NYJ | 8-8-0 | 6-2-0 | 0.9 | 6.4 | -4.6 | 5.5 | |
| 2013 | ARI | 10-6-0 | 6-2-0 | 3.4 | 8.9 | -2.0 | 5.4 | |
| 2011 | TAM | 4-12-0 | 3-5-0 | -12.9 | -7.5 | -18.4 | 5.4 | |
| 2006 | HOU | 6-10-0 | 4-4-0 | -6.2 | -0.8 | -11.6 | 5.4 | |
| 2005 | SEA | 13-3-0 | 8-0-0 | Lost SB | 11.3 | 16.8 | 5.9 | 5.4 |
| 2012 | BUF | 6-10-0 | 4-4-0 | -5.7 | -0.4 | -11.0 | 5.3 | |
| 2012 | OAK | 4-12-0 | 3-5-0 | -9.6 | -4.3 | -14.9 | 5.3 | |
| 2015 | PIT | 10-6-0 | 6-2-0 | Lost Div | 6.5 | 11.8 | 1.3 | 5.3 |
| 2011 | ATL | 10-6-0 | 6-2-0 | Lost WC | 3.3 | 8.5 | -2.0 | 5.3 |
| 2008 | SDG | 8-8-0 | 5-3-0 | Lost Div | 5.8 | 10.9 | 0.6 | 5.1 |
| 2014 | BAL | 10-6-0 | 6-2-0 | Lost Div | 6.7 | 11.8 | 1.6 | 5.1 |
| 2005 | DAL | 9-7-0 | 5-3-0 | 1.1 | 6.1 | -4.0 | 5.1 | |
| 2005 | DEN | 13-3-0 | 8-0-0 | Lost Conf | 8.6 | 13.6 | 3.5 | 5.1 |
| 2015 | NOR | 7-9-0 | 4-4-0 | -4.3 | 0.8 | -9.3 | 5.0 | |
| 2011 | CHI | 8-8-0 | 5-3-0 | 0.8 | 5.8 | -4.3 | 5.0 | |
| 2008 | ATL | 11-5-0 | 7-1-0 | Lost WC | 4.1 | 9.1 | -0.9 | 5.0 |
| 2008 | HOU | 8-8-0 | 6-2-0 | -1.8 | 3.3 | -6.8 | 5.0 | |
| 2008 | NOR | 8-8-0 | 6-2-0 | 4.4 | 9.4 | -0.6 | 5.0 | |
| 2008 | SEA | 4-12-0 | 2-6-0 | -6.1 | -1.3 | -11.0 | 4.9 | |
| 2005 | BUF | 5-11-0 | 4-4-0 | -6.0 | -1.1 | -10.9 | 4.9 | |
| 2002 | DAL | 5-11-0 | 4-4-0 | -7.0 | -2.1 | -11.9 | 4.9 | |
| 2014 | OAK | 3-13-0 | 3-5-0 | -12.4 | -7.6 | -17.3 | 4.8 | |
| 2013 | MIN | 5-10-1 | 5-2-1 | -5.6 | -0.8 | -10.4 | 4.8 | |
| 2008 | STL | 2-14-0 | 1-7-0 | -14.6 | -9.8 | -19.4 | 4.8 | |
| 2014 | PHI | 10-6-0 | 6-2-0 | 4.6 | 9.4 | -0.1 | 4.8 | |
| 2006 | KAN | 9-7-0 | 6-2-0 | Lost WC | 1.0 | 5.8 | -3.8 | 4.8 |
| 2002 | MIN | 6-10-0 | 4-4-0 | -3.3 | 1.5 | -8.0 | 4.8 | |
| 2015 | NYJ | 10-6-0 | 6-2-0 | 4.6 | 9.3 | -0.1 | 4.7 | |
| 2014 | IND | 11-5-0 | 6-2-0 | Lost Conf | 5.6 | 10.3 | 0.9 | 4.7 |
| 2014 | KAN | 9-7-0 | 6-2-0 | 4.5 | 9.1 | -0.1 | 4.6 | |
| 2007 | WAS | 9-7-0 | 5-3-0 | Lost WC | 1.5 | 6.1 | -3.1 | 4.6 |
| 2005 | ARI | 5-11-0 | 3-5-0 | -4.8 | -0.1 | -9.4 | 4.6 | |
| 2012 | NOR | 7-9-0 | 4-4-0 | 0.4 | 5.0 | -4.1 | 4.6 | |
| 2010 | STL | 7-9-0 | 5-3-0 | -2.4 | 2.1 | -7.0 | 4.6 | |
| 2008 | NYG | 12-4-0 | 7-1-0 | Lost Div | 8.3 | 12.9 | 3.8 | 4.6 |
| 2003 | TEN | 12-4-0 | 7-1-0 | Lost Div | 6.9 | 11.5 | 2.4 | 4.6 |
| 2015 | NWE | 12-4-0 | 7-1-0 | Lost Conf | 9.4 | 13.9 | 4.9 | 4.5 |
| 2004 | KAN | 7-9-0 | 4-4-0 | 3.0 | 7.5 | -1.5 | 4.5 | |
| 2011 | DET | 10-6-0 | 5-3-0 | Lost WC | 5.4 | 9.9 | 1.0 | 4.4 |
| 2011 | SDG | 8-8-0 | 5-3-0 | 1.8 | 6.3 | -2.6 | 4.4 | |
| 2004 | PIT | 15-1-0 | 8-0-0 | Lost Conf | 7.6 | 12.0 | 3.1 | 4.4 |
| 2012 | CLE | 5-11-0 | 4-4-0 | -4.1 | 0.3 | -8.5 | 4.4 | |
| 2013 | TAM | 4-12-0 | 3-5-0 | -6.3 | -2.0 | -10.6 | 4.3 | |
| 2007 | ARI | 8-8-0 | 6-2-0 | 0.3 | 4.6 | -4.0 | 4.3 | |
| 2007 | GNB | 13-3-0 | 7-1-0 | Lost Conf | 9.0 | 13.3 | 4.8 | 4.3 |
| 2004 | NYJ | 10-6-0 | 6-2-0 | Lost Div | 4.5 | 8.8 | 0.3 | 4.3 |
| 2013 | NYG | 7-9-0 | 4-4-0 | -5.6 | -1.4 | -9.8 | 4.2 | |
| 2012 | MIA | 7-9-0 | 5-3-0 | -1.8 | 2.4 | -6.0 | 4.2 | |
| 2010 | DET | 6-10-0 | 4-4-0 | -0.4 | 3.8 | -4.6 | 4.2 | |
| 2007 | STL | 3-13-0 | 1-7-0 | -10.9 | -6.8 | -15.1 | 4.2 | |
| 2013 | BAL | 8-8-0 | 6-2-0 | -2.0 | 2.1 | -6.1 | 4.1 | |
| 2012 | DEN | 13-3-0 | 7-1-0 | Lost Div | 12.0 | 16.1 | 7.9 | 4.1 |
| 2007 | MIN | 8-8-0 | 5-3-0 | 3.4 | 7.5 | -0.8 | 4.1 | |
| 2013 | DEN | 13-3-0 | 7-1-0 | Lost SB | 12.9 | 17.0 | 8.9 | 4.1 |
| 2009 | DAL | 11-5-0 | 6-2-0 | Lost Div | 6.9 | 11.0 | 2.9 | 4.1 |
| 2004 | SDG | 12-4-0 | 7-1-0 | Lost WC | 8.3 | 12.4 | 4.3 | 4.1 |
| 2003 | HOU | 5-11-0 | 3-5-0 | -7.8 | -3.8 | -11.9 | 4.1 | |
| 2015 | CAR | 15-1-0 | 8-0-0 | Lost SB | 12.0 | 16.0 | 8.0 | 4.0 |
| 2005 | PHI | 6-10-0 | 4-4-0 | -4.9 | -0.9 | -8.9 | 4.0 | |
| 2014 | JAX | 3-13-0 | 3-5-0 | -10.2 | -6.3 | -14.1 | 3.9 | |
| 2013 | CHI | 8-8-0 | 5-3-0 | -2.1 | 1.9 | -6.0 | 3.9 | |
| 2009 | SFO | 8-8-0 | 6-2-0 | 3.1 | 7.0 | -0.9 | 3.9 | |
| 2002 | ARI | 5-11-0 | 3-5-0 | -9.7 | -5.8 | -13.6 | 3.9 | |
| 2013 | STL | 7-9-0 | 5-3-0 | -1.0 | 2.9 | -4.9 | 3.9 | |
| 2006 | PIT | 8-8-0 | 5-3-0 | 2.4 | 6.3 | -1.5 | 3.9 | |
| 2015 | IND | 8-8-0 | 4-4-0 | -4.7 | -0.9 | -8.5 | 3.8 | |
| 2011 | MIN | 3-13-0 | 1-7-0 | -6.8 | -3.0 | -10.6 | 3.8 | |
| 2010 | DEN | 4-12-0 | 3-5-0 | -7.9 | -4.1 | -11.8 | 3.8 | |
| 2005 | NOR | 3-13-0 | 1-7-0 | -10.2 | -6.4 | -14.0 | 3.8 | |
| 2013 | SEA | 13-3-0 | 7-1-0 | Won SB | 11.6 | 15.4 | 7.9 | 3.8 |
| 2012 | KAN | 2-14-0 | 1-7-0 | -13.4 | -9.6 | -17.1 | 3.8 | |
| 2009 | BUF | 6-10-0 | 3-5-0 | -4.3 | -0.5 | -8.0 | 3.8 | |
| 2006 | SFO | 7-9-0 | 4-4-0 | -7.1 | -3.4 | -10.9 | 3.8 | |
| 2012 | MIN | 10-6-0 | 7-1-0 | Lost WC | 1.9 | 5.6 | -1.8 | 3.7 |
| 2008 | BAL | 11-5-0 | 6-2-0 | Lost Conf | 8.8 | 12.5 | 5.1 | 3.7 |
| 2005 | DET | 5-11-0 | 3-5-0 | -5.7 | -2.0 | -9.4 | 3.7 | |
| 2011 | ARI | 8-8-0 | 6-2-0 | -2.3 | 1.4 | -5.9 | 3.6 | |
| 2011 | JAX | 5-11-0 | 4-4-0 | -5.4 | -1.8 | -9.0 | 3.6 | |
| 2013 | DET | 7-9-0 | 4-4-0 | 1.2 | 4.8 | -2.4 | 3.6 | |
| 2008 | GNB | 6-10-0 | 4-4-0 | 2.4 | 6.0 | -1.1 | 3.6 | |
| 2003 | PIT | 6-10-0 | 4-4-0 | -1.7 | 1.9 | -5.3 | 3.6 | |
| 2015 | STL | 7-9-0 | 5-3-0 | -3.1 | 0.4 | -6.6 | 3.5 | |
| 2011 | STL | 2-14-0 | 1-7-0 | -13.4 | -9.9 | -16.9 | 3.5 | |
| 2006 | OAK | 2-14-0 | 2-6-0 | -10.3 | -6.8 | -13.8 | 3.5 | |
| 2004 | DAL | 6-10-0 | 4-4-0 | -7.0 | -3.5 | -10.5 | 3.5 | |
| 2013 | GNB | 8-7-1 | 4-3-1 | Lost WC | -0.7 | 2.8 | -4.1 | 3.4 |
| 2010 | NYJ | 11-5-0 | 5-3-0 | Lost Conf | 3.9 | 7.4 | 0.5 | 3.4 |
| 2008 | NYJ | 9-7-0 | 5-3-0 | 3.1 | 6.5 | -0.4 | 3.4 | |
| 2007 | BUF | 7-9-0 | 4-4-0 | -6.4 | -3.0 | -9.8 | 3.4 | |
| 2007 | CLE | 10-6-0 | 7-1-0 | 1.3 | 4.6 | -2.1 | 3.4 | |
| 2004 | CLE | 4-12-0 | 3-5-0 | -7.1 | -3.8 | -10.5 | 3.4 | |
| 2015 | GNB | 10-6-0 | 5-3-0 | Lost Div | 2.8 | 6.1 | -0.5 | 3.3 |
| 2012 | HOU | 12-4-0 | 6-2-0 | Lost Div | 5.3 | 8.6 | 2.0 | 3.3 |
| 2012 | TEN | 6-10-0 | 4-4-0 | -8.8 | -5.5 | -12.1 | 3.3 | |
| 2015 | ATL | 8-8-0 | 4-4-0 | -0.4 | 2.9 | -3.6 | 3.3 | |
| 2004 | OAK | 5-11-0 | 3-5-0 | -7.6 | -4.4 | -10.9 | 3.3 | |
| 2003 | JAX | 5-11-0 | 5-3-0 | -3.4 | -0.3 | -6.6 | 3.2 | |
| 2015 | CLE | 3-13-0 | 2-6-0 | -9.6 | -6.5 | -12.8 | 3.1 | |
| 2015 | DET | 7-9-0 | 4-4-0 | -2.6 | 0.5 | -5.8 | 3.1 | |
| 2015 | HOU | 9-7-0 | 5-3-0 | Lost WC | 1.6 | 4.8 | -1.5 | 3.1 |
| 2014 | PIT | 11-5-0 | 6-2-0 | Lost WC | 4.3 | 7.4 | 1.1 | 3.1 |
| 2013 | CLE | 4-12-0 | 3-5-0 | -6.1 | -3.0 | -9.3 | 3.1 | |
| 2013 | NWE | 12-4-0 | 8-0-0 | Lost Conf | 6.6 | 9.8 | 3.5 | 3.1 |
| 2012 | SFO | 11-4-1 | 6-1-1 | Lost SB | 7.8 | 10.9 | 4.6 | 3.1 |
| 2003 | DEN | 10-6-0 | 6-2-0 | Lost WC | 5.0 | 8.1 | 1.9 | 3.1 |
| 2004 | IND | 12-4-0 | 7-1-0 | Lost Div | 10.7 | 13.8 | 7.6 | 3.1 |
| 2013 | ATL | 4-12-0 | 3-5-0 | -5.6 | -2.6 | -8.6 | 3.0 | |
| 2012 | PIT | 8-8-0 | 5-3-0 | 1.4 | 4.4 | -1.6 | 3.0 | |
| 2009 | CLE | 5-11-0 | 3-5-0 | -8.1 | -5.1 | -11.1 | 3.0 | |
| 2008 | TAM | 9-7-0 | 6-2-0 | 2.4 | 5.4 | -0.6 | 3.0 | |
| 2003 | NOR | 8-8-0 | 5-3-0 | 0.9 | 3.9 | -2.1 | 3.0 | |
| 2006 | WAS | 5-11-0 | 3-5-0 | -4.3 | -1.4 | -7.3 | 2.9 | |
| 2014 | STL | 6-10-0 | 3-5-0 | -1.9 | 1.0 | -4.8 | 2.9 | |
| 2009 | ATL | 9-7-0 | 6-2-0 | 2.4 | 5.3 | -0.5 | 2.9 | |
| 2006 | SEA | 9-7-0 | 5-3-0 | Lost Div | -0.4 | 2.5 | -3.3 | 2.9 |
| 2002 | ATL | 9-6-1 | 5-2-1 | Lost Div | 5.5 | 8.4 | 2.6 | 2.9 |
| 2002 | CAR | 7-9-0 | 4-4-0 | -2.8 | 0.1 | -5.6 | 2.9 | |
| 2006 | SDG | 14-2-0 | 8-0-0 | Lost Div | 11.8 | 14.6 | 9.0 | 2.8 |
| 2005 | MIA | 9-7-0 | 5-3-0 | 0.1 | 2.8 | -2.6 | 2.7 | |
| 2004 | MIA | 4-12-0 | 3-5-0 | -4.9 | -2.3 | -7.6 | 2.7 | |
| 2014 | BUF | 9-7-0 | 5-3-0 | 3.4 | 6.0 | 0.8 | 2.6 | |
| 2009 | MIA | 7-9-0 | 4-4-0 | -1.9 | 0.8 | -4.5 | 2.6 | |
| 2004 | MIN | 8-8-0 | 5-3-0 | Lost Div | 0.6 | 3.3 | -2.0 | 2.6 |
| 2003 | NYJ | 6-10-0 | 4-4-0 | -1.0 | 1.6 | -3.6 | 2.6 | |
| 2003 | OAK | 4-12-0 | 4-4-0 | -6.8 | -4.3 | -9.4 | 2.6 | |
| 2002 | CHI | 4-12-0 | 3-5-0 | -6.1 | -3.6 | -8.6 | 2.5 | |
| 2012 | TAM | 7-9-0 | 3-5-0 | -0.3 | 2.1 | -2.8 | 2.4 | |
| 2010 | HOU | 6-10-0 | 4-4-0 | -2.3 | 0.1 | -4.8 | 2.4 | |
| 2007 | CIN | 7-9-0 | 5-3-0 | -0.3 | 2.1 | -2.8 | 2.4 | |
| 2014 | ATL | 6-10-0 | 3-5-0 | -2.3 | 0.1 | -4.6 | 2.4 | |
| 2004 | HOU | 7-9-0 | 3-5-0 | -1.9 | 0.5 | -4.3 | 2.4 | |
| 2010 | CIN | 4-12-0 | 3-5-0 | -4.6 | -2.3 | -6.9 | 2.3 | |
| 2010 | TEN | 6-10-0 | 3-5-0 | 1.1 | 3.4 | -1.3 | 2.3 | |
| 2009 | NYG | 8-8-0 | 4-4-0 | -1.6 | 0.8 | -3.9 | 2.3 | |
| 2007 | OAK | 4-12-0 | 2-6-0 | -7.2 | -4.9 | -9.5 | 2.3 | |
| 2014 | NYJ | 4-12-0 | 2-6-0 | -7.4 | -5.1 | -9.6 | 2.3 | |
| 2012 | PHI | 4-12-0 | 2-6-0 | -10.3 | -8.0 | -12.5 | 2.3 | |
| 2004 | PHI | 13-3-0 | 7-1-0 | Lost SB | 7.9 | 10.1 | 5.6 | 2.3 |
| 2014 | ARI | 11-5-0 | 7-1-0 | Lost WC | 0.7 | 2.9 | -1.5 | 2.2 |
| 2010 | IND | 10-6-0 | 6-2-0 | Lost WC | 2.9 | 5.1 | 0.8 | 2.2 |
| 2007 | SFO | 5-11-0 | 3-5-0 | -9.1 | -6.9 | -11.3 | 2.2 | |
| 2006 | ARI | 5-11-0 | 3-5-0 | -4.7 | -2.5 | -6.9 | 2.2 | |
| 2006 | DET | 3-13-0 | 2-6-0 | -5.8 | -3.6 | -8.0 | 2.2 | |
| 2005 | OAK | 4-12-0 | 2-6-0 | -5.8 | -3.6 | -8.0 | 2.2 | |
| 2008 | SFO | 7-9-0 | 4-4-0 | -2.6 | -0.5 | -4.8 | 2.1 | |
| 2003 | GNB | 10-6-0 | 5-3-0 | Lost Div | 8.4 | 10.5 | 6.4 | 2.1 |
| 2015 | NYG | 6-10-0 | 3-5-0 | -1.4 | 0.6 | -3.4 | 2.0 | |
| 2014 | SEA | 12-4-0 | 7-1-0 | Lost SB | 8.8 | 10.8 | 6.8 | 2.0 |
| 2013 | SDG | 9-7-0 | 5-3-0 | Lost Div | 3.0 | 5.0 | 1.0 | 2.0 |
| 2008 | CLE | 4-12-0 | 1-7-0 | -7.4 | -5.4 | -9.4 | 2.0 | |
| 2006 | BAL | 13-3-0 | 7-1-0 | Lost Div | 9.5 | 11.5 | 7.5 | 2.0 |
| 2005 | TAM | 11-5-0 | 6-2-0 | Lost WC | 1.6 | 3.6 | -0.4 | 2.0 |
| 2008 | CIN | 4-11-1 | 3-4-1 | -10.0 | -8.1 | -11.9 | 1.9 | |
| 2007 | CHI | 7-9-0 | 4-4-0 | -0.9 | 1.0 | -2.8 | 1.9 | |
| 2005 | SDG | 9-7-0 | 4-4-0 | 6.6 | 8.5 | 4.8 | 1.9 | |
| 2005 | STL | 6-10-0 | 3-5-0 | -4.1 | -2.3 | -6.0 | 1.9 | |
| 2002 | WAS | 7-9-0 | 5-3-0 | -3.6 | -1.8 | -5.5 | 1.9 | |
| 2013 | PIT | 8-8-0 | 5-3-0 | 0.6 | 2.4 | -1.3 | 1.8 | |
| 2011 | CAR | 6-10-0 | 3-5-0 | -1.4 | 0.4 | -3.3 | 1.8 | |
| 2007 | NWE | 16-0-0 | 8-0-0 | Lost SB | 19.7 | 21.5 | 17.9 | 1.8 |
| 2006 | BUF | 7-9-0 | 4-4-0 | -0.7 | 1.1 | -2.5 | 1.8 | |
| 2002 | JAX | 6-10-0 | 3-5-0 | 0.8 | 2.6 | -1.0 | 1.8 | |
| 2004 | CIN | 8-8-0 | 5-3-0 | 0.1 | 1.9 | -1.6 | 1.8 | |
| 2004 | SEA | 9-7-0 | 5-3-0 | Lost WC | -0.1 | 1.6 | -1.9 | 1.8 |
| 2003 | CLE | 5-11-0 | 2-6-0 | -4.3 | -2.5 | -6.0 | 1.8 | |
| 2014 | MIN | 7-9-0 | 5-3-0 | -1.1 | 0.5 | -2.8 | 1.6 | |
| 2002 | DEN | 9-7-0 | 5-3-0 | 3.0 | 4.6 | 1.4 | 1.6 | |
| 2013 | TEN | 7-9-0 | 3-5-0 | -1.2 | 0.4 | -2.8 | 1.6 | |
| 2010 | BAL | 12-4-0 | 7-1-0 | Lost Div | 5.4 | 7.0 | 3.9 | 1.6 |
| 2010 | NWE | 14-2-0 | 8-0-0 | Lost Div | 12.8 | 14.4 | 11.3 | 1.6 |
| 2005 | CLE | 6-10-0 | 4-4-0 | -4.3 | -2.8 | -5.9 | 1.6 | |
| 2002 | TEN | 11-5-0 | 6-2-0 | Lost Conf | 2.7 | 4.3 | 1.1 | 1.6 |
| 2013 | HOU | 2-14-0 | 1-7-0 | -9.5 | -8.0 | -11.0 | 1.5 | |
| 2010 | ATL | 13-3-0 | 7-1-0 | Lost Div | 7.9 | 9.4 | 6.4 | 1.5 |
| 2006 | CHI | 13-3-0 | 6-2-0 | Lost SB | 10.8 | 12.3 | 9.3 | 1.5 |
| 2010 | OAK | 8-8-0 | 5-3-0 | 2.4 | 3.9 | 1.0 | 1.4 | |
| 2008 | CHI | 9-7-0 | 6-2-0 | 1.6 | 3.0 | 0.1 | 1.4 | |
| 2004 | SFO | 2-14-0 | 1-7-0 | -12.1 | -10.6 | -13.5 | 1.4 | |
| 2004 | WAS | 6-10-0 | 3-5-0 | -1.6 | -0.1 | -3.0 | 1.4 | |
| 2002 | NYG | 10-6-0 | 5-3-0 | Lost WC | 2.6 | 4.0 | 1.1 | 1.4 |
| 2007 | TEN | 10-6-0 | 5-3-0 | Lost WC | 0.3 | 1.6 | -1.1 | 1.4 |
| 2004 | DEN | 10-6-0 | 6-2-0 | Lost WC | 4.8 | 6.1 | 3.5 | 1.3 |
| 2005 | JAX | 12-4-0 | 6-2-0 | Lost WC | 5.8 | 7.0 | 4.5 | 1.3 |
| 2003 | CIN | 8-8-0 | 5-3-0 | -2.4 | -1.1 | -3.6 | 1.3 | |
| 2002 | SFO | 10-6-0 | 5-3-0 | Lost Div | 1.0 | 2.3 | -0.3 | 1.3 |
| 2015 | MIN | 11-5-0 | 6-2-0 | Lost WC | 3.9 | 5.1 | 2.8 | 1.2 |
| 2014 | CIN | 10-5-1 | 5-2-1 | Lost WC | 1.3 | 2.5 | 0.1 | 1.2 |
| 2012 | DET | 4-12-0 | 2-6-0 | -4.1 | -2.9 | -5.3 | 1.2 | |
| 2004 | JAX | 9-7-0 | 4-4-0 | -1.2 | 0.0 | -2.4 | 1.2 | |
| 2004 | NWE | 14-2-0 | 8-0-0 | Won SB | 11.1 | 12.3 | 9.9 | 1.2 |
| 2002 | NYJ | 9-7-0 | 5-3-0 | Lost Div | 1.4 | 2.6 | 0.3 | 1.2 |
| 2014 | TEN | 2-14-0 | 1-7-0 | -11.5 | -10.4 | -12.6 | 1.1 | |
| 2011 | MIA | 6-10-0 | 4-4-0 | 1.0 | 2.1 | -0.1 | 1.1 | |
| 2009 | PIT | 9-7-0 | 6-2-0 | 2.8 | 3.9 | 1.6 | 1.1 | |
| 2002 | BUF | 8-8-0 | 5-3-0 | -1.1 | 0.0 | -2.3 | 1.1 | |
| 2004 | BUF | 9-7-0 | 5-3-0 | 6.9 | 8.0 | 5.9 | 1.1 | |
| 2015 | BUF | 8-8-0 | 5-3-0 | 1.3 | 2.3 | 0.3 | 1.0 | |
| 2014 | CLE | 7-9-0 | 4-4-0 | -2.4 | -1.4 | -3.4 | 1.0 | |
| 2008 | DEN | 8-8-0 | 4-4-0 | -4.9 | -3.9 | -5.9 | 1.0 | |
| 2008 | MIN | 10-6-0 | 6-2-0 | Lost WC | 2.9 | 3.9 | 1.9 | 1.0 |
| 2002 | OAK | 11-5-0 | 6-2-0 | Lost SB | 9.1 | 10.1 | 8.1 | 1.0 |
| 2002 | PHI | 12-4-0 | 7-1-0 | Lost Conf | 10.9 | 11.9 | 9.9 | 1.0 |
| 2014 | MIA | 8-8-0 | 4-4-0 | 0.9 | 1.9 | 0.0 | 0.9 | |
| 2011 | WAS | 5-11-0 | 2-6-0 | -4.9 | -4.0 | -5.9 | 0.9 | |
| 2011 | SEA | 7-9-0 | 4-4-0 | 0.4 | 1.3 | -0.5 | 0.9 | |
| 2008 | PIT | 12-4-0 | 6-2-0 | Won SB | 7.8 | 8.6 | 6.9 | 0.9 |
| 2015 | MIA | 6-10-0 | 3-5-0 | -4.9 | -4.1 | -5.8 | 0.8 | |
| 2011 | NWE | 13-3-0 | 7-1-0 | Lost SB | 10.7 | 11.5 | 9.9 | 0.8 |
| 2003 | IND | 12-4-0 | 5-3-0 | Lost Conf | 6.9 | 7.8 | 6.1 | 0.8 |
| 2010 | JAX | 8-8-0 | 5-3-0 | -4.1 | -3.4 | -4.9 | 0.8 | |
| 2009 | PHI | 11-5-0 | 6-2-0 | Lost WC | 5.8 | 6.5 | 5.0 | 0.8 |
| 2014 | CAR | 7-8-1 | 4-3-1 | Lost Div | -2.2 | -1.5 | -2.9 | 0.7 |
| 2014 | CHI | 5-11-0 | 2-6-0 | -7.7 | -7.0 | -8.4 | 0.7 | |
| 2011 | CLE | 4-12-0 | 3-5-0 | -5.6 | -4.9 | -6.3 | 0.7 | |
| 2008 | KAN | 2-14-0 | 1-7-0 | -9.3 | -8.6 | -10.0 | 0.7 | |
| 2006 | MIA | 6-10-0 | 4-4-0 | -1.4 | -0.8 | -2.1 | 0.7 | |
| 2013 | WAS | 3-13-0 | 2-6-0 | -9.0 | -8.4 | -9.6 | 0.6 | |
| 2012 | WAS | 10-6-0 | 5-3-0 | Lost WC | 3.0 | 3.6 | 2.4 | 0.6 |
| 2002 | CLE | 9-7-0 | 3-5-0 | Lost WC | 1.5 | 2.1 | 0.9 | 0.6 |
| 2013 | IND | 11-5-0 | 6-2-0 | Lost Div | 3.4 | 4.0 | 2.9 | 0.6 |
| 2009 | CAR | 8-8-0 | 5-3-0 | 0.4 | 1.0 | -0.1 | 0.6 | |
| 2007 | ATL | 4-12-0 | 3-5-0 | -9.7 | -9.1 | -10.3 | 0.6 | |
| 2015 | SDG | 4-12-0 | 3-5-0 | -4.9 | -4.4 | -5.4 | 0.5 | |
| 2014 | SFO | 8-8-0 | 4-4-0 | -2.1 | -1.6 | -2.6 | 0.5 | |
| 2011 | NYG | 9-7-0 | 4-4-0 | Won SB | -0.4 | 0.1 | -0.9 | 0.5 |
| 2010 | BUF | 4-12-0 | 2-6-0 | -8.9 | -8.4 | -9.4 | 0.5 | |
| 2007 | DAL | 13-3-0 | 6-2-0 | Lost Div | 8.1 | 8.6 | 7.6 | 0.5 |
| 2006 | CLE | 4-12-0 | 2-6-0 | -7.4 | -6.9 | -7.9 | 0.5 | |
| 2006 | PHI | 10-6-0 | 5-3-0 | Lost Div | 4.4 | 4.9 | 3.9 | 0.5 |
| 2006 | TAM | 4-12-0 | 3-5-0 | -8.9 | -8.4 | -9.4 | 0.5 | |
| 2005 | ATL | 8-8-0 | 4-4-0 | 0.6 | 1.1 | 0.1 | 0.5 | |
| 2010 | PIT | 12-4-0 | 5-3-0 | Lost SB | 8.9 | 9.4 | 8.5 | 0.4 |
| 2002 | HOU | 4-12-0 | 2-6-0 | -8.9 | -8.5 | -9.4 | 0.4 | |
| 2015 | KAN | 11-5-0 | 6-2-0 | Lost Div | 7.4 | 7.8 | 7.0 | 0.4 |
| 2013 | PHI | 10-6-0 | 4-4-0 | Lost WC | 3.8 | 4.1 | 3.4 | 0.4 |
| 2003 | SDG | 4-12-0 | 2-6-0 | -8.0 | -7.6 | -8.4 | 0.4 | |
| 2014 | HOU | 9-7-0 | 5-3-0 | 4.1 | 4.4 | 3.8 | 0.3 | |
| 2007 | NYJ | 4-12-0 | 3-5-0 | -5.4 | -5.1 | -5.8 | 0.3 | |
| 2003 | DAL | 10-6-0 | 6-2-0 | Lost WC | 1.8 | 2.1 | 1.5 | 0.3 |
| 2006 | ATL | 7-9-0 | 3-5-0 | -2.3 | -2.0 | -2.5 | 0.3 | |
| 2010 | MIN | 6-10-0 | 4-4-0 | -4.2 | -4.0 | -4.4 | 0.2 | |
| 2010 | WAS | 6-10-0 | 2-6-0 | -4.7 | -4.5 | -4.9 | 0.2 | |
| 2007 | KAN | 4-12-0 | 2-6-0 | -6.8 | -6.6 | -7.0 | 0.2 | |
| 2013 | MIA | 8-8-0 | 4-4-0 | -1.1 | -1.0 | -1.3 | 0.1 | |
| 2011 | PHI | 8-8-0 | 3-5-0 | 4.3 | 4.4 | 4.1 | 0.1 | |
| 2009 | OAK | 5-11-0 | 2-6-0 | -11.4 | -11.3 | -11.5 | 0.1 | |
| 2006 | TEN | 8-8-0 | 4-4-0 | -4.8 | -4.6 | -4.9 | 0.1 | |
| 2002 | SEA | 7-9-0 | 3-5-0 | -0.9 | -0.8 | -1.0 | 0.1 | |
| 2013 | OAK | 4-12-0 | 3-5-0 | -8.2 | -8.1 | -8.3 | 0.1 | |
| 2010 | NYG | 10-6-0 | 5-3-0 | 2.9 | 3.0 | 2.9 | 0.1 | |
| 2014 | NYG | 6-10-0 | 3-5-0 | -1.3 | -1.3 | -1.3 | 0.0 | |
| 2012 | ATL | 13-3-0 | 7-1-0 | Lost Conf | 7.5 | 7.5 | 7.5 | 0.0 |
| 2011 | KAN | 7-9-0 | 3-5-0 | -7.9 | -7.9 | -7.9 | 0.0 | |
| 2006 | DEN | 9-7-0 | 4-4-0 | 0.9 | 0.9 | 0.9 | 0.0 | |
| 2005 | CAR | 11-5-0 | 5-3-0 | Lost Conf | 8.3 | 8.3 | 8.3 | 0.0 |
| 2002 | TAM | 12-4-0 | 6-2-0 | Won SB | 9.4 | 9.4 | 9.4 | 0.0 |
| 2012 | CIN | 10-6-0 | 4-4-0 | Lost WC | 4.4 | 4.4 | 4.5 | -0.1 |
| 2009 | STL | 1-15-0 | 0-8-0 | -16.3 | -16.4 | -16.3 | -0.1 | |
| 2003 | CAR | 11-5-0 | 6-2-0 | Lost SB | 1.3 | 1.3 | 1.4 | -0.1 |
| 2004 | NYG | 6-10-0 | 3-5-0 | -2.8 | -2.9 | -2.6 | -0.1 | |
| 2003 | NYG | 4-12-0 | 1-7-0 | -9.0 | -9.1 | -8.9 | -0.1 | |
| 2008 | WAS | 8-8-0 | 4-4-0 | -1.9 | -2.1 | -1.8 | -0.2 | |
| 2004 | TEN | 5-11-0 | 2-6-0 | -5.9 | -6.1 | -5.8 | -0.2 | |
| 2003 | TAM | 7-9-0 | 3-5-0 | 2.3 | 2.1 | 2.5 | -0.2 | |
| 2012 | DAL | 8-8-0 | 4-4-0 | -1.5 | -1.8 | -1.3 | -0.3 | |
| 2009 | GNB | 11-5-0 | 6-2-0 | Lost WC | 10.3 | 10.0 | 10.5 | -0.3 |
| 2002 | BAL | 7-9-0 | 4-4-0 | -2.4 | -2.6 | -2.1 | -0.3 | |
| 2002 | IND | 10-6-0 | 5-3-0 | Lost WC | 2.3 | 2.0 | 2.5 | -0.3 |
| 2002 | SDG | 8-8-0 | 5-3-0 | -2.1 | -2.4 | -1.9 | -0.3 | |
| 2009 | HOU | 9-7-0 | 4-4-0 | 3.4 | 3.1 | 3.8 | -0.3 | |
| 2009 | NOR | 13-3-0 | 6-2-0 | Won SB | 10.6 | 10.3 | 10.9 | -0.3 |
| 2005 | NWE | 10-6-0 | 5-3-0 | Lost Div | 2.6 | 2.3 | 2.9 | -0.3 |
| 2010 | CAR | 2-14-0 | 2-6-0 | -13.3 | -13.6 | -12.9 | -0.4 | |
| 2011 | HOU | 10-6-0 | 5-3-0 | Lost Div | 6.4 | 6.0 | 6.9 | -0.4 |
| 2008 | NWE | 11-5-0 | 5-3-0 | 6.3 | 5.9 | 6.8 | -0.4 | |
| 2008 | TEN | 13-3-0 | 7-1-0 | Lost Div | 8.8 | 8.4 | 9.3 | -0.4 |
| 2006 | NYJ | 10-6-0 | 4-4-0 | Lost WC | 1.3 | 0.9 | 1.8 | -0.4 |
| 2003 | ATL | 5-11-0 | 2-6-0 | -7.7 | -8.1 | -7.3 | -0.4 | |
| 2010 | DAL | 6-10-0 | 2-6-0 | -2.6 | -3.1 | -2.1 | -0.5 | |
| 2007 | PHI | 8-8-0 | 3-5-0 | 2.3 | 1.8 | 2.8 | -0.5 | |
| 2015 | DEN | 12-4-0 | 6-2-0 | Won SB | 3.7 | 3.1 | 4.3 | -0.6 |
| 2015 | PHI | 7-9-0 | 3-5-0 | -3.3 | -3.9 | -2.8 | -0.6 | |
| 2005 | HOU | 2-14-0 | 2-6-0 | -10.7 | -11.3 | -10.1 | -0.6 | |
| 2004 | NOR | 8-8-0 | 3-5-0 | -3.6 | -4.1 | -3.0 | -0.6 | |
| 2011 | TEN | 9-7-0 | 5-3-0 | 0.5 | -0.1 | 1.1 | -0.6 | |
| 2005 | IND | 14-2-0 | 7-1-0 | Lost Div | 12.0 | 11.4 | 12.6 | -0.6 |
| 2010 | CLE | 5-11-0 | 3-5-0 | -3.8 | -4.5 | -3.1 | -0.7 | |
| 2002 | PIT | 10-5-1 | 5-2-1 | Lost Div | 2.8 | 2.1 | 3.5 | -0.7 |
| 2012 | NYJ | 6-10-0 | 3-5-0 | -5.9 | -6.8 | -5.0 | -0.9 | |
| 2009 | NYJ | 9-7-0 | 4-4-0 | Lost Conf | 7.0 | 6.1 | 7.9 | -0.9 |
| 2008 | BUF | 7-9-0 | 3-5-0 | -0.4 | -1.3 | 0.5 | -0.9 | |
| 2007 | IND | 13-3-0 | 6-2-0 | Lost Div | 11.8 | 10.9 | 12.6 | -0.9 |
| 2004 | CAR | 7-9-0 | 3-5-0 | 1.0 | 0.1 | 1.9 | -0.9 | |
| 2014 | WAS | 4-12-0 | 3-5-0 | -8.6 | -9.5 | -7.6 | -0.9 | |
| 2012 | CHI | 10-6-0 | 5-3-0 | 6.1 | 5.1 | 7.1 | -1.0 | |
| 2011 | OAK | 8-8-0 | 3-5-0 | -4.6 | -5.6 | -3.6 | -1.0 | |
| 2011 | CIN | 9-7-0 | 4-4-0 | Lost WC | 1.3 | 0.3 | 2.4 | -1.1 |
| 2004 | GNB | 10-6-0 | 4-4-0 | Lost WC | 2.8 | 1.6 | 3.9 | -1.1 |
| 2002 | NOR | 9-7-0 | 4-4-0 | 2.8 | 1.6 | 3.9 | -1.1 | |
| 2014 | TAM | 2-14-0 | 0-8-0 | -8.3 | -9.5 | -7.1 | -1.2 | |
| 2005 | CIN | 11-5-0 | 5-3-0 | Lost WC | 4.4 | 3.3 | 5.6 | -1.2 |
| 2008 | JAX | 5-11-0 | 2-6-0 | -4.1 | -5.4 | -2.8 | -1.3 | |
| 2015 | CIN | 12-4-0 | 6-2-0 | Lost WC | 8.8 | 7.4 | 10.1 | -1.4 |
| 2007 | MIA | 1-15-0 | 1-7-0 | -10.6 | -12.0 | -9.3 | -1.4 | |
| 2012 | NWE | 12-4-0 | 6-2-0 | Lost Conf | 14.1 | 12.6 | 15.6 | -1.5 |
| 2015 | BAL | 5-11-0 | 3-5-0 | -4.6 | -6.1 | -3.0 | -1.6 | |
| 2007 | NOR | 7-9-0 | 3-5-0 | -0.6 | -2.1 | 1.0 | -1.6 | |
| 2006 | STL | 8-8-0 | 4-4-0 | -0.9 | -2.6 | 0.9 | -1.8 | |
| 2004 | CHI | 5-11-0 | 2-6-0 | -6.3 | -8.0 | -4.5 | -1.8 | |
| 2010 | NOR | 11-5-0 | 5-3-0 | Lost WC | 4.8 | 3.0 | 6.6 | -1.8 |
| 2005 | PIT | 11-5-0 | 5-3-0 | Won SB | 8.2 | 6.4 | 10.0 | -1.8 |
| 2015 | TAM | 6-10-0 | 3-5-0 | -4.7 | -6.6 | -2.8 | -1.9 | |
| 2011 | DEN | 8-8-0 | 3-5-0 | Lost Div | -5.1 | -7.0 | -3.1 | -1.9 |
| 2015 | TEN | 3-13-0 | 1-7-0 | -7.8 | -9.9 | -5.6 | -2.1 | |
| 2013 | SFO | 12-4-0 | 6-2-0 | Lost Conf | 8.4 | 6.3 | 10.5 | -2.1 |
| 2002 | NWE | 9-7-0 | 5-3-0 | 2.2 | 0.0 | 4.4 | -2.2 | |
| 2015 | CHI | 6-10-0 | 1-7-0 | -3.9 | -6.1 | -1.6 | -2.3 | |
| 2010 | PHI | 10-6-0 | 4-4-0 | Lost WC | 3.9 | 1.6 | 6.1 | -2.3 |
| 2009 | DEN | 8-8-0 | 4-4-0 | 0.1 | -2.1 | 2.4 | -2.3 | |
| 2003 | PHI | 12-4-0 | 5-3-0 | Lost Conf | 5.4 | 3.1 | 7.8 | -2.3 |
| 2002 | CIN | 2-14-0 | 1-7-0 | -11.1 | -13.4 | -8.8 | -2.3 | |
| 2015 | SEA | 10-6-0 | 5-3-0 | Lost Div | 9.1 | 6.8 | 11.5 | -2.4 |
| 2006 | CIN | 8-8-0 | 4-4-0 | 2.6 | 0.3 | 5.0 | -2.4 | |
| 2009 | IND | 14-2-0 | 7-1-0 | Lost SB | 6.8 | 4.4 | 9.3 | -2.4 |
| 2012 | SDG | 7-9-0 | 3-5-0 | 0.0 | -2.5 | 2.5 | -2.5 | |
| 2006 | DAL | 9-7-0 | 4-4-0 | Lost WC | 4.7 | 2.1 | 7.3 | -2.6 |
| 2009 | WAS | 4-12-0 | 3-5-0 | -4.4 | -7.0 | -1.8 | -2.6 | |
| 2009 | SDG | 13-3-0 | 6-2-0 | Lost Div | 8.4 | 5.6 | 11.1 | -2.8 |
| 2010 | MIA | 7-9-0 | 1-7-0 | -3.8 | -6.6 | -0.9 | -2.9 | |
| 2012 | JAX | 2-14-0 | 1-7-0 | -11.8 | -14.8 | -8.9 | -2.9 | |
| 2015 | ARI | 13-3-0 | 6-2-0 | Lost Conf | 11.0 | 8.0 | 14.0 | -3.0 |
| 2015 | DAL | 4-12-0 | 1-7-0 | -6.2 | -9.3 | -3.1 | -3.1 | |
| 2014 | NOR | 7-9-0 | 3-5-0 | -1.4 | -4.5 | 1.6 | -3.1 | |
| 2003 | WAS | 5-11-0 | 3-5-0 | -5.3 | -8.4 | -2.3 | -3.1 | |
| 2015 | OAK | 7-9-0 | 3-5-0 | -2.5 | -5.6 | 0.6 | -3.1 | |
| 2012 | STL | 7-8-1 | 4-3-1 | -3.1 | -6.3 | 0.1 | -3.2 | |
| 2008 | OAK | 5-11-0 | 2-6-0 | -7.8 | -11.0 | -4.6 | -3.2 | |
| 2006 | CAR | 8-8-0 | 4-4-0 | -2.2 | -5.4 | 1.0 | -3.2 | |
| 2006 | NYG | 8-8-0 | 3-5-0 | Lost WC | -0.4 | -3.6 | 2.8 | -3.2 |
| 2013 | JAX | 4-12-0 | 1-7-0 | -12.6 | -15.9 | -9.4 | -3.3 | |
| 2009 | KAN | 4-12-0 | 1-7-0 | -8.1 | -11.4 | -4.9 | -3.3 | |
| 2004 | DET | 6-10-0 | 3-5-0 | -3.4 | -6.6 | -0.1 | -3.3 | |
| 2010 | TAM | 10-6-0 | 4-4-0 | 1.4 | -1.9 | 4.8 | -3.3 | |
| 2006 | MIN | 6-10-0 | 3-5-0 | -2.8 | -6.1 | 0.5 | -3.3 | |
| 2010 | CHI | 11-5-0 | 5-3-0 | Lost Conf | 3.0 | -0.5 | 6.5 | -3.5 |
| 2008 | MIA | 11-5-0 | 5-3-0 | Lost WC | 1.8 | -1.9 | 5.4 | -3.6 |
| 2007 | CAR | 7-9-0 | 2-6-0 | -5.0 | -8.6 | -1.4 | -3.6 | |
| 2003 | MIA | 10-6-0 | 4-4-0 | 3.1 | -0.5 | 6.8 | -3.6 | |
| 2012 | CAR | 7-9-0 | 3-5-0 | -0.4 | -4.6 | 3.9 | -4.3 | |
| 2014 | DAL | 12-4-0 | 4-4-0 | Lost Div | 7.2 | 2.6 | 11.8 | -4.6 |
| 2009 | ARI | 10-6-0 | 4-4-0 | Lost Div | 3.1 | -1.5 | 7.8 | -4.6 |
| 2006 | NWE | 12-4-0 | 5-3-0 | Lost Conf | 9.3 | 4.5 | 14.0 | -4.8 |
| 2013 | KAN | 11-5-0 | 5-3-0 | Lost WC | 7.8 | 2.9 | 12.8 | -4.9 |
| 2006 | GNB | 8-8-0 | 3-5-0 | -4.1 | -9.0 | 0.9 | -4.9 | |
| 2006 | NOR | 10-6-0 | 4-4-0 | Lost Conf | 5.7 | 0.8 | 10.6 | -4.9 |
| 2007 | NYG | 10-6-0 | 3-5-0 | Won SB | 1.4 | -3.8 | 6.5 | -5.1 |
| 2009 | TAM | 3-13-0 | 1-7-0 | -9.8 | -15.8 | -3.8 | -6.0 | |
| 2008 | DET | 0-16-0 | 0-8-0 | -15.6 | -22.0 | -9.1 | -6.4 |
The most important thing to note about team-specific HFA is that it is wildly unpredictable, as we should expect considering the ups and downs of teams’ fortunes from season to season. Probably the best example of this is the 2003 49ers. Here’s a plot of San Francisco’s HFA numbers since 2002:

Their point differential at home in 2003 was 16.3, on the road it was -10.4, making for an observed HFA of 13.3, the league highest since 2002. But what about the year before and year after? In 2002, it was 1.3, the following year, 1.4. The graph above, with its drastic spikes, is fairly typical of every NFL team.
So, beyond general interest and trivia, the single season numbers don’t tell us much. But taking each team’s average over a longer period of time does give us numbers that go along with our common consensus, e.g., “Seattle has great home field advantage, the Panthers, not so much”. Below is a table of each team’s HFA using data since 2002: [4]Notes on the table: 1. Games played in other countries are treated as they are billed; e.g., the Arizona Cardinals were the “home team” in their game against the 49ers when they played at Azteca … Continue reading
| Rk | Team | Stadium *for the 2015 season* (year first used) | Tot W/L% | Home W/L% | Tot MoV | Home MoV | Away MoV | Obs HFA |
|---|---|---|---|---|---|---|---|---|
| 1 | BAL | M&T Bank Stadium (1998) | 0.567 | 0.732 | 2.9 | 7.4 | -1.6 | 4.5 |
| 2 | SEA | CenturyLink Field (2002) | 0.567 | 0.696 | 3.0 | 7.3 | -1.2 | 4.2 |
| 3 | ARI | University of Phoenix Stadium (2006) | 0.464 | 0.598 | -2.5 | 1.6 | -6.6 | 4.1 |
| 4 | SFO | Levi's Stadium (2014) | 0.469 | 0.571 | -1.7 | 2.4 | -5.8 | 4.1 |
| 5 | GNB | Lambeau Field (1957) | 0.625 | 0.705 | 4.9 | 8.7 | 1.1 | 3.8 |
| 6 | STL | Edward Jones Dome (1995) | 0.371 | 0.464 | -5.2 | -1.5 | -8.8 | 3.7 |
| 7 | DET | Ford Field (2002) | 0.339 | 0.438 | -4.6 | -1.1 | -8.2 | 3.5 |
| 8 | MIN | Mall of America Field (1982) | 0.491 | 0.634 | 0.0 | 3.5 | -3.5 | 3.5 |
| 9 | BUF | Ralph Wilson Stadium (1973) | 0.420 | 0.509 | -2.2 | 1.0 | -5.5 | 3.3 |
| 10 | KAN | Arrowhead Stadium (1972) | 0.478 | 0.563 | 0.0 | 2.9 | -3.0 | 3.0 |
| 11 | NYJ | MetLife Stadium (2010) | 0.482 | 0.563 | -0.4 | 2.4 | -3.3 | 2.9 |
| 12 | PIT | Heinz Field (2001) | 0.634 | 0.714 | 4.7 | 7.5 | 1.8 | 2.8 |
| 13 | JAX | EverBank Field (1995) | 0.402 | 0.491 | -3.1 | -0.5 | -5.7 | 2.6 |
| 14 | HOU | NRG Stadium (2002) | 0.433 | 0.500 | -2.0 | 0.5 | -4.6 | 2.6 |
| 15 | SDG | Qualcomm Stadium (1967) | 0.558 | 0.634 | 3.3 | 5.8 | 0.8 | 2.5 |
| 16 | IND | Lucas Oil Stadium (2008) | 0.679 | 0.732 | 3.8 | 6.3 | 1.3 | 2.5 |
| 17 | ATL | Georgia Dome (1992) | 0.527 | 0.598 | 0.3 | 2.7 | -2.2 | 2.4 |
| 18 | DEN | Sports Authority Field at Mile High (2001) | 0.607 | 0.679 | 2.5 | 4.8 | 0.3 | 2.3 |
| 19 | CHI | Soldier Field (1971) | 0.496 | 0.554 | -0.6 | 1.7 | -2.8 | 2.3 |
| 20 | NOR | Louisiana Superdome (1975) | 0.545 | 0.571 | 2.1 | 4.2 | 0.0 | 2.1 |
| 21 | CLE | FirstEnergy Stadium (1999) | 0.335 | 0.393 | -4.8 | -2.8 | -6.8 | 2.0 |
| 22 | DAL | AT&T Stadium (2009) | 0.527 | 0.554 | 0.5 | 2.4 | -1.3 | 1.9 |
| 23 | TEN | Nissan Stadium (1999) | 0.464 | 0.500 | -2.2 | -0.3 | -4.0 | 1.8 |
| 24 | NWE | Gillette Stadium (2002) | 0.763 | 0.848 | 9.3 | 11.1 | 7.5 | 1.8 |
| 25 | NYG | MetLife Stadium (2010) | 0.518 | 0.518 | 0.4 | 1.8 | -1.1 | 1.4 |
| 26 | OAK | O.co Coliseum (1995) | 0.330 | 0.384 | -5.9 | -4.5 | -7.3 | 1.4 |
| 27 | WAS | FedExField (1997) | 0.406 | 0.464 | -2.8 | -1.4 | -4.2 | 1.4 |
| 28 | PHI | Lincoln Financial Field (2003) | 0.580 | 0.580 | 3.0 | 4.4 | 1.7 | 1.4 |
| 29 | CIN | Paul Brown Stadium (2000) | 0.509 | 0.571 | 0.2 | 1.6 | -1.1 | 1.3 |
| 30 | TAM | Raymond James Stadium (1998) | 0.415 | 0.455 | -2.2 | -1.0 | -3.4 | 1.2 |
| 31 | MIA | Sun Life Stadium (1987) | 0.442 | 0.482 | -1.3 | -0.3 | -2.4 | 1.1 |
| 32 | CAR | Bank of America Stadium (1996) | 0.536 | 0.571 | 0.6 | 1.6 | -0.3 | 1.0 |
Some thoughts:
1. Having a high HFA number doesn’t necessarily mean that a team was consistently outscoring their opponents at home, or even had a winning record there; it simply implies that they’re better at home than on the road. The St. Louis Rams had a losing record (0.464) and a -1.5 margin of victory at the Edward Jones Dome since 2002, but were even worse on the road, losing by an abysmal 8.8 points per game during that same period. This gives them a healthy HFA of 3.7, but they’re certainly not “dominant at home” the way Green Bay is, who have a similar HFA.
2. If you’re looking for another reason to hate – or love – the Patriots, look no further: since 2002, they have a road point differential of +7.5, easily the best in the league (maybe the best in history) and far ahead of second place Pittsburgh at +1.8. Granted, a good chunk of this comes from two epic seasons – 2007 and 2012, in which they clobbered teams on the road by an average of 17.9 and 15.6 points, respectively – but it’s still remarkable. Since they also dominated at home during this period, winning by an average of 11.1 points, their observed HFA is a lowly 1.8, the 24th “worst” in the league.
3. As mentioned above, and as can be seen by the standard deviation numbers in the tables, using these HFA numbers for predictive purposes might be a fool’s errand. But, on the flip side, if we do agree that, say, the Packers have a better home field advantage at Lambeau Field than the Dolphins at Sun Life Stadium, than these numbers are a good place to start.
Finally, I thought it might be interesting to see which teams have the toughest schedule by combining their average opponent’s HFA and their average opponent’s 2015 SRS ratings. Note that this was written before last night’s game.
| Rnk | Team | Avg Road Opp HFA | Avg Road Opp SRS (2015) | 2016 Road SOS |
|---|---|---|---|---|
| 1 | MIA | 3.0 | 3.2 | 6.3 |
| 2 | BUF | 2.6 | 2.7 | 5.3 |
| 3 | SFO | 2.8 | 2.5 | 5.2 |
| 4 | NYJ | 2.8 | 2.3 | 5.1 |
| 5 | STL | 3.0 | 1.5 | 4.5 |
| 6 | NWE | 2.8 | 1.2 | 4.1 |
| 7 | ARI | 2.9 | 1.1 | 4.0 |
| 8 | SEA | 3.0 | 0.8 | 3.7 |
| 9 | PHI | 2.6 | 0.8 | 3.3 |
| 10 | KAN | 2.2 | 1.1 | 3.3 |
| 11 | NOR | 2.5 | 0.8 | 3.3 |
| 12 | TAM | 2.6 | 0.5 | 3.1 |
| 13 | WAS | 2.6 | 0.6 | 3.1 |
| 14 | ATL | 2.2 | 0.7 | 2.9 |
| 15 | SDG | 2.1 | 0.7 | 2.8 |
| 16 | BAL | 2.1 | 0.5 | 2.6 |
| 17 | NYG | 2.5 | 0.0 | 2.5 |
| 18 | IND | 2.6 | -0.1 | 2.5 |
| 19 | HOU | 2.5 | -0.1 | 2.3 |
| 20 | DAL | 2.5 | -0.2 | 2.3 |
| 21 | CIN | 2.5 | -0.3 | 2.2 |
| 22 | CAR | 2.3 | -0.4 | 1.9 |
| 23 | CLE | 2.2 | -0.8 | 1.4 |
| 24 | JAX | 2.7 | -1.6 | 1.1 |
| 25 | CHI | 2.6 | -1.8 | 0.7 |
| 26 | DET | 2.5 | -1.8 | 0.7 |
| 27 | MIN | 2.2 | -1.6 | 0.6 |
| 28 | TEN | 2.5 | -2.1 | 0.4 |
| 29 | DEN | 2.0 | -2.0 | 0.1 |
| 30 | PIT | 2.2 | -2.2 | 0.0 |
| 31 | OAK | 2.5 | -2.8 | -0.3 |
| 32 | GNB | 2.4 | -3.0 | -0.6 |
After the usual caveats – 2015 SRS numbers might be meaningless (Vegas projections would be better), and the already noted volatility of the HFA numbers – we can see that it’s going to be a tough year for Miami. Like the other brethren of AFC East, the Dolphins have to take on two of the meanest divisions in football, the NFC West and the AFC North; on top of that, their opener is in Seattle, and they have winter games in Baltimore, New York (the Jets) and Buffalo. Their two-week stay on the West Coast against the Chargers and Rams in November might seem like a vacation.
As always, would love to hear any comments, [5]Chase comment: What do we make of the Jets at MetLife vs. the Giants? Perhaps fodder for another post. thanks for reading.
References
| ↑1 | The HFA number during the playoffs over that same period is 6.5, but that’s probably due to playoff seeding than fan/stadium involvement; it might be interesting to look into this further. |
|---|---|
| ↑2 | As far as what causes home teams to have an advantage at home, Brian Burke suggests in this article that it has more to do with environmental familiarity, and other factors, than the effect of screaming fans. |
| ↑3 | Bill Barnwell used this method in a nice article back in 2012. At the time, the Seahawks had the best home field advantage at 5.2 points; since then, they’ve regressed down to a still strong 4.2 points – and have since been surpassed by the Ravens who currently have a 4.5-point HFA. |
| ↑4 | Notes on the table: 1. Games played in other countries are treated as they are billed; e.g., the Arizona Cardinals were the “home team” in their game against the 49ers when they played at Azteca Stadium in Mexico City in 2005. 2. For teams with stadiums built after 2002 – the Eagles, Cardinals, Colts, Cowboys, Giants, Jets and 49ers – the HFA data obviously includes the team’s previous stadium (for the 49ers, that means 12 years of Candlestick Park). However, I have included the stadium information in each cell in case you want to run your own research. 3. For predictive purposes for the Rams, now that they’re in LA, I’ll probably use the standard 2.7 points for HFA. |
| ↑5 | Chase comment: What do we make of the Jets at MetLife vs. the Giants? Perhaps fodder for another post. |