
Quite the clickbait title, I know. But given where this post is going, I thought precision was more important than anything else.
Over the last three seasons, Seattle has allowed 15.2 points per game. That’s really, really good. How good?

There are flaws with using points allowed as a measure of defensive play, of course. Seattle is known for its long drives on offense, which limits the number of possessions an opponent might have. And the Seahawks offense generally puts the team’s defense in pretty good situations. Using points allowed per drive might be preferable, or using DVOA, or EPA per drive, or a host of other metrics. And adjusting these results for strength of schedule (or, at least, removing non-offensive scores) would make sense, too.
But hey, it’s Friday, and I wanted to keep things relatively simple. [1]In about ten minutes, we can all have a good laugh at this line. Points allowed is a number we can all understand. Given our era of inflating offenses, it’s quite possible that Seattle’s 15.2 points per game average doesn’t stand out as particularly impressive to you. After all, the ’76 Steelers once allowed 28 points over a nine-game stretch! But consider that since 2012, the NFL average has been 22.6 points per game, which means the Seahawks have allowed 7.4 fewer points per game than the average defense.
How good is that?
In short, it depends. Do you remember the 1973-1975 Rams? Those great defenses were littered with star players like Jack Youngblood, Isiah Robertson, Merlin Olsen, Fred Dryer, and Jack Reynolds. Los Angeles went 34-8 over that period, and finished 4th, 1st, and 1st in points allowed during those three years. [2]Of course, Seattle has ranked 1st, 1st, and 1st. In total, the Rams allowed just 11.8 points per game during that run, while the average NFL defense allowed 20.6 points per game. So the Rams allowed 8.8 fewer points per game than the average team.
On the surface, that sounds better than these current Seahawks. And perhaps it is. But remember the picture above: what is interesting about Seattle is not just how dominant they’ve been, but how uniquely dominant they’ve been. For example, let’s create the exact same chart but for the years 1973 to 1975:

You can probably eyeball that the numbers are all lower, and maybe you can even eyeball the fact that the old Rams are farther from average than the modern Seahawks. But perhaps the most striking observation is that the 2012-2014 Seahawks just look like more of an outlier than the 1973-1975 Rams. After all, the Vikings were only 1.1 points behind Los Angeles, and the Steelers were only a half point behind the Vikings (and the Dolphins about the same behind the Steelers). Meanwhile, Seattle is 3.2 points per game ahead of its nearest competition (the 49ers), and an five points per game ahead of the third-place team, Cincinnati.
So the modern Seahawks really do look like a big outlier in their era when it comes to preventing points. There’s a statistical way to measure this, of course, using Z-Scores and standard deviations. Regular readers (or the Seahawks fans who have developed a history of frequenting this site in late January) may recall I used Z-Scores to put Seattle’s incredible pass defense last season in historical perspective. There are legitimate questions about whether this sort of data is an appropriate use of Z-scores, but we can debate that in the comments. For now, allow me to present the data. Here’s what I did:
1) Calculate the points allowed per game for each franchise for every three-year period in franchise history. [3]Note: I took an average of the average points allowed per game for each season, choosing to treat each season as equals, regardless of the number of games. Reasonable minds could differ on whether … Continue reading For the 2014 Seahawks, this is 15.2.
2) Calculate the average points allowed per game in the NFL (or AFL) for each 3-year period. For the 2012-2014 NFL, this is 22.6.
3) Calculate how far above or below average each defense was. For the 2014 Seahawks, this number if +7.4 (treating being below average as positive).
4) Calculate the standard deviation of points allowed per game over each three year period by each franchise. So for 2012-2014, I calculated the standard deviation of Seattle’s 15.2, San Francisco’s 18.4, Cincinnati’s 20.2, etc. For the 2012-2014 NFL, this is 2.70.
5) Divide the result in step 3 by the result in step 4 to calculate the Z-score. For the 2012-2014 Seahawks, this is +2.73, which means the Seahawks have been 2.73 standard deviations above average at preventing points.
So you know that Richard Sherman, Earl Thomas, Kam Chancellor, and the Legion of Boom are pretty good. How good? Well, that +2.73 number is the best in history. Below are the top 100 Z-scores: [4]Note that I did not write top 100 defenses!
| Rk | Team | Years | 3Yr PA/G | Avg | Diff | Lg StDv | Z-Score |
|---|---|---|---|---|---|---|---|
| 1 | SEA | 2012--2014 | 15.2 | 22.6 | 7.4 | 2.7 | 2.73 |
| 2 | SFO | 2011--2013 | 16.1 | 23.4 | 7.3 | 2.7 | 2.69 |
| 3 | DAL | 1993--1995 | 16 | 21.4 | 5.4 | 2.05 | 2.63 |
| 4 | MIN | 1969--1971 | 9.9 | 19.4 | 9.5 | 3.64 | 2.6 |
| 5 | CHI | 1985--1987 | 14.3 | 21.6 | 7.3 | 2.84 | 2.58 |
| 6 | SEA | 2011--2013 | 16.5 | 23.4 | 6.9 | 2.7 | 2.56 |
| 7 | PIT | 2010--2012 | 16.1 | 22.8 | 6.7 | 2.6 | 2.56 |
| 8 | DEN | 1977--1979 | 13.1 | 20.1 | 7 | 2.74 | 2.54 |
| 9 | PHI | 2000--2002 | 14.5 | 21.7 | 7.2 | 2.92 | 2.46 |
| 10 | GNB | 1945--1947 | 16.4 | 22 | 5.6 | 2.33 | 2.39 |
| 11 | PIT | 2009--2011 | 16.3 | 22.2 | 5.9 | 2.46 | 2.38 |
| 12 | RAM | 1973--1975 | 11.8 | 20.6 | 8.8 | 3.75 | 2.36 |
| 13 | CHI | 1986--1988 | 14.6 | 20.3 | 5.6 | 2.44 | 2.3 |
| 14 | DAL | 1992--1994 | 15 | 20.3 | 5.3 | 2.29 | 2.29 |
| 15 | CHI | 1984--1986 | 13.2 | 20.5 | 7.3 | 3.23 | 2.27 |
| 16 | TAM | 2002--2004 | 15.9 | 21.5 | 5.6 | 2.45 | 2.27 |
| 17 | BAL | 2009--2011 | 16.6 | 22.2 | 5.6 | 2.46 | 2.26 |
| 18 | GNB | 1963--1965 | 16.1 | 23.1 | 7 | 3.09 | 2.26 |
| 19 | MIA | 1981--1983 | 15.8 | 21.8 | 6 | 2.71 | 2.23 |
| 20 | BAL | 2008--2010 | 16.1 | 22 | 5.9 | 2.69 | 2.19 |
| 21 | PIT | 2008--2010 | 16.2 | 22 | 5.8 | 2.69 | 2.16 |
| 22 | PHI | 1979--1981 | 15.1 | 20.7 | 5.6 | 2.62 | 2.13 |
| 23 | PIT | 1992--1994 | 15.4 | 20.3 | 4.8 | 2.29 | 2.11 |
| 24 | NYG | 1925--1927 | 3.7 | 9.8 | 6.1 | 2.91 | 2.1 |
| 25 | TAM | 2000--2002 | 15.5 | 21.7 | 6.1 | 2.92 | 2.1 |
| 26 | NYG | 1937--1939 | 8.3 | 15.4 | 7.1 | 3.39 | 2.1 |
| 27 | GNB | 1962--1964 | 14.3 | 22 | 7.8 | 3.73 | 2.08 |
| 28 | PHI | 2002--2004 | 16.4 | 21.5 | 5.1 | 2.45 | 2.07 |
| 29 | MIN | 1973--1975 | 12.9 | 20.6 | 7.7 | 3.75 | 2.05 |
| 30 | PHI | 2001--2003 | 15.3 | 20.7 | 5.4 | 2.65 | 2.04 |
| 31 | MIN | 1970--1972 | 12.7 | 20.3 | 7.5 | 3.71 | 2.03 |
| 32 | TAM | 2001--2003 | 15.4 | 20.7 | 5.3 | 2.65 | 2.01 |
| 33 | BAL | 1999--2001 | 14.7 | 20.2 | 5.5 | 2.73 | 2.01 |
| 34 | PIT | 2006--2008 | 16.8 | 22 | 5.2 | 2.61 | 2 |
| 35 | KAN | 1993--1995 | 17.3 | 21.4 | 4.1 | 2.05 | 2 |
| 36 | CHI | 2005--2007 | 16.8 | 21.7 | 4.9 | 2.47 | 1.99 |
| 37 | SFO | 2010--2012 | 17.7 | 22.8 | 5.1 | 2.6 | 1.96 |
| 38 | CHI | 1983--1985 | 15.6 | 21.5 | 6 | 3.07 | 1.94 |
| 39 | PIT | 1973--1975 | 13.4 | 20.6 | 7.2 | 3.75 | 1.93 |
| 40 | NWE | 2006--2008 | 17.1 | 22 | 4.9 | 2.61 | 1.9 |
| 41 | CHI | 1941--1943 | 12.2 | 19.5 | 7.2 | 3.81 | 1.89 |
| 42 | NYG | 1938--1940 | 9 | 15.1 | 6.1 | 3.21 | 1.89 |
| 43 | SFO | 1985--1987 | 16.2 | 21.6 | 5.4 | 2.84 | 1.88 |
| 44 | PIT | 1993--1995 | 17.5 | 21.4 | 3.9 | 2.05 | 1.88 |
| 45 | CLE | 1952--1954 | 14.9 | 21.8 | 6.8 | 3.66 | 1.87 |
| 46 | CLE | 1956--1958 | 15.7 | 22.6 | 6.9 | 3.67 | 1.87 |
| 47 | MIA | 1982--1984 | 16.3 | 21.2 | 4.9 | 2.64 | 1.87 |
| 48 | CLE | 1953--1955 | 15.1 | 20.8 | 5.8 | 3.1 | 1.87 |
| 49 | RAM | 1977--1979 | 15 | 20.1 | 5 | 2.74 | 1.84 |
| 50 | PIT | 1974--1976 | 11.6 | 18.3 | 6.7 | 3.62 | 1.84 |
| 51 | MIA | 1971--1973 | 11.8 | 19.5 | 7.7 | 4.17 | 1.84 |
| 52 | TAM | 1997--1999 | 16.5 | 20.8 | 4.3 | 2.33 | 1.84 |
| 53 | BAL | 2006--2008 | 17.3 | 22 | 4.8 | 2.61 | 1.83 |
| 54 | GNB | 1961--1963 | 13.7 | 22 | 8.2 | 4.52 | 1.83 |
| 55 | GNB | 1996--1998 | 16.9 | 21.3 | 4.4 | 2.4 | 1.82 |
| 56 | GNB | 1929--1931 | 5.3 | 9.9 | 4.6 | 2.54 | 1.82 |
| 57 | BAL | 2000--2002 | 16.3 | 21.7 | 5.3 | 2.92 | 1.82 |
| 58 | PHI | 1978--1980 | 15.7 | 20.5 | 4.8 | 2.63 | 1.82 |
| 59 | KAN | 1995--1997 | 16.1 | 20.7 | 4.6 | 2.54 | 1.82 |
| 60 | GNB | 1960--1962 | 14.6 | 21.8 | 7.1 | 3.93 | 1.82 |
| 61 | SFO | 1993--1995 | 17.7 | 21.4 | 3.7 | 2.05 | 1.81 |
| 62 | NYG | 1993--1995 | 17.7 | 21.4 | 3.7 | 2.05 | 1.8 |
| 63 | MIA | 1970--1972 | 13.6 | 20.3 | 6.6 | 3.71 | 1.78 |
| 64 | NYG | 1939--1941 | 10.1 | 16.5 | 6.4 | 3.6 | 1.78 |
| 65 | PHI | 1945--1947 | 17.8 | 22 | 4.1 | 2.33 | 1.77 |
| 66 | SFO | 2009--2011 | 17.8 | 22.2 | 4.3 | 2.46 | 1.77 |
| 67 | PHI | 1948--1950 | 12 | 22.3 | 10.3 | 5.86 | 1.76 |
| 68 | SFO | 1995--1997 | 16.3 | 20.7 | 4.5 | 2.54 | 1.76 |
| 69 | MIA | 1973--1975 | 14 | 20.6 | 6.6 | 3.75 | 1.76 |
| 70 | NYG | 1988--1990 | 16 | 20.1 | 4.1 | 2.36 | 1.76 |
| 71 | MIN | 1968--1970 | 12.3 | 19.3 | 6.9 | 3.97 | 1.74 |
| 72 | PIT | 1977--1979 | 15.3 | 20.1 | 4.8 | 2.74 | 1.74 |
| 73 | RAM | 1974--1976 | 12 | 18.3 | 6.3 | 3.62 | 1.73 |
| 74 | MIA | 1977--1979 | 15.3 | 20.1 | 4.7 | 2.74 | 1.73 |
| 75 | WAS | 1941--1943 | 12.9 | 19.5 | 6.5 | 3.81 | 1.71 |
| 76 | BAL | 2010--2012 | 18.3 | 22.8 | 4.4 | 2.6 | 1.7 |
| 77 | BAL | 1998--2000 | 16.2 | 20.7 | 4.5 | 2.64 | 1.7 |
| 78 | SFO | 1983--1985 | 16.3 | 21.5 | 5.2 | 3.07 | 1.7 |
| 79 | PIT | 1978--1980 | 16 | 20.5 | 4.4 | 2.63 | 1.69 |
| 80 | CLE | 1992--1994 | 16.4 | 20.3 | 3.9 | 2.29 | 1.69 |
| 81 | BAL | 2004--2006 | 16 | 20.7 | 4.7 | 2.75 | 1.69 |
| 82 | NYG | 1956--1958 | 16.4 | 22.6 | 6.2 | 3.67 | 1.68 |
| 83 | GNB | 1964--1966 | 15 | 21 | 6 | 3.57 | 1.68 |
| 84 | CLE | 1951--1953 | 14.6 | 20.8 | 6.2 | 3.67 | 1.68 |
| 85 | PIT | 2005--2007 | 17.5 | 21.7 | 4.1 | 2.47 | 1.68 |
| 86 | CHI | 1932--1934 | 5.4 | 8.2 | 2.8 | 1.7 | 1.68 |
| 87 | DAL | 1994--1996 | 16.4 | 20.4 | 4 | 2.37 | 1.67 |
| 88 | PIT | 1945--1947 | 18.1 | 22 | 3.9 | 2.33 | 1.66 |
| 89 | DEN | 1976--1978 | 12.6 | 18.3 | 5.8 | 3.48 | 1.66 |
| 90 | CLE | 1987--1989 | 16.6 | 20.6 | 4 | 2.43 | 1.65 |
| 91 | PIT | 2011--2013 | 19 | 23.4 | 4.4 | 2.7 | 1.64 |
| 92 | JAX | 2005--2007 | 17.6 | 21.7 | 4 | 2.47 | 1.64 |
| 93 | CLE | 1954--1956 | 15.5 | 20.4 | 4.9 | 3 | 1.64 |
| 94 | CLE | 1993--1995 | 18.1 | 21.4 | 3.3 | 2.05 | 1.62 |
| 95 | NWE | 2005--2007 | 17.7 | 21.7 | 4 | 2.47 | 1.62 |
| 96 | PIT | 2000--2002 | 16.9 | 21.7 | 4.7 | 2.92 | 1.62 |
| 97 | TAM | 1977--1979 | 15.6 | 20.1 | 4.4 | 2.74 | 1.62 |
| 98 | NYG | 1941--1943 | 13.3 | 19.5 | 6.1 | 3.81 | 1.61 |
| 99 | SFO | 1984--1986 | 15.4 | 20.5 | 5.2 | 3.23 | 1.6 |
| 100 | DEN | 1978--1980 | 16.3 | 20.5 | 4.2 | 2.63 | 1.59 |
There are some reasons to like this methodology, particularly in theory. Then you see results like the 2011-2013 49ers ranking 2nd, and well, it’s fair to wonder a bit about this methodology in practice. [5]Not to mention the first ’70s Steelers team checking in at #39, which is also only sixth best among Pittsburgh defenses!
I see no issue at all with ranking teams by the “difference” column, and well, both the 2011-2013 49ers and 2012-2014 Seahawks sneak into the top ten by that methodology. So no fancy math is needed to show that those were some dominant defenses once you adjust for era. The “quirk” that is bringing them to the top of the list is that the league-wide standard deviation in points allowed per game over trailing three-year periods has been relatively low of late; since that number is in the denominator of our Z-score, it helps San Francisco and Seattle. Is that appropriate?
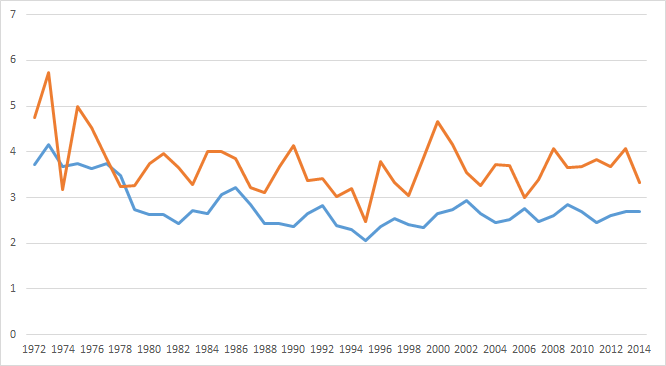
That’s up to each individual reader. Here’s one more graph. In blue, I’ve plotted the standard deviations for points allowed per game for the NFL each three-year period; as you can see, the number has been at 2.7 for the last two 3-year periods. For reference, in orange, I’ve plotted the standard deviation among all teams in points allowed for just a single year (the last of each three year period). As you would expect given the results of the ’73-’75 Rams and the ’12-’14 Seahawks, the standard deviation was noticeably higher in the mid-’70s than it is today.
So why did I include this last graph?
If the trend line of the blue line was consistently decreasing, this post would be taking an even more conservative tone about using Z-Scores; however, the line has been essentially flat since the late ’70s. There’s minor variation, of course, and perhaps that variation is best to be dismissed when calculating Z-Scores (it’s why the ’93-’95 Cowboys rise to third), but 2012-2014 isn’t a particularly low period, anyway.
It’s possible that the early ’70s were somehow different — this was before free agency, which made it easier for teams to have the same roster for 3 straight years, and it was before the 1978 rules changes, which means defenses had more of an impact on the game. What do I mean by that? Think of the points allowed by a defense in a game as a combination of two factors: the strength of the defense and the strength of the offense. [6]Regular readers may recall this post on the subject, which, ironically, went back “only” to 1978. If the rules are slanted towards the offense, the number of points a team will allow will be more dependent on the quality of the offense it is facing. Which means a team’s points allowed number will be more impacted by strength of schedule than a defense in an era where the rules and the game are slanted towards the defense. In that case, a dominant defense will be dominant each week.
That’s just a theory, of course, but it’s not an unreasonable one to draw from the above chart. So the Rams were super dominant because they were awesome, but so were the Steelers and Vikings and Dolphins, and it was an era where it was a bit easier to stand out as dominant for a long stretch of time. It also could be related to the post-merger NFL, where a lack of parity brought high variation in strengths of schedule, which caused a high standard deviation of points allowed. I’m just speculating here: there are all things worth investigating on another day.
But one thing we can say definitively: over the last three years, Seattle has been uniquely excellent at preventing opponents from scoring points relative to league average, and the Seahawks have been as uniquely excellent in this regard as any team over any three-year period in football history.
References
| ↑1 | In about ten minutes, we can all have a good laugh at this line. |
|---|---|
| ↑2 | Of course, Seattle has ranked 1st, 1st, and 1st. |
| ↑3 | Note: I took an average of the average points allowed per game for each season, choosing to treat each season as equals, regardless of the number of games. Reasonable minds could differ on whether this was the correct approach, but fortunately, it does not affect many of the key seasons we would want to analyze, and the effect would be small, regardless. |
| ↑4 | Note that I did not write top 100 defenses! |
| ↑5 | Not to mention the first ’70s Steelers team checking in at #39, which is also only sixth best among Pittsburgh defenses! |
| ↑6 | Regular readers may recall this post on the subject, which, ironically, went back “only” to 1978. |