by Chase Stuart
on January 5, 2014
The table below shows the results of every game in the division round of the playoffs from 1990 to 2012. Each game is displayed from the perspective of the home team. For example, last year, Denver hosted Baltimore in the second round of the playoffs, and you can click on the Boxscore link to see the full boxscore at Pro-Football-Reference. Denver lost 38-35 as a 9-point favorite, and the Over/Under was 44.5. The “dnc” means that the Broncos did not cover.
Overall, home teams are 67-25 and 49-42-1 against the spread.
{ }
by Chase Stuart
on January 5, 2014
After the projections for most of the week was below-zero weather, the latest reports indicates that by kickoff, the temperature in Green Bay should be in the single digits. The temperature of a game is more open to interpretation than you think: in a lot of the games below, there are different reports depending on which source you use. That said, I’ve found six playoff games that had a temperature of zero degrees or colder:
- The Ice Bowl: The classic cold-weather game: the temperature was reportedly −15 degrees with an average wind chill around −36, although PFR has it at -2 degrees and -23, respectively. The Packers won 21-17, after Bart Starr‘s quarterback sneak for the winning score in the final seconds.
- The Freezer Bowl: In 1981, the Chargers played in Cincinnati in -9 degree weather; add in the 27 miles per hour winds, and it felt more like −37 degrees. PFR has those numbers at -6 degrees, wind 24 mph, wind chill -32. Cincinnati won 27-7, to advance to the Super Bowl.
- The 2007 NFC Championship Game: This was the Giants/Packers game where half of Coughlin’s face turned Giants red. New York won in overtime, 23-20, before upsetting the Patriots in Super Bowl XLII. The gamebook lists the temperature at -1 degrees, with a wind chill of -23. PFR has it at -7 degrees, with a brutal wind chill of -27.
- Washington at Chicago, 1987: PFR has this one at -3 degrees with a wind chill of -20. Classic Ditka weather! Here’s the video to the CBS intro with John Madden and Pat Summerall (note that the broadcast states it was 12 degrees, with a wind chill feel of -5.). Washington won, 21-17, and eventually won the Super Bowl.
- Indianapolis at Kansas City, 1995. Lin Elliott misses three field goals for the Chiefs, and the Colts win 10-7. PFR has it at 0 degrees, – 15 with wind chill.Some other playoff games come closer.
- When Los Angeles traveled to Buffalo in 1993, it was zero degrees with, according to NFL.com, a wind chill at -32! Jeff Hostetler, who never had a bad playoff game, lost his only playoff game here despite throwing for 230 yards and a touchdown (with no interceptions) on 20 passes. Jim Kelly threw a game-winning touchdown pass to Bill Brooks, and Buffalo won 29-23. PFR lists the temperature at 3 degrees with a wind chill of -14
A pair of playoff games in Lambeau Field in 1996 and Soldier Field in 1963 probably could have been sub-zero games, but noon-time starts kept the temperature on the positive side of the ledger. Ten years ago, the Titans game in New England got the Saturday Night treatment, which allowed the temperature to drop down to 4 degrees with a wind chill -14. And the Browns/Raiders game known simply as Red Right 88 was at 2 degrees with a wind chill of -20.
It looks like today’s game will join the list of freezing playoff games, but may not make the top five.
San Francisco’s Turnover Margin
I think the 49ers are the vastly superior team here, so my pregame analysis will be limited. The Packers are a very average team, and a healthy Aaron Rodgers only makes them above-average. San Francisco led the league in points differential through two quarters and through three quarters, and I can still see this team becoming the next Lombardi Packers. But here’s an interesting stat from Bill Barnwell: [continue reading…]
Tagged as:
49ers,
Packers
{ }
by Chase Stuart
on January 5, 2014
Every few years, a team like the 2013 Chargers makes the playoffs. This season, San Diego’s offense ranked 3rd in Adjusted Net Yards per Attempt, while the defense ranked 3rd to last in the same metric. And these teams, without exception, have flamed out in the playoffs. The Chargers also ranked 2nd in NY/A and 2nd to last in NY/A allowed, but I’m going to focus on ANY/A for the rest of this post.
The worst pass defense to win the Super Bowl was the 1976 Raiders. That year, Oakland’s pass defense produced the 10th worst ANY/A allowed average in the league. The only other Super Bowl champion that ranked in the bottom half of the league in ANY/A allowed was the 2011 Giants, who just barely qualify (New York ranked 17th in ANY/A allowed, or 16th from the bottom).
The table below shows each team since 1970 that ranked in the top five in ANY/A and in the bottom five in ANY/A allowed. Because of the different numbers of teams throughout the league’s history, I ranked teams from worst to best when calculating the ANY/A allowed ranks. The most recent team prior to the ’13 Chargers to make the playoffs while meeting those thresholds was the 2005 Patriots. That team, quarterbacked by Tom Brady and coached by Bill Belichick, ranked 5th in ANY/A and 4th from the bottom in ANY/A allowed. New England went 10-6 that year, and then 1-1 in the playoffs. As you can see, the postseason results for this group have been pretty uninspiring. And, as Chargers fans will notice, it includes a pair of Air Coryell teams: [continue reading…]
Tagged as:
Bengals,
Chargers
{ }
by Neil Paine
on January 4, 2014
One of my favorite sabermetric baseball articles of all time was written by Sky Andrecheck in 2010 — part as a meditation on the purpose/meaning of playoffs, and part as a solution for some of the thorny logical concerns that arise from said mediation.
The basic conundrum for Andrecheck revolved around the very existence of a postseason tournament, since — logically speaking — such a thing should really only be invoked to resolve confusion over who the best team was during the regular season. To use a baseball example, if the Yankees win 114 games and no other AL team wins more than 92, we can say with near 100% certainty that the Yankees were the AL’s best team. There were 162 games’ worth of evidence; why make them then play the Rangers and Indians on top of that in order to confirm them as the AL’s representative in the World Series?
Andrecheck’s solution to this issue was to set each team’s pre-series odds equal to the difference in implied true talent between the teams from their regular-season records. If the Yankees have, say, a 98.6% probability of being better than the Indians from their respective regular-season records, then the ALCS should be structured such that New York has a 98.6% probability of winning the series — or at least close to it (spot the Yankees a 3-0 series lead and every home game from that point onward, and they have a 98.2% probability of winning, which is close enough). [continue reading…]
{ }
by Chase Stuart
on January 4, 2014

I have to deal with Chip Kelly?
Kansas City/Indianapolis Preview
New Orleans Saints (11-5) (+2.5) at Philadelphia Eagles (10-6), Saturday 8:10 PM ET
We’re fully immune to the Saints offense at this point. Drew Brees just threw for for 5,162 yards and 39 touchdowns and it didn’t even register on most radars. One reason for that: both of those numbers represent three-year lows for the Saints star. Jimmy Graham shook off early-season leg injuries to lead the league with 16 touchdowns, and rookie Kenny Stills led the NFL in yards per target. Both Pierre Thomas and Darren Sproles topped 70 receptions — two of just five running backs this year to do so — and I didn’t even know that until five seconds ago. Pinball numbers are the expectation when dealing with the Saints offense.
But the real change is on defense, as the team just finished one of the most remarkable turnarounds in NFL history. Did you know that the Saints finished fourth in points allowed this year? That’s only the fourth time New Orleans has ranked in the top five in that statistic in franchise history, with the other three occurrences all coming during the Dome Patrol era. What makes New Orleans’ success even more remarkable is that the team ranked last in points allowed in 2012. New Orleans is the first team in NFL history to jump 27 spots in the points allowed rankings. Prior to this year, the 2011 Houston Texans (4th after ranking 29th) and 1993 New York Giants (1st after ranking 26th) had been the most improved defenses with 25-slot jumps. Now the Saints probably aren’t as good as their points allowed rank would imply (Football Outsiders has them 9th, Advanced NFL Stats ranks the unit 10th), but unparalleled feats remain astounding.
The main reason for the team’s improvement is the pass defense. The Saints ranked last in Net Yards per Attempt allowed last year, but 7th this season, another remarkable jump. In fact, only 10 teams have ever made a jump of 25 spots in the NY/A allowed rankings: [continue reading…]
Tagged as:
ANY/A,
Eagles,
RANY/A,
Saints
{ }
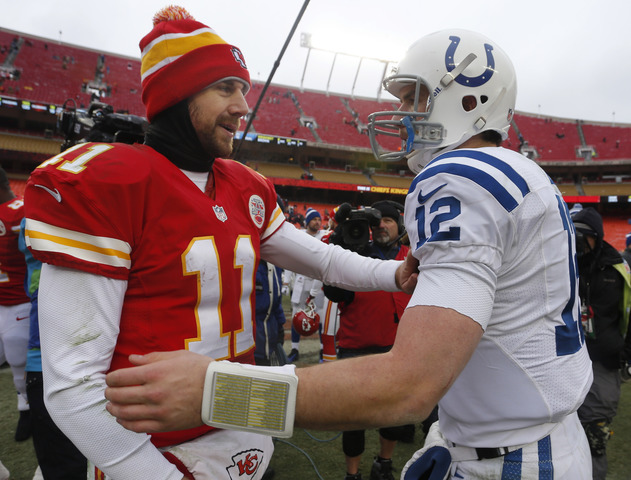
by Chase Stuart
on January 3, 2014
Kansas City Chiefs (11-5) (Pick’em) at Indianapolis Colts (13-3), Saturday 4:35PM ET
The Chiefs have the talent edge, but the Colts have one big advantage.
Among the four games this weekend, this one figures to be the most competitive: I would be surprised if this isn’t a one possession game in the fourth quarter. The Colts rank 13th in Football Outsiders DVOA, courtesy of the 13th-ranked offense, the 16th-best defense, and the 17th best special teams. Kansas City is 7th overall, thanks to a 15th-place ranking on offense, a 9th-place ranking on defense, and the top special teams in the NFL. And while the Colts beat the Chiefs two weeks ago, I don’t put much stock in that for a couple of reasons.
One, the Chiefs were missing two key players, left tackle Branden Albert and pass rusher Justin Houston. Two, I suspect that Kansas City called a very vanilla game plan in the first meeting. The Chiefs knew that Indianapolis was the likely first round opponent in the playoffs, and a win would have been meaningless for Kansas City unless Denver would lose to either Houston or Oakland. In retrospect, had the Chiefs kept their cards close to the vest (a luxury the Colts couldn’t afford), it would have been wise. [continue reading…]
Tagged as:
Chiefs,
Colts
{ }
by Chase Stuart
on January 3, 2014
Every week this season, I’ve written about the Game Scripts from the previous weekend. For new readers, the term Game Script is just shorthand for the average points differential for a team over every second of each game. You can check out the updated Game Scripts page, which shows the results of all 256 games this year. Week 17 saw some big blowouts and some tight finishes: Peyton Manning, Andrew Luck, and Drew Brees all led their teams to convincing wins against overmatched opponents, while Green Bay and Philadelphia clinched playoff berths with close wins.
Week 17 was unremarkable from a Game Scripts perspective, although I’ll note that Denver’s win over Oakland produced a Game Script of 21.6, the fifth highest average margin of the year (and the best by the Broncos this year). On the comeback side, only three teams won with negative Game Scripts, and two of those wins (Green Bay, Carolina) were back-and-forth contests. That means we should all take a moment to reflect on the resolve and grit of the San Diego Chargers, who overcame an average deficit of 4.6 points (in regulation) to force overtime and eventually defeat the Chiefs B team.
The full Game Scripts data from week 17: [continue reading…]
Tagged as:
Game Scripts,
Pass Identity
{ }
by Chase Stuart
on January 2, 2014
Before the playoffs start, I encourage everyone to post their playoff predictions in the comments. Here are mine:
Wild Card Round
Saturday, Jan. 4, 4:35 p.m.: Chiefs at Colts — Chiefs
Saturday, Jan. 4, 8:10 p.m.: Saints at Eagles — Eagles
Sunday, Jan. 5, 1:05 p.m.: Chargers at Bengals — Bengals
Sunday, Jan. 5, 4:40 p.m.: 49ers at Packers– 49ers
Divisional Round
Saturday, Jan. 11, 4:30 p.m.: 49ers/Packers/Saints at Seahawks — 49ers
Saturday, Jan. 11, 8:15 p.m.: Bengals/Colts/Chiefs at Patriots — Bengals
Sunday, Jan. 12, 1:05 p.m.: Eagles/49ers/Packers at Panthers — Panthers
Sunday, Jan. 12, 4:40 p.m.: Colts/Chiefs/Chargers at Broncos— Broncos
Conference Championship Round
Sunday, Jan. 19: 3:00 p.m.: 49ers at Panthers – 49ers
Sunday, Jan. 19: 6:30 p.m.: Bengals at Broncos – Broncos
Super Bowl
Sunday, Feb. 2, 2013 – 6:20 p.m.: Broncos vs. 49ers — Broncos
{ }
by Chase Stuart
on January 2, 2014
It stands to reason that when a team has a bottom five scoring offense, they’re going to make some changes. But today we’re going to quantify what we all know. By definition, there were 55 teams to rank in the bottom five in scoring from 2002 to 2012. What changes did those teams make?
- 29 of the teams (53%) switched head coaches, 43 switched offensive coordinators (78%), and 32 teams (58%) had a different starting quarterback in week 1 of the following season. In 19 of the 55 cases (35%), the team got rid of the whole trio.
- I don’t think it’s too surprising that the offensive coordinator is the most likely casualty. In the 12 cases where the offensive coordinator was retained, the head coach was only fired in one of those seasons. That was in Cincinnati after the 2002 season, when Bob Bratkowski was kept after Dick LeBeau was replaced by Marvin Lewis. The Bengals drafted Carson Palmer with the first overall pick a few months later, but Jon Kitna kept the quarterback job for the 2003 season.
- In only four of the other 11 cases where the offensive coordinator was fired did the team switch quarterbacks. In 2009, Steve Spagnuolo and Pat Shurmur struggled in St. Louis under Marc Bulger; the team landed the number one overall pick, drafted Sam Bradford, and played him immediately. Also that year, Eric Mangini and Brian Daboll could not get the Cleveland offense humming under Brady Quinn. The solution was to bring in Jake Delhomme in 2010. In 2008, the Bengals offense struggled when Palmer missed most of the year due to injury. Lewis and Bratkowski were retained, as Cincinnati pinned the blame on Ryan Fitzpatrick. Finally, in 2006, Tampa Bay ranked 31st in scoring despite the presence of coaching guru Jon Gruden and Bill Muir. A rookie Bruce Gradkowski (playing after Chris Simms) was replaced in 2007 with Jeff Garcia.
There were only 7 of 55 situations where a team had a bottom five offense but brought back the head coach, offensive coordinator, and quarterback. Below is the full information for the 55 teams; analysis to come after the jump. For the Year N QB, I’ve listed the quarterback with the most attempts. For the Year N+1 QB, I chose to list the quarterback that started in week one of that season. All team/player/coach cells are linked to the relevant PFR page. [continue reading…]
{ }
by Chase Stuart
on January 1, 2014
In my final article of the year at the New York Times, I look at one key statistic for each team.
Denver Broncos: Quarterback Curse
Can Peyton Manning break the hex? Only four quarterbacks — Tom Brady (2007), Rich Gannon (2002), Kurt Warner (2001) and Dan Marino (1984) — have played in a Super Bowl in the season in which they won the passing yards title, with none of the four winning the game. Since 1950, only Johnny Unitas in 1959 and George Blanda in 1961 (in the American Football League) have led their league in passing yards and won a championship in the same season.
Some quarterback will become the first player to pull off this feat at a Super Bowl, and Manning seems as strong a candidate as any: he broke the single-season record for passing yards, a record which is under league review.
The last player to be named the N.F.L.’s most valuable player and win the Super Bowl in the same season was Warner, in 1999. Manning will almost certainly be named the M.V.P. for the fifth time in his career, which means he can end two streaks with one Super Bowl title.
…
Indianapolis Colts: Giant Killers Have Slain San Francisco, Denver and Seattle
Only six teams have ever beaten three teams in the regular season that won 12 or more games. Two of those teams, the 1990 Bills and the 1999 Titans, went on to play in the Super Bowl, while another, the 2003 Patriots, won the Super Bowl. The 2011 Ravens team that lost in the final seconds of the A.F.C. championship game, to New England, is also on the list. The 2002 Saints are the only outlier on the list: New Orleans swept the eventual Super Bowl champion Buccaneers but missed the playoffs.
Indianapolis, of course, is the sixth such team. Few teams run hot and cold like Indianapolis: countering those mammoth victories were embarrassing blowout losses to St. Louis, Arizona and Cincinnati. The Colts would be wise to put the game in Andrew Luck’s hands and waste fewer carries on Trent Richardson, but Indianapolis will not lack confidence entering the playoffs.
…
San Francisco 49ers: Best Team Through Three Quarters
The 49ers followed an N.F.C. championship in 2012 with 1-2 and 6-4 starts this season. As a result, San Francisco is one of the more underappreciated 12-4 teams in recent memory. The 49ers have averaged 18.1 points through the first three quarters of every game, while allowing just 9.6; that 8.5-point differential is the best in the N.F.L. San Francisco has a habit of dominating teams early and letting up on them late: the 49ers have been outscored in the fourth quarters of games this season, 119-117. But will the team be more ruthless in the postseason?
Last year, Jim Harbaugh waited until the playoffs to unleash the full potential of the Pistol offense under Colin Kaepernick. Against the Packers, Kaepernick set an N.F.L. record for rushing yards by a quarterback in a game. San Francisco has operated conservatively this year, and easing up in the fourth quarter of games has hidden how dominant the 49ers can be. Does Harbaugh have another trick up his sleeve for January?
You can view the full article, and the statistics for the other nine teams, here.
Tagged as:
NYT
{ }