
Last week, I posted the final 2019 passing numbers; today, I am going to show those numbers after we adjust for strength of schedule, using the methodology described here. As always, an iterative process is used to adjust for strength of schedule: each quarterback’s season is adjusted for the quality of the defenses he’s faced, those defenses are adjusted for the quality of the quarterbacks they faced, and so on, until equilibrium is reached.
Carson Wentz and Sam Darnold had the two easiest schedules this year. Let’s begin with Wentz. Here’s how to read his graph, starting with his best game of the season. In week 1, Wentz and the Eagles hosted Washington and won, 32-27. Wentz threw 39 passes for 313 yards with 3 TDs and no interceptions, and 1 sack for no yards. That gives him 373 Adjusted Net Yards (Passing Yards + 20 * TDs – 45 * INTs – Sack Yards Lost) on 40 DropBacks (Attempts + Sacks). This game made up 6.2% of all dropbacks Wentz had all season. He averaged 9.33 ANY/A in this game on 40 dropbacks; assuming the league average ANY/A of 6.16, this means Wentz produced 127 Adjusted Net Yards of Value above average. However, Washington was a bad pass defense, finishing 0.88 ANY/A below average. Therefore, Wentz’s actual value for this game was +91, now +127, after adjusting for strength of schedule.
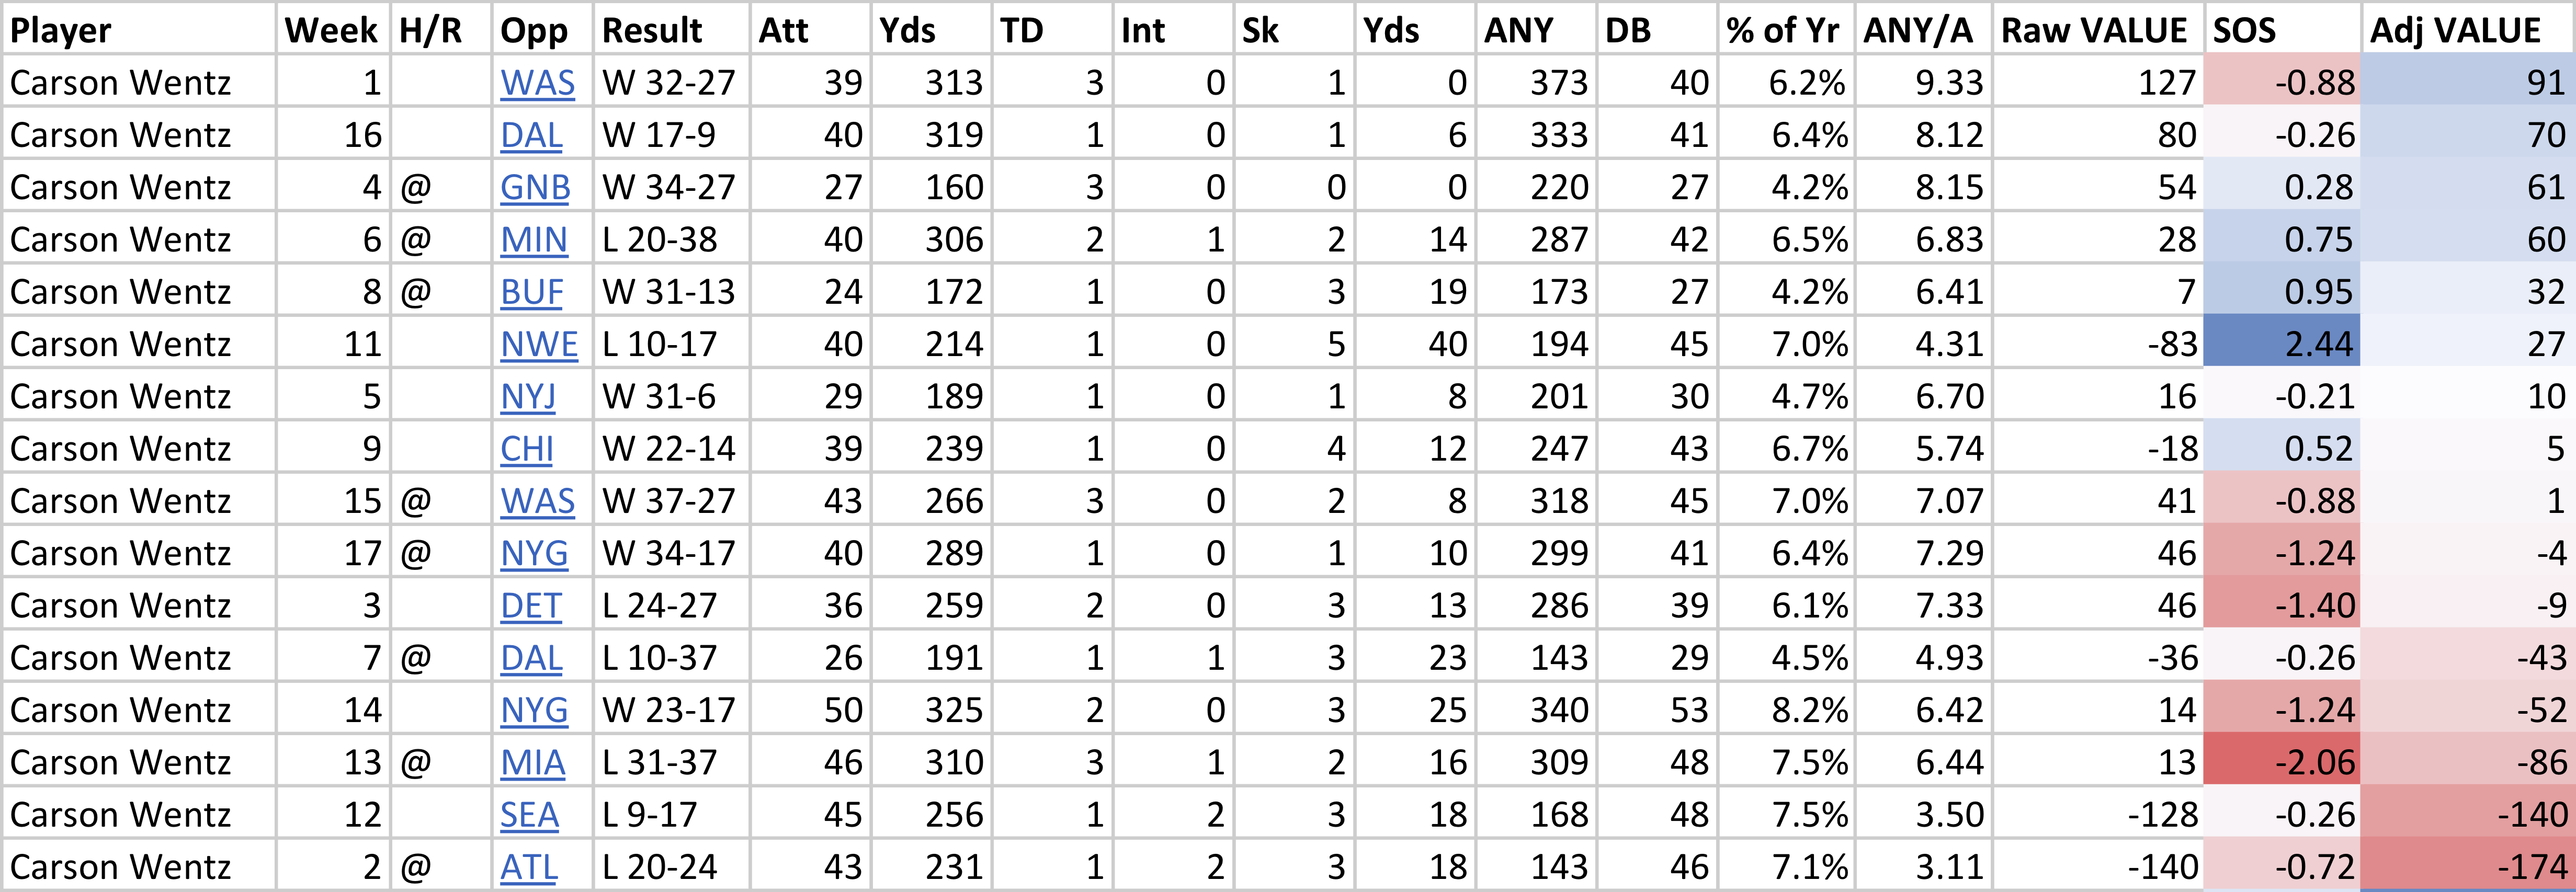 The % of Yr column can help us understand why Wentz had the easiest schedule this year. He faced 7 bottom-tier pass defenses this year — Washington twice, the Giants twice, Atlanta, Detroit, and Miami — and those games were responsible for 48.4% of his passes. Now, as it turns out, Wentz played poorly in several of those games while playing pretty well against better pass defenses that Green Bay, Minnesota, and Buffalo. But that doesn’t change the underlying fact that Wentz had a very easy schedule.
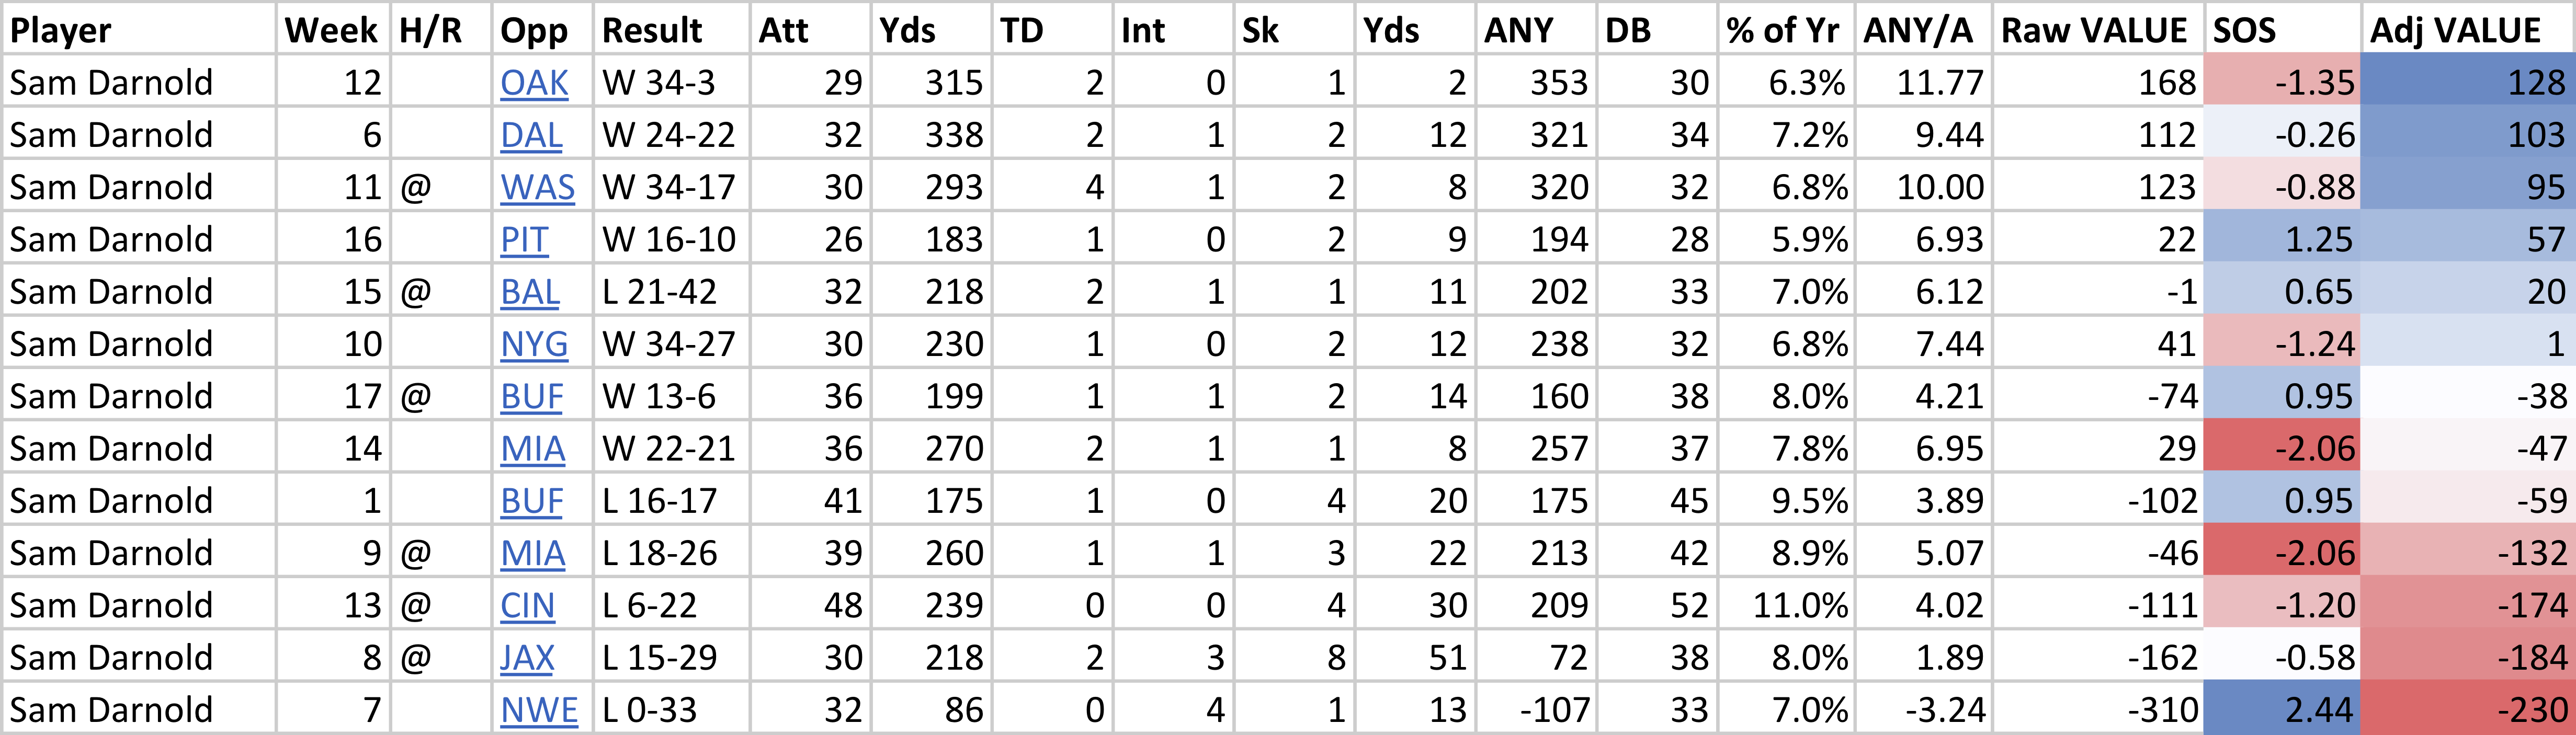
Now, let’s go to Darnold. He had three outstanding games this year, but they all came against weak pass defenses: Oakland, Dallas, and Washington. He also had one historically awful game, which came against the Patriots (it ranked as the worst passing game of the season without adjusting for SOS, and a bottom-10 game after adjusting for SOS). For Darnold fans, the biggest concern would be the games against Jacksonville, Cincinnati, and Miami. On the surface, those games look bad, but they look really bad in context: Darnold had the worst game any quarterback had against the Jaguars or Bengals this season, and the second-worst game any quarterback had against Indianapolis (Brian Hoyer).
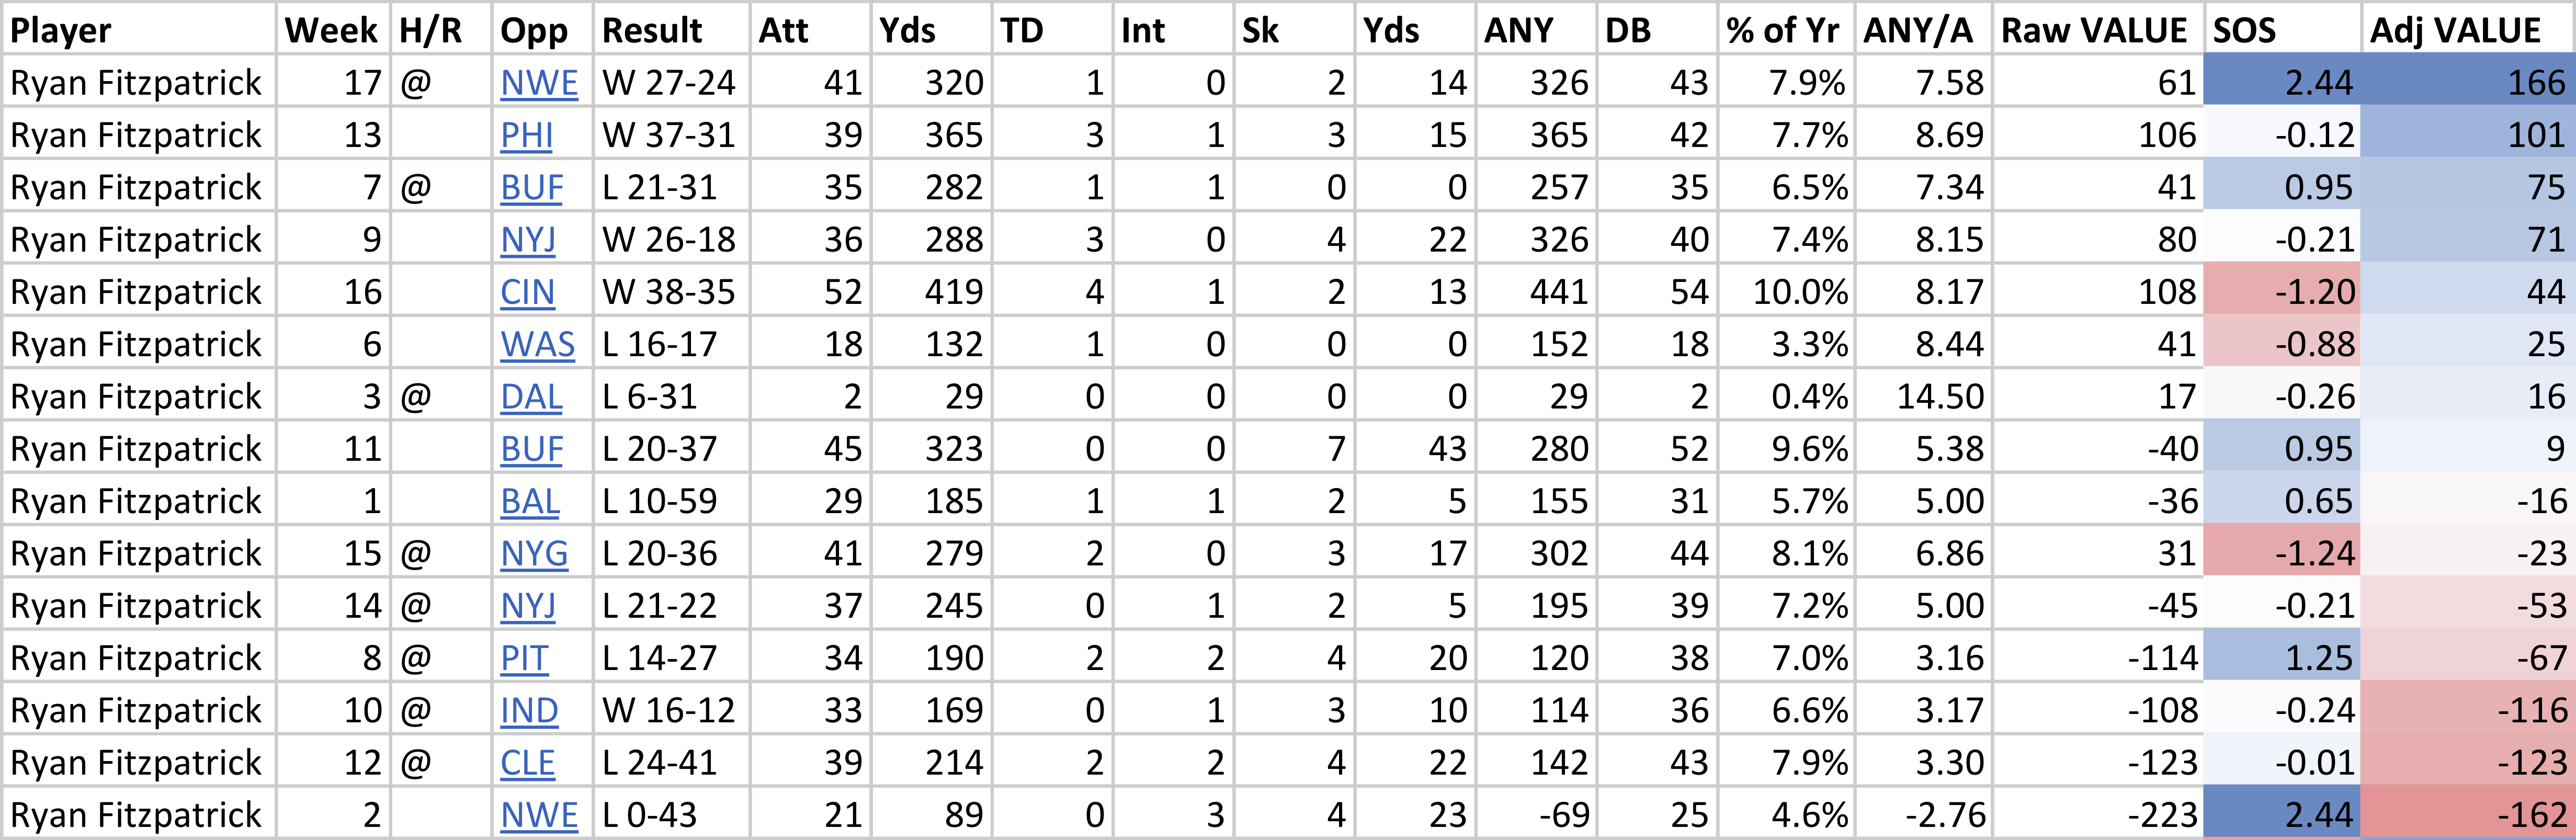
On the other side, the two quarterbacks with the most difficult schedules were Ryan Fitzpatrick (+0.28 ANY/A more difficult than average) and Russell Wilson (+0.32). Fitzpatrick had two games against the Patriots and Bills, and games against the Steelers and Ravens; over 40% of Fitzpatrick’s passing dropbacks came in those six games. Fitzpatrick had the second-best passing game this year against New England, behind only Deshaun Watson. Fitzpatrick also had his struggles – he had the second-worst passing game this year against the Colts (Will Grier) and Browns (Mason Rudolph) – but he was certainly better in 2019 than his raw statistics indicate.
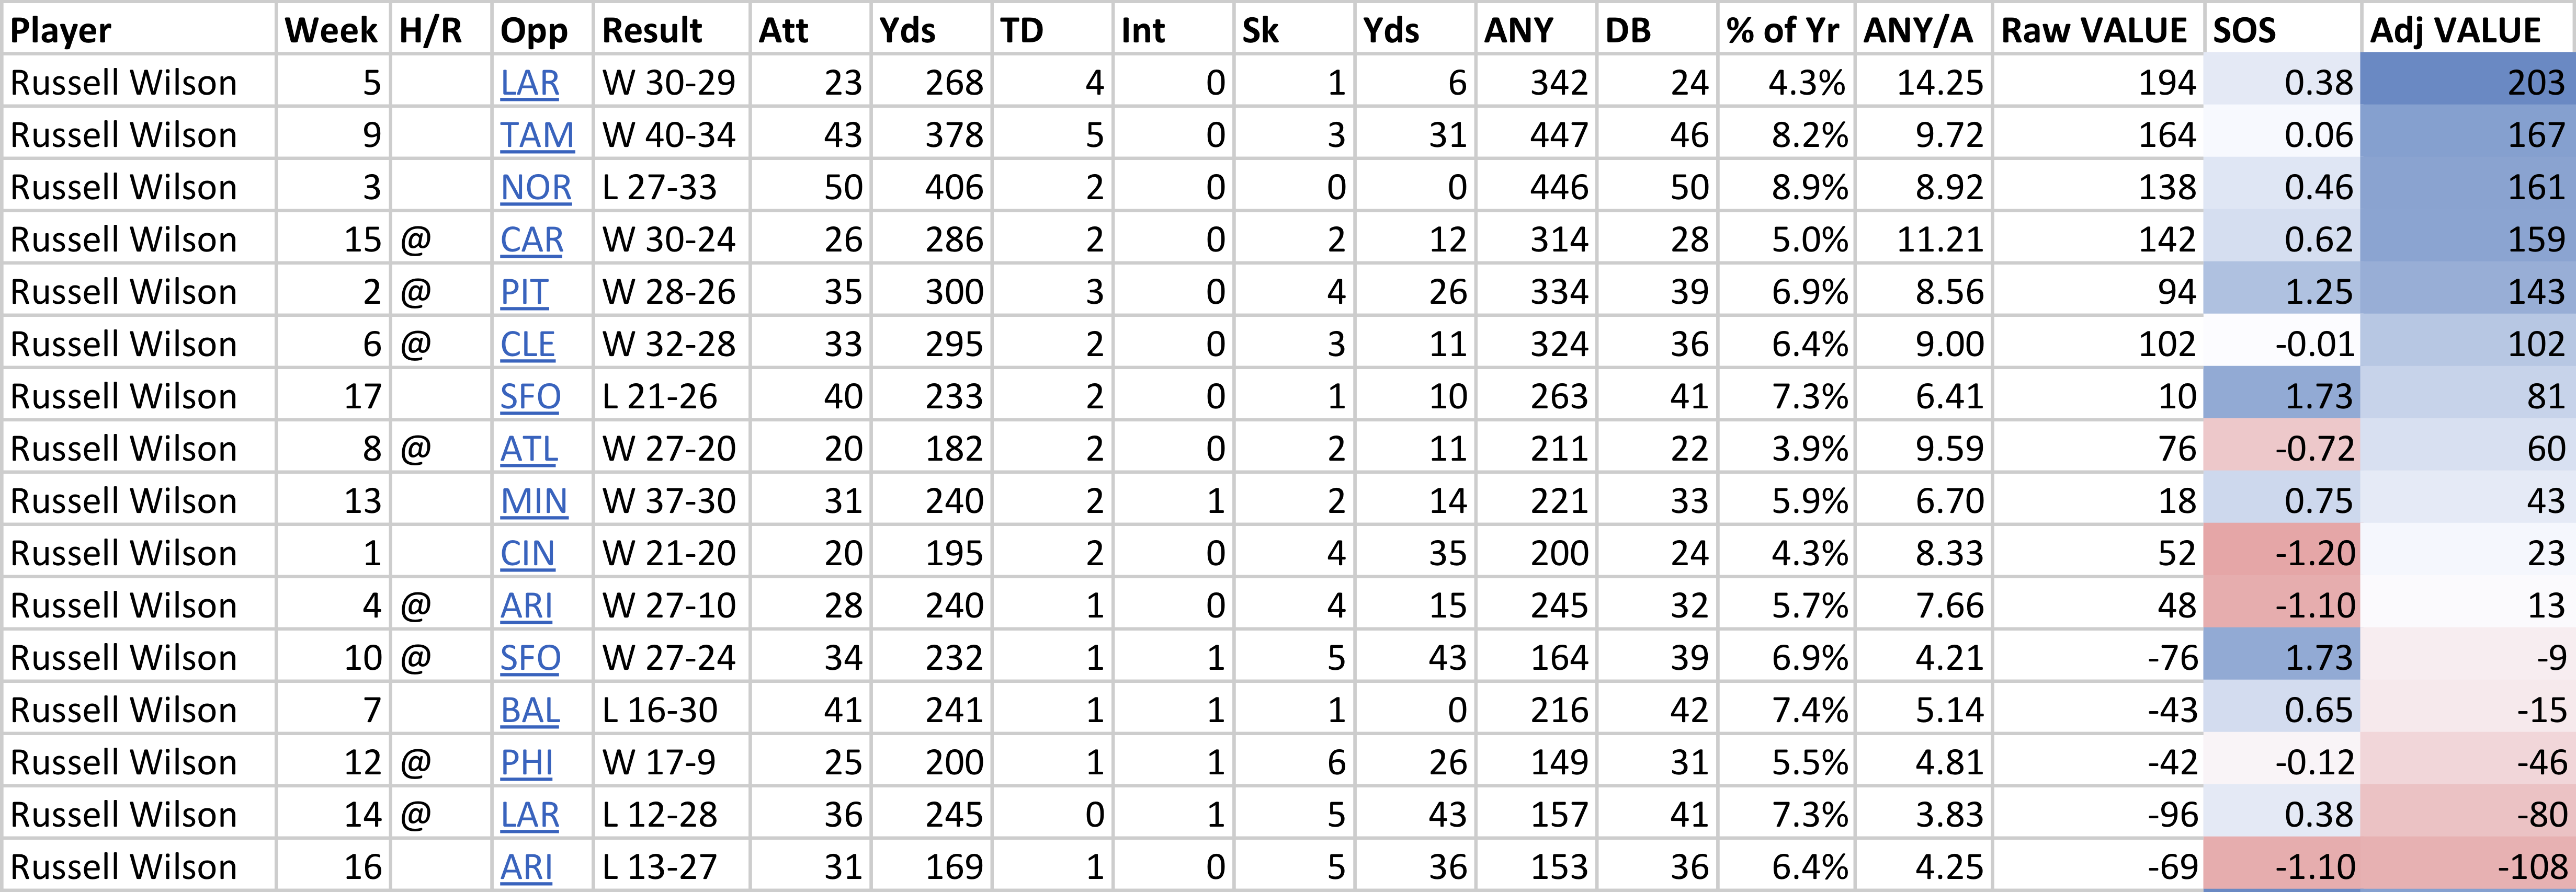
Finally, here’s Wilson’s chart. He had only four “easy” games this year, and those games only accounted for 20% of his dropbacks (Atlanta, Arizona twice, and Cincinnati). Wilson had the best passing game of any quarterback this season against the Rams, the Bucs, the Saints, and the Panthers. He also had the second-best passing game any quarterback had against the Steelers (Tom Brady) or the Browns (Lamar Jackson). Wilson had the hardest SOS in the NFL in 2019.
 Finally, the table below shows the full season stats after adjusting for strength of schedule. Ryan Tannehill is still your league leader in ANY/A after adjusting for strength of schedule, but the gap between him and Jackson narrows a bit. The table below is fully sortable and searchable.
| Rk | Quarterback | ANY | DB | ANY/A | RANY/A | SOS | Adj RANY/A |
|---|---|---|---|---|---|---|---|
| 1 | Ryan Tannehill | 2700 | 317 | 8.52 | 2.36 | 0.02 | 2.37 |
| 2 | Lamar Jackson | 3471 | 424 | 8.19 | 2.03 | 0.16 | 2.19 |
| 3 | Patrick Mahomes | 4199 | 501 | 8.38 | 2.22 | -0.08 | 2.15 |
| 4 | Drew Brees | 3250 | 390 | 8.33 | 2.17 | -0.06 | 2.11 |
| 5 | Matthew Stafford | 2517 | 309 | 8.15 | 1.99 | -0.16 | 1.83 |
| 6 | Russell Wilson | 4186 | 564 | 7.42 | 1.26 | 0.32 | 1.59 |
| 7 | Dak Prescott | 4856 | 619 | 7.84 | 1.69 | -0.10 | 1.58 |
| 8 | Kirk Cousins | 3646 | 472 | 7.72 | 1.57 | -0.20 | 1.37 |
| 9 | Derek Carr | 3930 | 542 | 7.25 | 1.09 | 0.12 | 1.21 |
| 10 | Jimmy Garoppolo | 3696 | 512 | 7.22 | 1.06 | -0.13 | 0.93 |
| 11 | Deshaun Watson | 3575 | 539 | 6.63 | 0.47 | 0.16 | 0.64 |
| 12 | Aaron Rodgers | 4058 | 605 | 6.71 | 0.55 | -0.01 | 0.54 |
| 13 | Teddy Bridgewater | 1385 | 208 | 6.66 | 0.50 | -0.02 | 0.48 |
| 14 | Jared Goff | 4188 | 648 | 6.46 | 0.30 | 0.10 | 0.40 |
| 15 | Philip Rivers | 3953 | 625 | 6.32 | 0.17 | 0.03 | 0.19 |
| 16 | Gardner Minshew | 3237 | 503 | 6.44 | 0.28 | -0.14 | 0.14 |
| 17 | Matt Ryan | 4040 | 664 | 6.08 | -0.07 | 0.15 | 0.08 |
| 18 | Ryan Fitzpatrick | 3135 | 542 | 5.78 | -0.37 | 0.28 | -0.10 |
| 19 | Tom Brady | 3992 | 640 | 6.24 | 0.08 | -0.18 | -0.10 |
| 20 | Jameis Winston | 4137 | 673 | 6.15 | -0.01 | -0.16 | -0.17 |
| 21 | Jacoby Brissett | 2873 | 474 | 6.06 | -0.10 | -0.12 | -0.22 |
| 22 | Carson Wentz | 4034 | 644 | 6.26 | 0.11 | -0.34 | -0.23 |
| 23 | Case Keenum | 1557 | 262 | 5.94 | -0.22 | -0.22 | -0.43 |
| 24 | Kyler Murray | 3273 | 590 | 5.55 | -0.61 | 0.12 | -0.49 |
| 25 | Josh Allen | 2847 | 499 | 5.71 | -0.45 | -0.06 | -0.52 |
| 26 | Baker Mayfield | 3037 | 574 | 5.29 | -0.87 | 0.21 | -0.66 |
| 27 | Joe Flacco | 1523 | 288 | 5.29 | -0.87 | 0.09 | -0.78 |
| 28 | Andy Dalton | 2935 | 565 | 5.19 | -0.96 | 0.14 | -0.82 |
| 29 | Daniel Jones | 2672 | 497 | 5.38 | -0.78 | -0.12 | -0.91 |
| 30 | Sam Darnold | 2607 | 474 | 5.50 | -0.66 | -0.31 | -0.97 |
| 31 | Mitchell Trubisky | 2794 | 554 | 5.04 | -1.12 | -0.02 | -1.13 |
| 32 | Mason Rudolph | 1496 | 298 | 5.02 | -1.14 | -0.24 | -1.38 |
| 33 | Kyle Allen | 2545 | 535 | 4.76 | -1.40 | -0.14 | -1.54 |
| 34 | Dwayne Haskins | 986 | 232 | 4.25 | -1.91 | -0.19 | -2.10 |
Please leave your thoughts in the comments.