
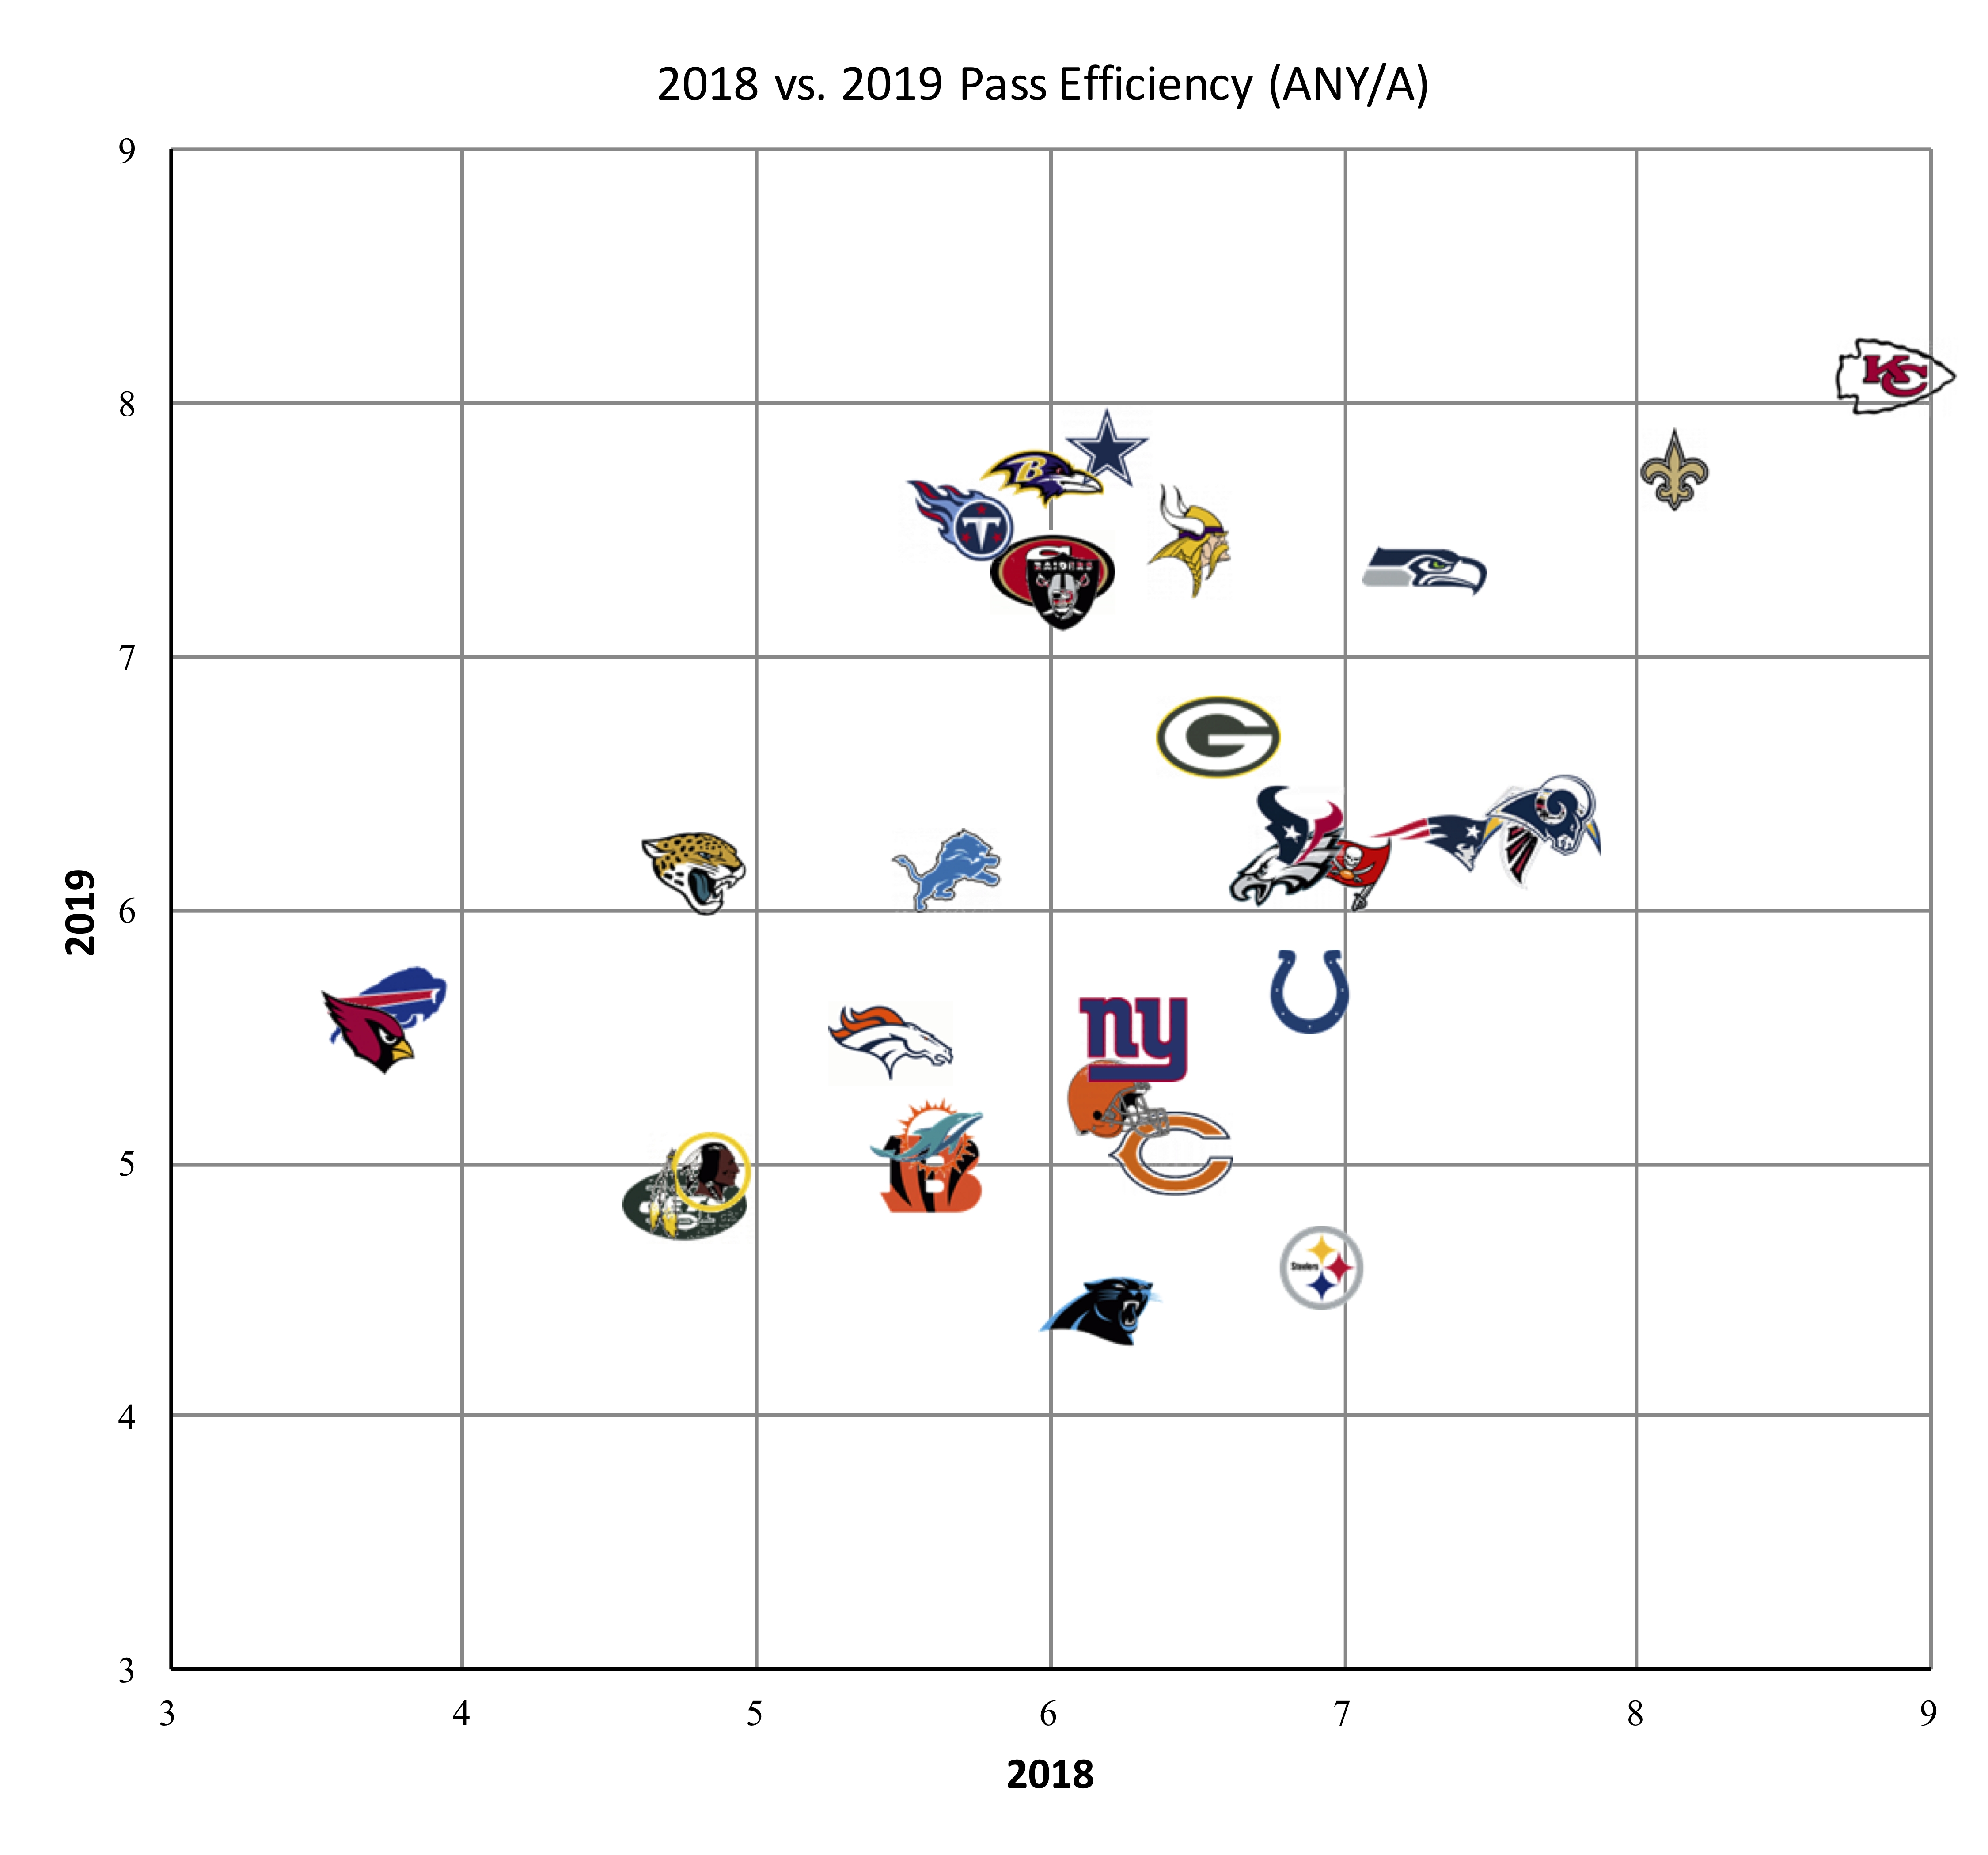
The 2014 season marked a new era of passing efficiency. And since the 2014 season, the passing game has remained extremely efficient. However, there were a lot of quarterback injuries in 2019: we spent most or all of the season without Andrew Luck, Ben Roethlisberger, Cam Newton, and Alex Smith; as a result, pass efficiency, as measured by Adjusted Net Yards per Attempt, was slightly down in 2018 compared to 2019.
The graph below shows each team’s ANY/A in 2018 (X-Axis) and 2019 (Y-Axis).
On the surface, the big change from 2018 to 2019 was a decline in completion percentage, from 64.9% in ’18 to 63.5% this season. And that is a significant decline. However, the 63.5% mark was in line with recent history; the 64.9% mark was the true outlier, and it also came as quarterbacks took a relatively high number of sacks in 2018 (and threw more touchdowns).
The table below shows the passing data from 2014 to 2019; the ’14-’18 average’ row shows the average passing numbers over the five years before 2019, and the bottom row shows how 2019 relates to that average.
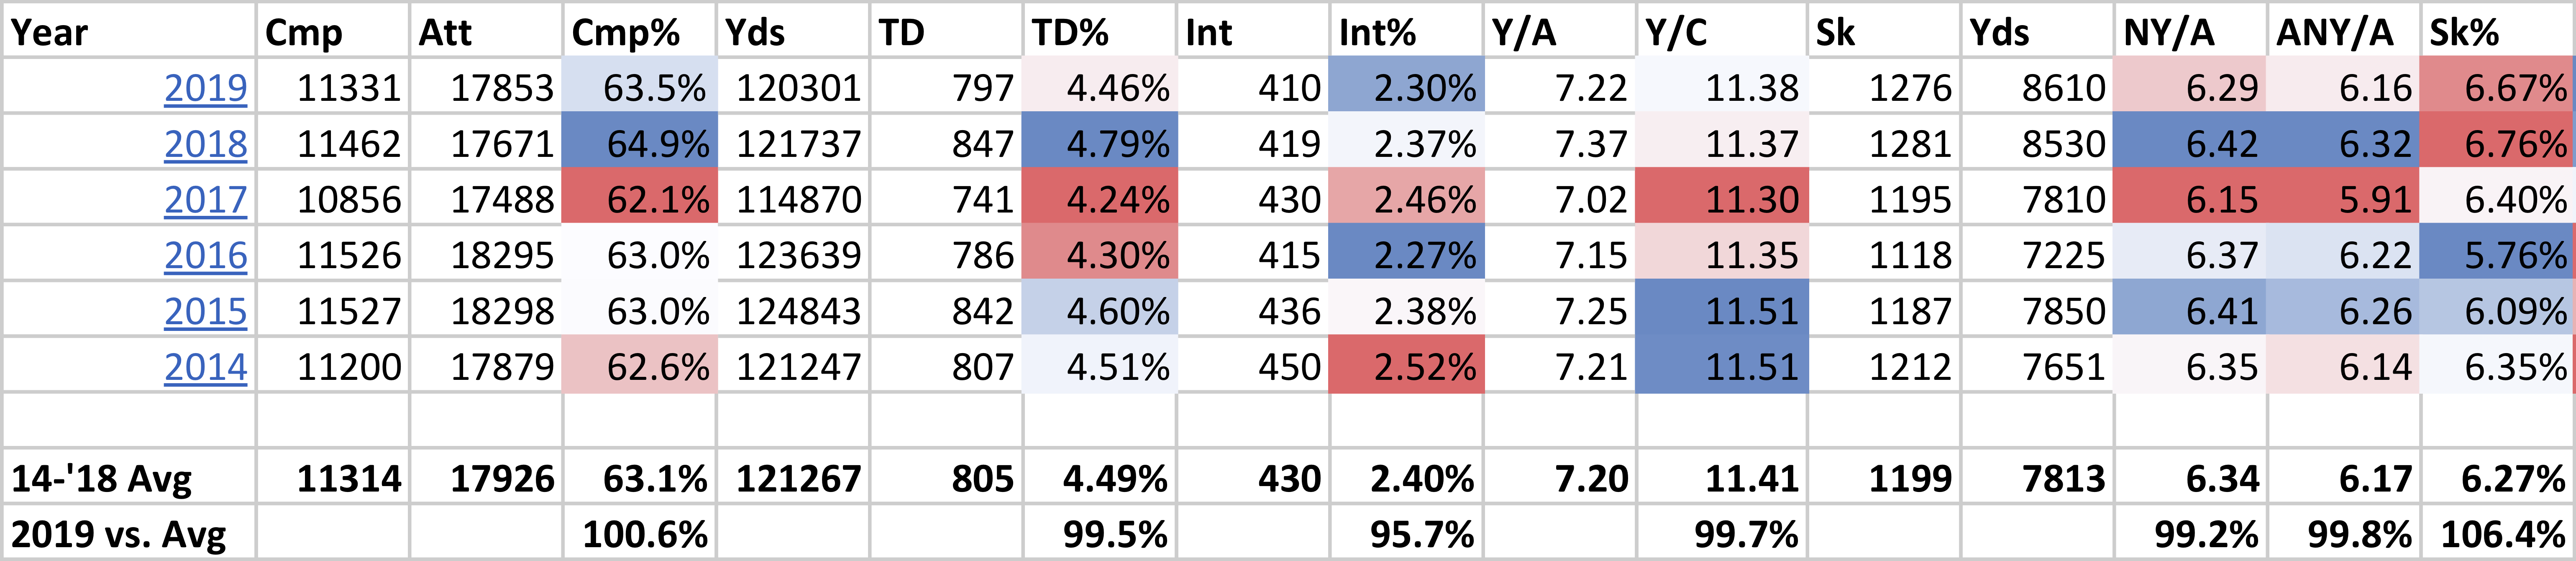
As you can see, passers in 2019 had almost the exact same ANY/A average as passers did from 2014 to 2018. But there were two big changes in how we got there: a higher sack rate and a lower interception rate.
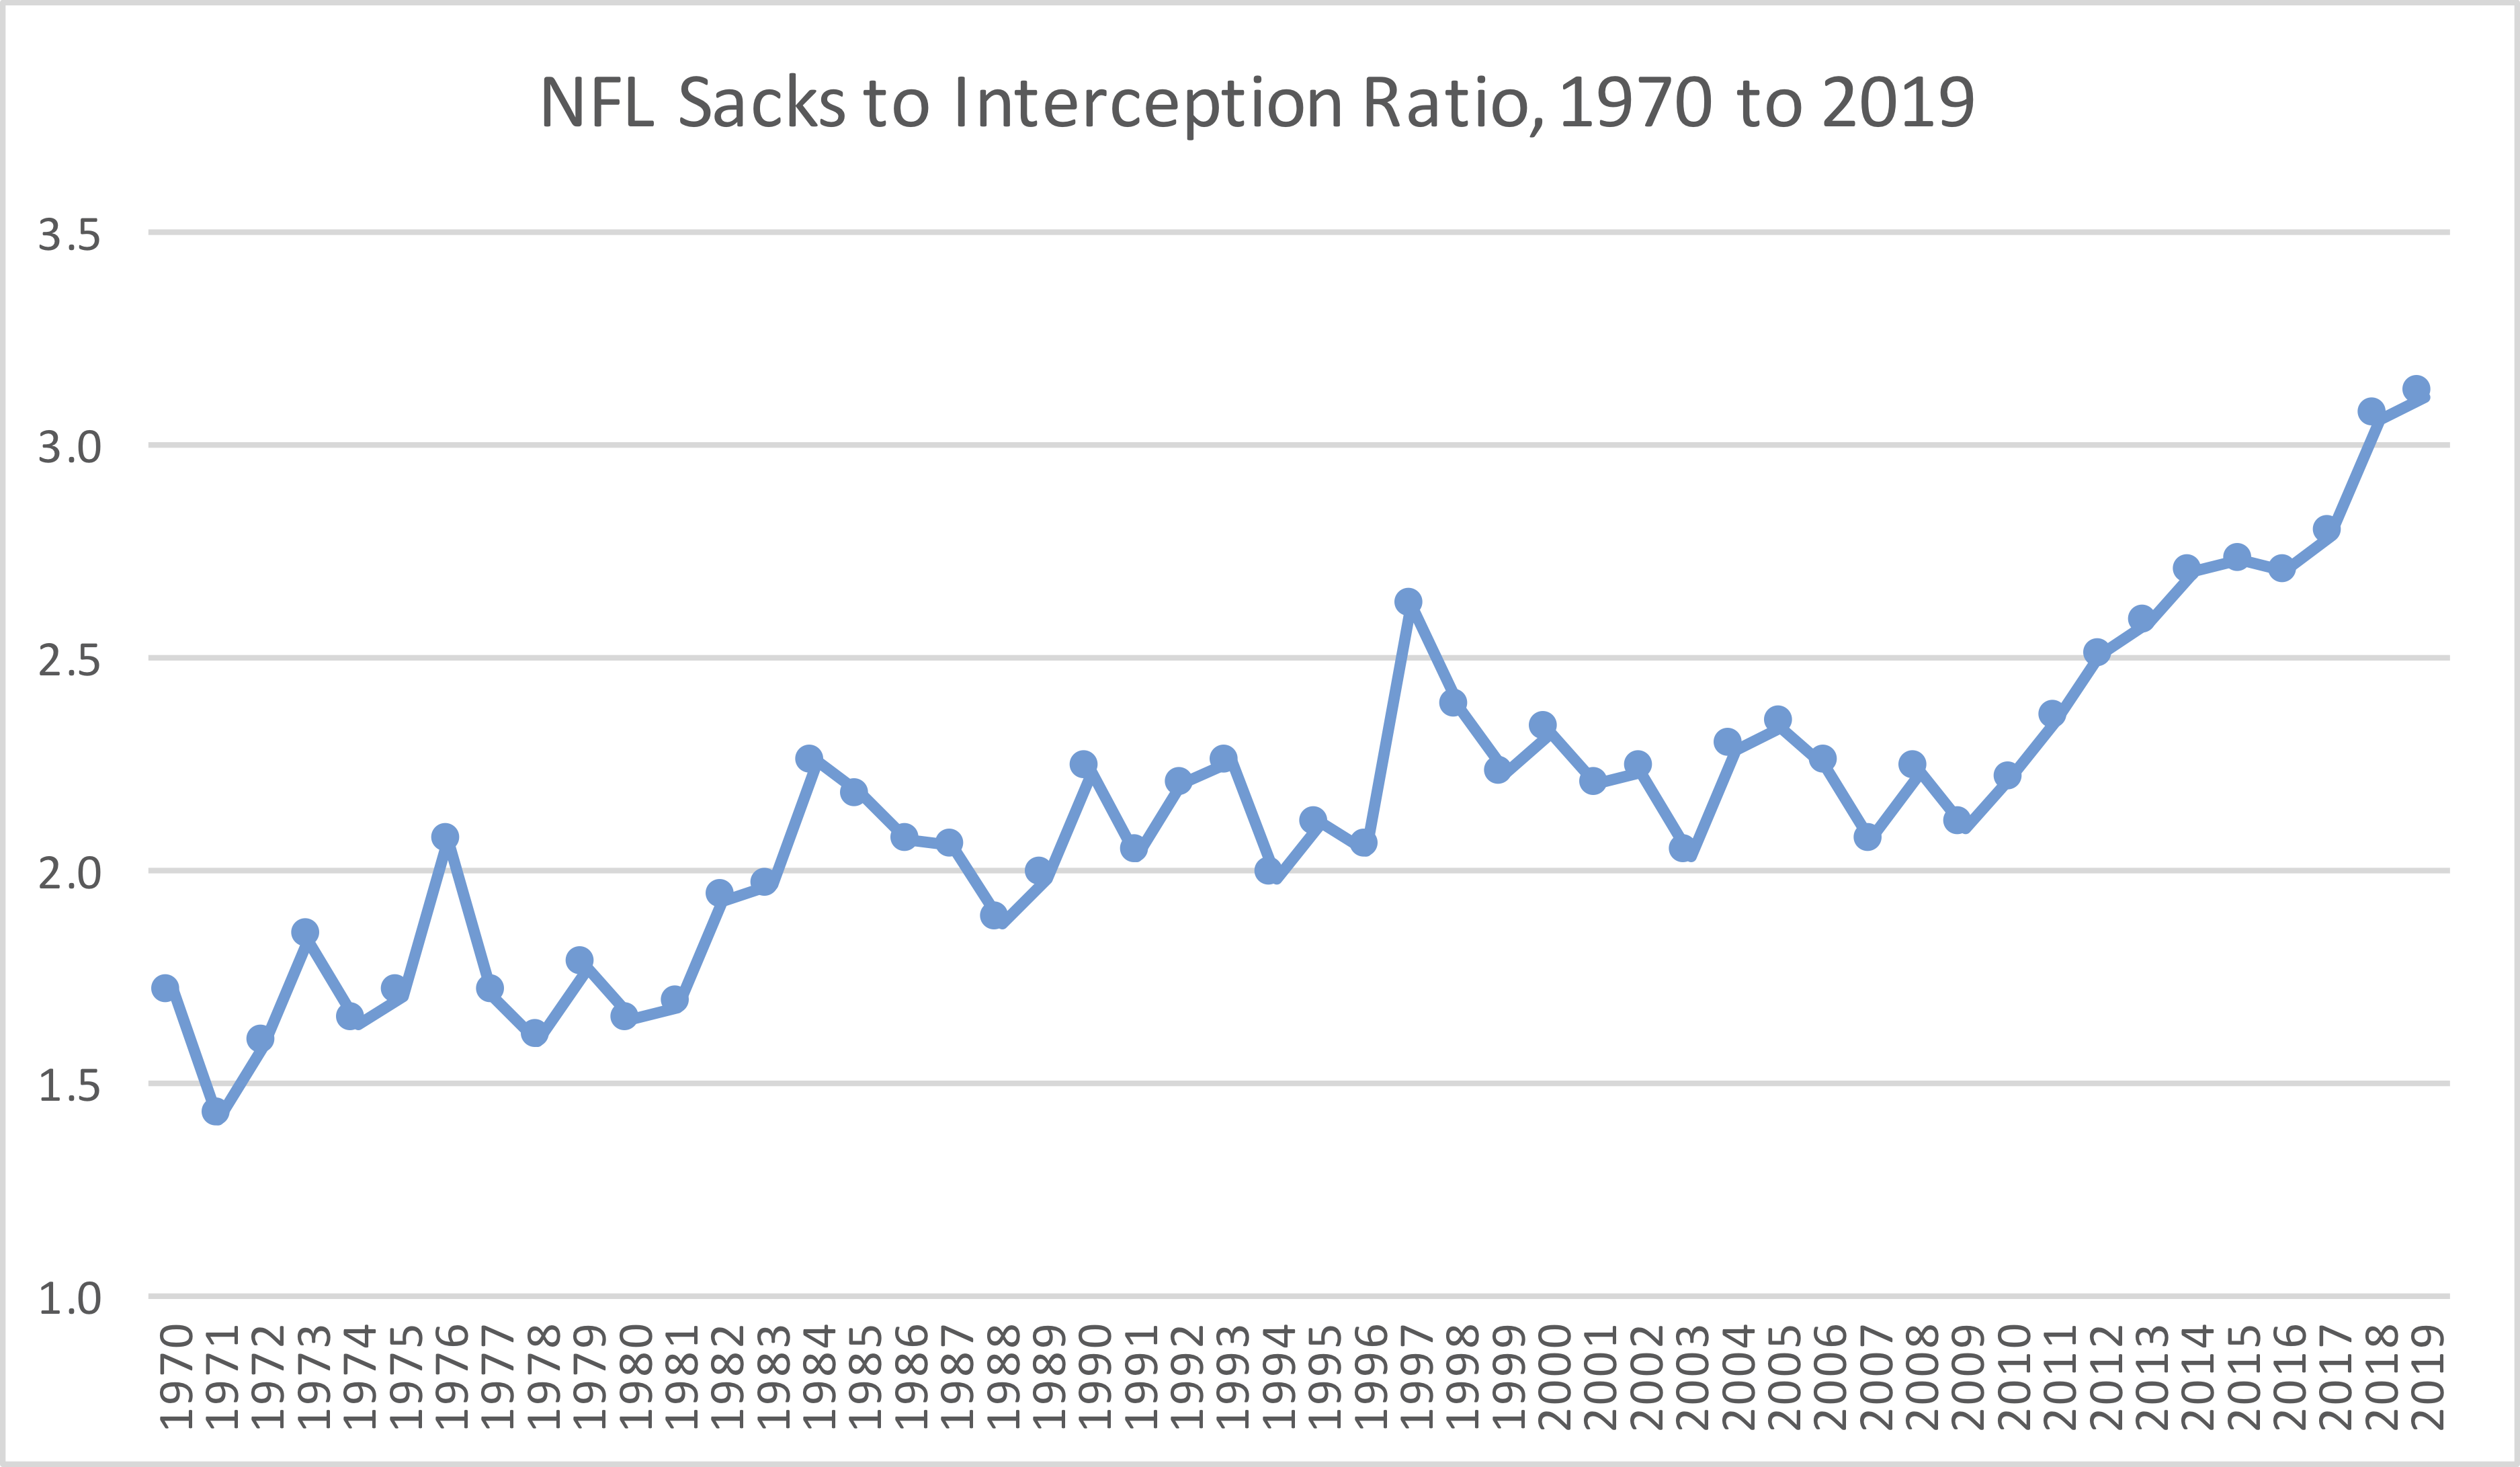
In 2019, teams averaged 3.11 sacks for every interception; that average was 2.79 from ’14 to ’18. The median sack in 2019 cost teams about 1.5 expected points, while the median interception costs teams about 4.1 expected points. That means, in the aggregate, sacks are costing teams more than interceptions! According to the #nflscrapr data, teams lost 1,762 expected points on interceptions and 2,308 expected points on sacks. This is almost certainly a new development in NFL history, where sacks are clearly and significantly more harmful than interceptions in the aggregate.
Up until recently, interceptions were always more costly than sacks, because each interception is significantly more harmful (on average) to an offense than each sack. But now that sacks are more than three times as likely to occur on a given play than an interception, that’s no longer the case. The graph below shows the number of sacks each season in the NFL divided by the number of interceptions thrown in that same season; as you can see, there is a clear upward trajectory, mostly due to a continuing decline in interception rate.
 Among other reasons, this is why TD/INT ratio is becoming a near useless statistic. The worst plays for an offense are no longer interceptions, because they are so rare. The worst plays now are sacks, which happy more than three times as often, and are about 35-40% as harmful as a given interception.