by Chase Stuart
on September 20, 2014
In the late ’80s, The Hidden Game of Football determined that an interception was worth -45 yards and a lost fumble was worth -50 yards. Why was a fumble five yards worse than a pick? That’s because Carroll, Thorn, and Palmer found that, on average, the team gained possession via the turnover was five yards closer to their opponent’s end zone when that turnover was a fumble.
Makes sense, but is that still true? Courtesy of Mike Kania of Pro-Football-Reference, here are some data on turnovers since 1999:
- Ignoring interceptions returned for touchdowns, the team recording the interception loses about 4.41 yards of field position, on average, on each interception. So let’s assume the Patriots are playing the Jets, the Patriots have the ball at their own 40, and New England throws an interception. On average, the Jets will (ignoring pick sixes) have 1st and 10 at the Patriots 44.4-yard line on the next play.
- If, instead, the Jets gained possession via a fumble, New York would, on average, start on the Patriots 39.2-yard line. That’s because following a fumble by an offense that is not returned for a touchdown, the line of scrimmage moves about 0.8 yards closer to the offense’s end zone.
- In other words, teams gain about 5.2 yards of field position when recovering a fumble rather than an interception. That’s kind of remarkable, considering it matches the results found from researchers in the ’80s. However…
- We still have to consider turnovers that are returned for touchdowns. Roughly 10.7% of interceptions were returned for touchdowns during this period, compared to only 7.9% of recovered fumbles. Remember, interceptions are now much more likely to be returned for touchdowns than they were in the mid-’80s.
Thirty years ago, the penalty was 45 yards for an interception and 50 yards for a lost fumble. We haven’t shown today whether those numbers in the abstract were correct, but the five yard relative difference still seems supported by current data, with one notable exception. But as more interceptions are returned for touchdowns , interceptions are becoming about as bad for offenses as lost fumbles.
Tagged as:
Pick 6
{ }
by Chase Stuart
on October 20, 2013
On Tuesday, I look at the quarterbacks who have thrown the most pick sixes. As a follow-up, I wondered: what’s the record for pick sixes by a defensive player against a quarterback? Rod Woodson is the career leader in interception return scores with twelve, but only two of those came against the same quarerback (Steve McNair, thirteen years apart). As it turns out, there have been at least three defensive players who have scored interception returns against the same quarterback.

The first of three pick sixes.
1)
Ronde Barber vs.
Donovan McNabb
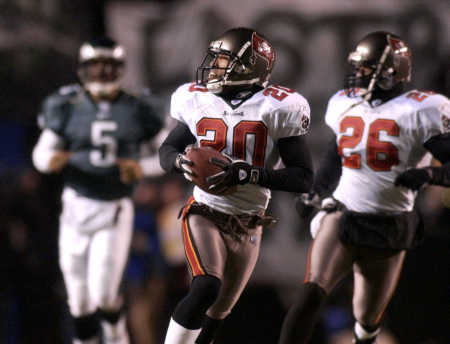
Perhaps the most famous play of Barber’s career was his 92-yard pick six to clinch the 2002 NFC Championship Game in Philadelphia. The Eagles, trailing by 10, had driven down to the Tampa Bay 10-yard line with just under four minutes left in the game. But Barber fooled McNabb into an easy interception, and raced down the right sideline for the game-clinching score. That was the second turnover of the day for Barber, who forced a McNabb fumble on a sack in the third quarter.
In 2006, Barber took back two McNabb passes for touchdowns in a defensive battle in Tampa Bay. The first pick six produced the only points in the first half, while the second gave the Bucs a 17-0 lead. But McNabb responded with three touchdowns, with the final one coming on a 52-yard reception by Brian Westbrook with less than a minute remaining. That gave the Eagles a 21-20 lead, which would have held…. except Matt Bryant hit a 62-yard field goal as time expired to give Tampa Bay the win. Philadelphia won the total yards battle 506-196, marking just the fourth time a team gained over 500 yards, allowed fewer than 200 yards, and still lost.
2) Bobby Bell vs. Charley Johnson
[continue reading…]
Tagged as:
Interceptions,
Pick 6
{ }
by Chase Stuart
on March 31, 2013
On Thursday, I looked at the increase in pick sixes per interception in the NFL. Brian Fremeau asked if that was also going on at the college level, so let’s take a look.
In 2012, there were 159 pick sixes according to cfbstats.com, matching the number provided at Sports-Reference.com. That’s right in line with previous numbers. The table below shows the number of pass attempts, interceptions, and pick sixes in major college football games since 2006, courtesy of cfbstats.com.
| Year | Pick 6 | INT | Att | INT Rate | Pick 6 Rt |
| 2012 | 159 | 1532 | 54545 | 2.8% | 10.4% |
| 2011 | 159 | 1490 | 51339 | 2.9% | 10.7% |
| 2010 | 159 | 1589 | 49776 | 3.2% | 10% |
| 2009 | 158 | 1537 | 49872 | 3.1% | 10.3% |
| 2008 | 162 | 1606 | 49828 | 3.2% | 10.1% |
| 2007 | 167 | 1711 | 52993 | 3.2% | 9.8% |
| 2006 | 163 | 1569 | 46011 | 3.4% | 10.4% |
It’s pretty interesting that the interception rates in college and the NFL are nearly identical. The interception rate in the NFL was 3.1% in 2007 and 2.9% in 2011, just about what it was in college football in those years. And with the exception of the crazy-high Pick Six rate in the NFL in 2012, both leagues see about 10% of all interceptions returned for touchdowns. Unfortunately, I don’t have the data to see if the Pick 6 rate was 5% in the ’50s in college football like it was in the NFL. But my guess is the trend would hold and that there’s an inverse relationship between interception rate and pick six rate.
Tagged as:
Interceptions,
Pick 6
{ }
by Chase Stuart
on March 28, 2013
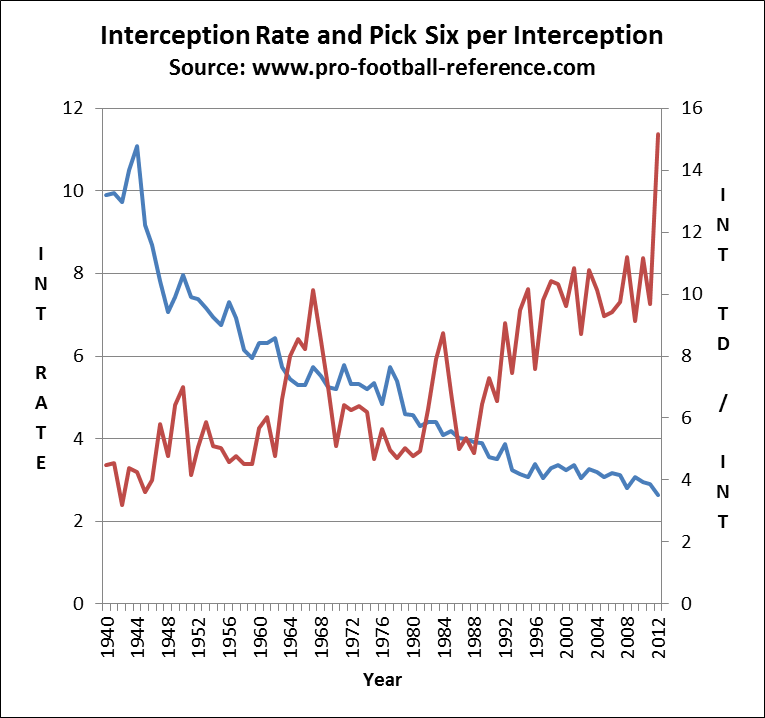
Good bit of trivia from my buddy Scott Kacsmar: there were 71 interceptions returned for touchdowns in 2012, the highest number in NFL history. Another interesting fact about the 2012 season: just 2.6 interceptions were thrown per 100 attempts, the lowest figure in NFL history.
We already know that the league-wide interception rate has been rapidly decreasing for years, but the significant increase in interceptions returned for touchdowns per interception is an under-reported story. Last year was the year of the Pick Six, but the Pick Six rate (INTs returned for touchdowns per interception) has been on the rise for several years. The graph below shows both the interception rate (100*INTs/Att) in blue (and measured against the left vertical axis) and the Pick Six rate (100*INT TDs/INT) in red (and measured against the right vertical axis):
[continue reading…]
Tagged as:
Interceptions,
Pick 6
{ }