≡ Menu

In Part I, we learned that there is a correlation between 40-yard dash times and wide receiver success in the NFL. Today, I want to look at a third variable: NFL Draft status.

My sample once again comprises the 853 wide receivers who ran the 40-yard dash at the NFL combine from 2000 to 2017. All data is publicly available from PFR, via Stathead Football. If you think there was a strong correlation between 40-yard dash time and NFL production, wait until you see the correlation between 40-yard dash time and draft status.

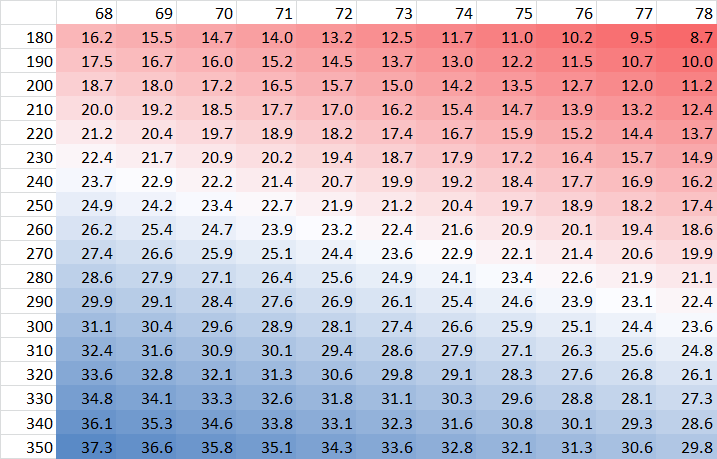
In the table below, the average draft value represents the FP draft value associated with each pick. A higher number means more draft value — i.e., an earlier pick — was used to select those players. [continue reading…]

{ 0 comments }

Over at FiveThirtyEight, Josh Hermsmeyer recently wrote about wide receivers and 40-yard dash times. Using yards per route run as his measure of productivity, Josh concluded “that higher speed isn’t associated with higher on-field production.” Today I want to take a deep dive into the question of how much 40-yard dash times are correlated with wide receiver success. For a very long time, people have argued that 40-yard dash times are overrated (actually, for a very long time, people have argued that just about everything is overrated). But such a comment is paper thin, because it’s unclear exactly how “rated” 40-yard dash times are, anyway. So let’s skip the overrated/underrated analysis and dive into the data.

My sample comprises the 853 wide receivers who ran the 40-yard dash at the NFL combine from 2000 to 2017. [1]Why those years? PFR’s data only goes back to 2000, and players who participated at the combine more recently than 2017 have not yet accrued four NFL seasons. All data is publicly available from PFR, via Stathead Football. I then looked at how many receiving yards those players gained in their first four seasons in the NFL. [2]Chosen because this represents the average length of a rookie contract. The question of what metric to use to measure production is a complicated one: receiving yards is not perfect (and I will revisit this decision at the end of the article), but it should work well enough for these purposes.

On average, these 853 players ran the 40-yard dash in 4.51 seconds and gained a total of 678 receiving yards in their first four seasons; this includes the 360 of them who never gained a receiving yard in the NFL. The top three wide receivers by receiving yards over this period [3]This analysis, of course, excludes players who were not invited to the combine like Tyreek Hill and Josh Gordon, undrafted players like Victor Cruz, Robby Anderson, and Doug Baldwin, and players who … Continue reading were Michael Thomas, A.J. Green, and Anquan Boldin, who ran the 40-yard dash in 4.57, 4.48, and 4.72 seconds, respectively. Strike one for 40-yard dash times mattering. The fastest two players were John Ross and Donte’ Stallworth, who both ran the 40 in 4.22 seconds. [4]That might sound like strike two, but Stallworth was tied for the 61st most receiving yards out of this group if 853 receivers. It’s a strike for 40-yard dash time being the only thing that … Continue reading

But anecdotes can only take us so far when we have 853 players, from Ross and Stallworth on the far left, to Thomas up at the top, all the way to Mississippi State’s De’Runnya Wilson, who never played in the NFL and ran the 40 in 4.85 seconds. [continue reading…]

References

References
1 Why those years? PFR’s data only goes back to 2000, and players who participated at the combine more recently than 2017 have not yet accrued four NFL seasons.
2 Chosen because this represents the average length of a rookie contract.
3 This analysis, of course, excludes players who were not invited to the combine like Tyreek Hill and Josh Gordon, undrafted players like Victor Cruz, Robby Anderson, and Doug Baldwin, and players who skipped the combine like Corey Davis.
4 That might sound like strike two, but Stallworth was tied for the 61st most receiving yards out of this group if 853 receivers. It’s a strike for 40-yard dash time being the only thing that matters, but not for 40-yard dash time having any value.
{ 16 comments }

As you can imagine, heavier players fare much worse in the 3-cone drill, and taller players have a slight advantage, too. Here was the best-fit formula from the 2019 combine:

Expected 3-Cone Drill = 7.4183 – 0.0287 * Height (Inches) + 0.0081 * Weight (Pounds)

Michigan defensive back David Long, who posted the fastest (but not the best) time in he dominated in the short shuttle, finishing in 6.45 seconds, the fastest time in the drill. Given his dimensions — 71 inches, 196 pounds — he’d be expected to complete the drill in 6.97 seconds. Therefore, Ford finished the drill in 0.52 seconds better than expected, the best adjusted performance in this drill.

Below is a chart showing the expected 3-Cone Drill based on various heights and weights: [continue reading…]

{ 0 comments }

The 20-yard shuttle is the Combine’s approach to measure an athlete’s agility, short-range explosiveness, and lateral quickness. Here’s the description from NFL.com:

The athlete starts in the three-point stance, explodes out 5 yards to his right, touches the line, goes back 10 yards to his left, left hand touches the line, pivot, and he turns 5 more yards and finishes.

As you can imagine, heavier players fare much worse in this metric, and taller players have a slight advantage, too. The best-fit formula from the 2019 Combine using height and weight as inputs is: 4.13 -0.0125 * Height (Inches) + 0.00485 * Weight (Pounds). In other words, for every 20-21 pounds a player weighs, he would be expected to take an extra tenth of a second to complete the drill. Ohio State defensive end Nick Bosa is 6’4 and weighs 266 pounds; that’s a formula for just being average in this drill. But he wound up completing the workout in just 4.14 second, but we would have projected Bosa to take an extra 0.33 seconds to finish, which means he is your 2019 Short Shuttle champion. [continue reading…]

{ 0 comments }

The broad jump is a good way to measure a player’s all-around athletic ability. As a rule of thumb, the drill is heavily biased in favor of lighter players (who can jump farther since they weigh less), but it is also biased in favor of taller players, who have longer legs. Therefore, to adjust for weight and height, we use the following formula, based on the actual 2019 results:

Projected Broad Jump = 110.31 + 0.63 * Height (Inches) – 0.164 * Weight (Pounds)

Here’s a graph showing the expected broad jump results for a player based on a variety of different heights and weights.

Last year, Virginia Tech safety Terrell Edmunds (now with the Steelers, drafted 28th overall) posted the best broad jump. This year, it was safety Juan Thornhill of Virginia — who also posted the best vertical jump — who was the broad jump champion.

At just six feet tall, Thornhill wouldn’t be expected to dominate this event, but he did, jumping a whopping 141 inches. That’s tied for the second-most over the last two decades, and easily the best by a player 6’0 or shorter. The full results below.

RkPlayerPosSchoolHeightWtExp BJBroad JumpDiff
1Juan ThornhillSVirginia7220512214119
2Miles BoykinWRNotre Dame76220122.114017.9
3Ben BanoguEDGETCU75250116.513417.5
4Emanuel HallWRMissouri7420112414117
5D.K. MetcalfWRMississippi75228120.213413.8
6Parris CampbellWROhio St.7220512213513
7Otaro AlakaLBTexas A&M75239118.413112.6
8Corey BallentineCBWashburn71196122.913512.1
9Marvell TellSUSC74198124.413611.6
10Renell WrenDLArizona State77318106.711811.3
11Ken WebsterCBMississippi71203121.713311.3
12Brian BurnsEDGEFlorida St.7724911812911
13Andre DillardOTWashington St.77315107.111810.9
14Isaiah JohnsonCBHouston74208122.813310.2
15Ed OliverDLHouston74287109.912010.1
16Darius SlaytonWRAuburn73190125.11359.9
17Jordan BrailfordEDGEOklahoma St.75252116.21269.8
18Dexter WilliamsRBNotre Dame71212120.31309.7
19Noah FantTEIowa76249117.31279.7
20Chris LindstromOLBoston College76308107.71179.3
21Justin LayneCBMichigan St.74192125.41348.6
22Travis HomerRBMiami70201121.41308.6
23Alexander MattisonRBBoise St.71221118.81278.2
24Montez SweatEDGEMississippi St.78260116.81258.2
25Mike JacksonCBMiami73210121.91308.1
26Justice HillRBOklahoma St.70198121.91308.1
27Trysten HillDLCentral Florida753081071158
28Sione TakitakiLBBYU73238117.31257.7
29Michael JordanOTOhio St.78312108.31167.7
30Jamel DeanCBAuburn73206122.51307.5
31L.J. CollierDLTCU74283110.51187.5
32Alex BarnesRBKansas St.72226118.61267.4
33Devin BushLBMichigan71234116.71247.3
34Rashan GaryDLMichigan76277112.81207.2
35Yosh NijmanOTVirginia Tech79324106.91147.1
36Lonnie JohnsonCBKentucky742131221297
37Blake CashmanLBMinnesota73237117.41246.6
38Sheldrick RedwineSMiami72196123.51306.5
39Hakeem ButlerWRIowa St.77227121.61286.4
40Ty SummersLBTCU73241116.81236.2
41Gary JenningsWRWest Virginia73214121.21275.8
42Isaiah PrinceOTOhio St.78305109.41155.6
43Kevin GivensDLPenn St.73285109.51155.5
44T.J. HockensonTEIowa77251117.61235.4
45Jordan BrownCBSouth Dakota St.72201122.71285.3
46Trey PipkinsOTSioux Falls78309108.81145.2
47Cameron SmithLBUSC74238117.91235.1
48Greg LittleOTMississippi773101081135
49Maxx CrosbyDLEastern Michigan772551171225
50Andrew Van ginkelLBWisconsin752411181235
51Kris BoydCBTexas71201122.11274.9
52Bobby OkerekeLBStanford73239117.11224.9
53Kahale WarringTESan Diego St.77252117.51224.5
54Jordan JonesLBKentucky74234118.51234.5
55Derrek ThomasCBBaylor75189126.61314.4
56Travis FulghamWROld Dominion74215121.71264.3
57Foster MoreauTELSU76253116.71214.3
58Jamal DavisEDGEAkron75243117.71224.3
59Quinnen WilliamsDLAlabama75303107.91124.1
60John CominskyDLCharleston77286111.91164.1
61Donovan WilsonSTexas A&M721991231274
62Jerry TilleryDLNotre Dame78295111.11153.9
63Greg GainesDLWashington73312105.11093.9
64Connor McGovernOLPenn St.77308108.31123.7
65Tyler JonesOTNorth Carolina St.75306107.41113.6
66Miles SandersRBPenn St.71211120.41243.6
67Drue TranquillLBNotre Dame74234118.51223.5
68Terry McLaurinWROhio St.72208121.51253.5
69Darnell SavageSMaryland71198122.61263.4
70Trevon WescoTEWest Virginia75267113.81173.2
71Iosua OpetaOLWeber St.76301108.81123.2
72Ben Burr-KirvenLBWashington72230117.91213.1
73Karan HigdonRBMichigan692061201233
74David MontgomeryRBIowa St.702221181213
75Kaleb McGaryOTWashington79317108.11112.9
76William SweetOTNorth Carolina78313108.11112.9
77Alize MackTENotre Dame76249117.31202.7
78Porter GustinEDGEUSC76255116.41192.6
79Phil HaynesOLWake Forest76322105.41082.6
80Wyatt RayEDGEBoston College75257115.41182.6
81Saquan HamptonSRutgers73206122.51252.5
82Nkeal HarryWRArizona State74228119.51222.5
83Stanley MorganWRNebraska72202122.51252.5
84Amani HookerSIowa71210120.61232.4
85Gary JohnsonLBTexas72226118.61212.4
86Derrick BaityCBKentucky74197124.61272.4
87Anthony NelsonDLIowa79271115.61182.4
88Dalton RisnerOTKansas St.77312107.61102.4
89Byron CowartDLMaryland75298108.71112.3
90Sean BuntingCBCentral Michigan72195123.71262.3
91Emeke EgbuleLBHouston74245116.71192.3
92David LongLBWest Virginia71227117.81202.2
93Max ScharpingOTNorthern Illinois78327105.81082.2
94Josh AllenEDGEKentucky77262115.81182.2
95Blace BrownCBTroy72194123.81262.2
96Charles OmenihuDLTexas77280112.91152.1
97Deebo SamuelWRSouth Carolina71214119.91222.1
98Damien HarrisRBAlabama702161191212
99Darrell HendersonRBMemphis682081191212
100Oshane XiminesEDGEOld Dominion75253116.11181.9
101Carl GrandersonEDGEWyoming77254117.21191.8
102Bisi JohnsonWRColorado St.72204122.21241.8
103Joshua MilesOTMorgan St.77314107.31091.7
104Elgton JenkinsOLMississippi St.76310107.31091.7
105Trayveon WilliamsRBTexas A&M68206119.41211.6
106Lj ScottRBMichigan St.72227118.41201.6
107Nick BosaDLOhio St.76266114.61161.4
108Jazz FergusonWRNorthwestern St. (LA)77227121.61231.4
109A.J. BrownWRMississippi72226118.61201.4
110Benny SnellRBKentucky70224117.71191.3
111Nate DavisOLCharlotte75316105.71071.3
112Devin WhiteLBLSU72237116.81181.2
113Tyrel DodsonLBTexas A&M72237116.81181.2
114Davante DavisCBTexas74202123.81251.2
115Christian WilkinsDLClemson75315105.91071.1
116Keenen BrownTETexas St.74250115.91171.1
117Jaylen SmithWRLouisville742191211221
118Christian MillerEDGEAlabama752471171181
119Jamal CustisWRSyracuse76214123.11240.9
120Justin HollinsEDGEOregon77248118.11190.9
121Dre GreenlawLBArkansas71237116.21170.8
122Daylon MackDLTexas A&M73336101.21020.8
123Terrill HanksLBNew Mexico St.74242117.21180.8
124Ryan ConnellyLBWisconsin74242117.21180.8
125Tyree JacksonQBBuffalo79249119.21200.8
126Marquise BlairSUtah73195124.31250.7
127Kingsley KekeDLTexas A&M75288110.31110.7
128Will HarrisSBoston College73207122.31230.7
129Ryan DavisWRAuburn70189123.41240.6
130Zedrick WoodsSMississippi71205121.41220.6
131Sutton SmithEDGENorthern Illinois72233117.41180.6
132Daniel WiseDLKansas75281111.51120.5
133Alex WesleyWRNorthern Colorado72190124.51250.5
134Chase WinovichEDGEMichigan75256115.61160.4
135Riley RidleyWRGeorgia73199123.71240.3
136Mack WilsonLBAlabama73240116.91170.1
137Ashton DulinWRMalone University (Ohio)732151211210
138Zach AllenDLBoston College76281112.1112-0.1
139Tony PollardRBMemphis72210121.2121-0.2
140Cody FordOTOklahoma76329104.2104-0.2
141Jackson BartonOTUtah79310109.2109-0.2
142Tyler RoemerOTSan Diego St.78312108.3108-0.3
143Andrew WingardSWyoming72209121.4121-0.4
144Alec IngoldFBWisconsin73242116.6116-0.6
145Anthony JohnsonWRBuffalo74209122.6122-0.6
146Trayvon MullenCBClemson73199123.7123-0.7
147Dan GodsilLSIndiana76241118.7118-0.7
148Jordan MillerCBWashington73186125.8125-0.8
149Elijah HolyfieldRBGeorgia70217118.8118-0.8
150Oli UdohOTElon77323105.8105-0.8
151Montre HartageCBNorthwestern71190123.9123-0.9
152Josh OliverTESan Jose St.77249118117-1
153Deion CalhounOLMississippi St.74310106.1105-1.1
154Evan WorthingtonSColorado74212122.2121-1.2
155Diontae JohnsonWRToledo70183124.4123-1.4
156Johnnie DixonWROhio St.70201121.4120-1.4
157Dre'Mont JonesDLOhio St.75281111.5110-1.5
158Erik McCoyOLTexas A&M76303108.5107-1.5
159Khalen SaundersDLWestern Illinois72324102.5101-1.5
160Easton StickQBNorth Dakota St.73224119.6118-1.6
161Germaine PrattLBNorth Carolina St.74240117.6116-1.6
162Andy IsabellaWRMassachusetts69188122.9121-1.9
163D'Cota DixonSWisconsin70204120.9119-1.9
164Dillon MitchellWROregon73197124122-2
165Drew SampleTEWashington77255117115-2
166Julian LoveCBNotre Dame71195123.1121-2.1
167Cody BartonLBUtah74237118.1116-2.1
168Jaquan JohnsonSMiami70191123.1121-2.1
169Khari WillisSMichigan St.71213120.1118-2.1
170Myles GaskinRBWashington69205120.2118-2.2
171Devin SingletaryRBFlorida Atlantic67203119.2117-2.2
172Dakota AllenLBTexas Tech73232118.2116-2.2
173Daniel JonesQBDuke77221122.6120-2.6
174Jeff AllisonLBFresno St.71228117.6115-2.6
175Saivion SmithCBAlabama73199123.7121-2.7
176John BattleSLSU72201122.7120-2.7
177Nick BrossetteRBLSU71209120.8118-2.8
178Malik CarneyEDGENorth Carolina74251115.8113-2.8
179Gerri GreenEDGEMississippi St.76252116.9114-2.9
180David LongCBMichigan71196122.9120-2.9
181Tytus HowardOTAlabama St.77322106103-3
182Michael DeiterOLWisconsin77309108.1105-3.1
183Jamarius WayWRSouth Alabama75215122.3119-3.3
184Amani OruwariyeCBPenn St.74205123.3120-3.3
185Garrett BradburyOLNorth Carolina St.75306107.4104-3.4
186Gardner MinshewQBWashington St.73225119.4116-3.4
187James WilliamsRBWashington St.69197121.5118-3.5
188Kendall BlantonTEMissouri78262116.5113-3.5
189Chauncey Gardner-JohnsonSFlorida71210120.6117-3.6
190Hjalte FroholdtOLArkansas77306108.6105-3.6
191Cody ThompsonWRToledo73205122.7119-3.7
192Kelvin HarmonWRNorth Carolina St.74221120.7117-3.7
193Dennis DaleyOTSouth Carolina77317106.8103-3.8
194Jalen JelksEDGEOregon77256116.8113-3.8
195Byron MurphyCBWashington71190123.9120-3.9
196Alijah HolderCBStanford73191125121-4
197Jace SternbergerTETexas A&M76251117113-4
198Hamp CheeversCBBoston College69169126.1122-4.1
199Joe JacksonDLMiami76275113.1109-4.1
200Andre JamesOTUCLA76299109.1105-4.1
201Mitch WishnowskyPUtah74218121.2117-4.2
202Rock Ya-SinCBTemple72192124.2120-4.2
203Jonathan LedbetterDLGeorgia76280112.3108-4.3
204Paul AdamsOTMissouri78317107.5103-4.5
205Cece JeffersonEDGEFlorida73266112.7108-4.7
206Mecole HardmanWRGeorgia70187123.7119-4.7
207Lil'Jordan HumphreyWRTexas76210123.7119-4.7
208Damarkus LodgeWRMississippi74202123.8119-4.8
209Qadree OllisonRBPittsburgh73228118.9114-4.9
210Jordan ScarlettRBFlorida71208120.9116-4.9
211Ryquell ArmsteadRBTemple71220119114-5
212Mike BellSFresno St.75210123.1118-5.1
213Deandre BakerCBGeorgia71193123.4118-5.4
214Johnathan AbramSMississippi St.71205121.4116-5.4
215Jakobi MeyersWRNorth Carolina St.74203123.6118-5.6
216Deshaun DavisLBAuburn71234116.7111-5.7
217Caleb WilsonTEUCLA76240118.8113-5.8
218David SillsWRWest Virginia75211122.9117-5.9
219Tyre BradyWRMarshall75211122.9117-5.9
220Ryan BatesOLPenn St.76306108102-6
221Ugo AmadiSOregon69199121.1115-6.1
222Keesean JohnsonWRFresno St.73201123.3117-6.3
223Rashad FentonCBSouth Carolina71193123.4117-6.4
224Brett RypienQBBoise St.74210122.5116-6.5
225Jake BaileyPStanford73200123.5117-6.5
226Albert HugginsDLClemson75305107.5101-6.5
227Taylor RappSWashington72208121.5115-6.5
228Nick FitzgeraldQBMississippi St.77226121.7115-6.7
229Zack BaileyOLSouth Carolina77299109.8103-6.8
230Chris SlaytonDLSyracuse76307107.8101-6.8
231Emmanuel ButlerWRNorthern Arizona75217122115-7
232Mitch HyattOTClemson77303109.1102-7.1
233Irv SmithTEAlabama74242117.2110-7.2
234Zach GentryTEMichigan80265117.2110-7.2
235Ryan FinleyQBNorth Carolina St.76213123.2116-7.2
236Malik GantSMarshall72209121.4114-7.4
237Antoine WesleyWRTexas Tech76206124.4117-7.4
238Trace McSorleyQBPenn St.72202122.5115-7.5
239Joe Giles-HarrisLBDuke74234118.5111-7.5
240Jonathan CrawfordSIndiana73205122.7115-7.7
241Dru SamiaOTOklahoma77305108.8101-7.8
242Terry GodwinWRGeorgia71184124.9117-7.9
243Lukas DenisSBoston College71190123.9116-7.9
244Darius WestSKentucky71208120.9113-7.9
245Jack FoxPRice74213122114-8
246Dax RaymondTEUtah St.77255117109-8
247Hunter RenfrowWRClemson70184124.2116-8.2
248Demarcus ChristmasDLFlorida St.75294109.3101-8.3
249Jonah WilliamsOTAlabama76302108.7100-8.7
250Drew LockQBMissouri76228120.8112-8.8
251Jovon DuranteWRFlorida Atlantic71160128.8120-8.8
252Kaden SmithTEStanford77255117108-9
253Javon PattersonOLMississippi75307107.298-9.2
254Will GrierQBWest Virginia74217121.3112-9.3
255Ryan PulleyCBArkansas71209120.8111-9.8
256David EdwardsOTWisconsin78308108.999-9.9
257Nyqwan MurrayWRFlorida St.70191123.1113-10.1
258Jake BrowningQBWashington74211122.3112-10.3
259Jarrett StidhamQBAuburn74218121.2110-11.2
260Isaiah BuggsDLAlabama75306107.496-11.4
261Terry BecknerDLMissouri76296109.698-11.6
262Jordan Ta'amuQBMississippi75221121.3109-12.3
263Nate HerbigOLStanford75335102.690-12.6
264Kyle ShurmurQBVanderbilt76230120.5106-14.5
265Devon JohnsonOTFerris St.79338104.689-15.6
266Derwin GrayOTMaryland76320105.790-15.7
{ 0 comments }

Last year, Penn State tight end (and now Miami Dolphin) Mike Gesicki had the best vertical jump at the Combine. In general, the vertical jump favors lighter players and taller players: it’s easier to produce a big vertical jump if you have long legs and are carrying less mass.

The best-fit formula to estimate a player’s vertical jump at the 2019 Combine would be predicted using the following formula:

Projected VJ = 36.85 + 0.173 * height (inches) – 0.0667 * weight (pounds)

Using that formula, Virginia safety Juan Thornhill produced the top vertical jump at the 2019 Combine. Standing six feet even and weighing 205 pounds, we would expect such a player to have a 35.6″ vertical. Thornhill, meanwhile, had a remarkable 44″ vertical jump. [continue reading…]

{ 0 comments }

Last year, Georgia running back Nick Chubb was the leader in the bench press. This year, Kansas State running back Alex Barnes — who led the Big 12 in rushing — was your top muscle man. The bench press is an exercise that measures upper body strength, but it is biased in favor of heavier players and shorter players.

The best-fit formula to project bench press reps for the 2019 Combine was:

Expected BP reps = 45.00 -0.7513 * Height (Inches) + 0.1240 * Weight (Pounds)

For example, here are the projected reps for a player at the 2019 Combine with each of the following heights (in inches) and weights (in pounds):

[continue reading…]

{ 1 comment }

As I do each year, I like to analyze the results from the NFL combine but adjust for height and weight.

Based on the results in Indianapolis in 2019, the best way to project estimated 40-yard dash times based on weight and height was to use the following formula:

Estimated 40-yard dash time = 3.569 -0.002 * height (inches) + 0.005426 x weight (lbs)

Weight has a much bigger role than height when calculating estimated 40 times, and you can see that in the graph below, which represents the estimated 40 times for a player at the ’19 Combine at various heights and weights: [continue reading…]

{ 0 comments }

Sweat is an elite athlete.

Last year, edge rushers Marcus Davenport (14th overall pick by the Saints) and Lorenzo Carter (66th pick by the Giants) ran the top weight-adjusted times in the 40-yard dash.  For perspective, Davenport weighed in at 264 and ran a 4.58, while Carter was 450 pounds and ran a 4.50.  Based on the best-fit formula from the 2018 combine, every 5 additional pounds of player weight corresponded to taking about 3 hundredths of a second longer to run the 40, so Davenport and Carter essentially tied for having the best time in the race.

This year, there was no tie.  In fact, it wasn’t particularly close, as Mississippi State edge rusher Montez Sweat weighted 260 pounds but ran a 4.41!

PFR has 40-yard dash times at the NFL combine going back to 2000. Over that time period, there have been a number of players who have run the race in 4.45 or fewer seconds at a decent weight, and a number of players at 250 pounds or heavier who ran a sub 4.70 40. But being both heavy and lightning fast is pretty unusual. In fact, Sweat and Vernon Davis (2006, 254, 4.38) really stand out in this regard.

The graph below shows the heavy guys who ran fast times, and the fast guys who weren’t super skinny, going back to 2000.  The X-Axis shows weight, and the Y-Axis shows 40 time, in reverse order.  You want to be up and to the right, and Davis and Sweat (both colored in red) stand out the most in that regard.  The top left is all the super fast players, and the bottom right is all the heavy athletes, but it’s the rare athlete who could hang out in either group.  Davis and Sweat are those rare athletes. [continue reading…]

{ 0 comments }

The broad jump isn’t the sexiest of drills, but it is another good way to measure a player’s all-around athletic ability. As a rule of thumb, the drill is biased in favor of lighter players (who can jump farther since they weigh less), but it’s also biased towards taller players, who have longer legs. Therefore, to adjust for weight and height, we use the following formula:

Broad Jump = 84.14 + 1.0766 * Height (Inches) – 0.1940 * Weight (Pounds)

Virginia Tech linebacker Tremaine Edmunds is expected to be a high first round pick, but his brother Terrell — a safety with the Hokies — was the combine champion at this event.  Standing 6’2, 220 pounds, Edmunds has prototypical safety size and is an elite athlete.  He had the 5th-best weight adjusted vertical, as he jumped a combine-high 41.5 inches.  In the broad jump, he would be expected to leap 121.1 inches based on his height and weight; in reality, he jumped 134 inches, or 12.9 inches above expectation.  That was the best mark at the 2018 combine.

The full results, below: [continue reading…]

{ 1 comment }

Penn State RB Saquon Barkley is your bronze champion. The star athlete ranked 3rd in the bench press after adjusting for weight and height, with his 29 reps tied for the most by any running back. And he ranked 3rd in the 40-yard dash after adjusting for weight; his 4.40 time was the second fastest among running backs, and the only player faster weighed 35 fewer pounds.

And today, you’ll see that Barkley ranked third in the vertical jump, too. The best-fit formula for projecting the vertical jump is as follows:

Projected VJ = 46.38 – 0.0597 * weight (pounds)

At 233 pounds, Barkley would be expected to have a 32.5 inch vertical jump. In reality, he jumped 41 inches, or 8.5 inches above expectation. That was the third-best mark at the combine, but only the 2nd best among Nittany Lions. That’s because Penn State TE Mike Gesicki jumped 41.5 inches at a whopping 247 pounds, or 9.9 inches above expectation.  The 40/240 club — jumping at least 40 inches while weighing at least 240 pounds — is a small one, and Gesicki stands out as being an elite athlete.

But it’s hard to compete with Barkley, who was dominant at the combine in the bench press, the 40, and the vertical jump. The full list, below: [continue reading…]

{ 1 comment }

Last year, Auburn defensive end Carl Lawson was your bench press champion. He finished ever so slightly ahead of Myles Garrett, and while Garrett was the first overall pick in the 2017 Draft, Lawson was a fourth rounder. But in 2017, Lawson led all rookies with 8.0 sacks, while Garrett finished second with 7.0 sacks (he did lead all rookies with 0.63 sacks per game). So does the bench press mean much? Who knows, but that won’t stop me from crunching the data from the 2018 combine.

The best-fit formula to project bench press reps for the 2017 Combine was:

Expected BP reps = 17.401 -0.3354 * Height (Inches) + 0.1075 * Weight (Pounds)

I used that formula to run through the 2018 combine numbers. The result? Georgia RB Nick Chubb was your bench press champion. Penn State RB Saquon Barkley, who ranked 3rd in yesterday’s results on the 40-yard dash, had another third-place finish. The full results, below.

RkNameCollegePOSWeight (lbs)Height (in)Exp BPBench PressDiff BP
1Nick ChubbGeorgiaRB2277118.02911.0
2Kylie FittsUtahDE2637620.23110.8
3Saquon BarkleyPenn StateRB2337218.32910.7
4Natrell JamersonWisconsinFS1987214.52510.5
5Dane CruikshankArizonaSS2067315.1259.9
6Braden SmithAuburnOG3157825.1359.9
7B.J. HillNorth Carolina StateDT3117625.3359.7
8Malik JeffersonTexasILB2367517.6279.4
9Will HernandezTexas-El PasoOG3277427.7379.3
10Christian SamArizona StateILB2447418.8289.2
11Tegray ScalesIndianaILB2307218.0279.0
12Quenton NelsonNotre DameOG3257726.5358.5
13Leon JacobsWisconsinOLB2467518.7267.3
14Andrew BrownVirginiaDE2967623.7317.3
15Davontae HarrisIllinois StateCB2007214.8227.2
16Colby GossettAppalachian State (NC)OG3117725.0327.0
17Foley FatukasiConnecticutDT3187626.1336.9
18Ogbonnia OkoronkwoOklahomaDE2537320.1276.9
19Taven BryanFloridaDT2917623.2306.8
20Anthony MillerMemphisWR2017115.2226.8
21Ola AdeniyiToledoDE2487419.2266.8
22JMon MooreMissouriWR2077514.5216.5
23Jordan WhiteheadPittsburghFS1957114.6216.4
24Genard AveryMemphisILB2487319.6266.4
25Lavon ColemanWashingtonRB2157116.7236.3
26Mike HughesCentral FloridaCB1917114.1205.9
27Chris WarrenTexasRB2477419.1255.9
28Hercules MataAfaWashington StateOLB2547320.2265.8
29Derwin JamesFlorida StateSS2157515.4215.6
30Marquis HaynesMississippiOLB2357517.5235.5
31Sony MichelGeorgiaRB2147116.6225.4
32Trevor DanielTennesseeP2307317.6235.4
33Trevon YoungLouisvilleDE2587619.6255.4
34Kentavius StreetNorth Carolina StateDE2807422.7285.3
35Anthony WinbushBall State (IN)OLB2497319.7255.3
36Kyzir WhiteWest VirginiaSS2167415.8215.2
37James LooneyCaliforniaDE2877523.1284.9
38Kenny YoungUCLAILB2367318.3234.7
39Davon GraysonEast Carolina (NC)WR1997314.3194.7
40Harold LandryBoston CollegeOLB2527519.3244.7
41Michael JosephDubuque (IA)CB1817312.4174.6
42Christian KirkTexas A&MWR2017015.5204.5
43Jerome BakerOhio StateOLB2297317.5224.5
44Josh JacksonIowaCB1927313.6184.4
45Taron JohnsonWeber State (UT)CB1807212.6174.4
46Wyatt TellerVirginia TechOG3147625.7304.3
47Tre FlowersOklahoma StateSS2007513.7184.3
48Bilal NicholsDelawareDT3067624.8294.2
49DaShawn HandAlabamaDE2977623.8284.2
50Dorian ODanielClemsonOLB2237316.9214.1
51Chris CovingtonIndianaOLB2457418.9234.1
52James HearnsLouisvilleOLB2397517.9224.1
53Kendrick NortonMiami (FL)DT3147526.0304.0
54Dallas GoedertSouth Dakota StateTE2567719.1233.9
55Mike GesickiPenn StateTE2477718.1223.9
56Godwin IgwebuikeNorthwesternFS2057215.3193.7
57Kamryn PettwayAuburnRB2337218.3223.7
58Keishawn BierriaWashingtonILB2307417.3213.7
59John Franklin-MyersStephen F. Austin (TX)DE2837622.3263.7
60Sam JonesArizona StateOG3057724.4283.6
61JaVon Rolland-JonesArkansas StateOLB2537419.8233.2
62Bradley ChubbNorth Carolina StateDE2697620.8243.2
63Joshua KaluNebraskaFS1957313.9173.1
64Jalyn HolmesOhio StateDE2837722.0253.0
65Darius JacksonJacksonville State (AL)OLB2427518.3212.7
66Chase EdmondsFordham (NY)RB2056916.3192.7
67Matt DickersonUCLADE2927623.3262.7
68Shaquem GriffinCentral FloridaOLB2277317.3202.7
69Josh AdamsNotre DameRB2137415.5182.5
70Damon WebbOhio StateSS1957114.6172.4
71Parry NickersonTulane (LA)CB1807212.6152.4
72Marcus DavenportTexas-San AntonioDE2647819.6222.4
73Mark WaltonMiami (FL)RB2027015.6182.4
74D.J. CharkLouisiana StateWR1997513.6162.4
75Siran NealJacksonville State (AL)SS1997214.6172.4
76Sean ChandlerTempleFS1907213.7162.3
77Brandon FacysonVirginia TechCB1977413.8162.2
78Shaun Dion HamiltonAlabamaILB2287217.8202.2
79Troy ApkePenn StateSS1987413.9162.1
80Garret DooleyWisconsinOLB2487518.9212.1
81Brian AllenMichigan StateC2987325.0272.0
82Chris HerndonMiami (FL)TE2537619.1211.9
83Trey QuinnSouthern Methodist (TX)WR2037115.4171.6
84Lowell LotuleleiUtahDT3157426.4281.6
85Joel IyiegbuniweWestern KentuckyILB2297317.5191.5
86Dylan CantrellTexas TechWR2267516.5181.5
87KC McdermottMiami (FL)OT3117824.7261.3
88Cole MadisonWashington StateOG3087724.7261.3
89Carlton DavisAuburnCB2037314.7161.3
90David WellsSan Diego StateTE2567818.8201.2
91Danny JohnsonSouthern (LA)CB1857013.8151.2
92Justin ReidStanfordFS2047314.8161.2
93Nick NelsonWisconsinCB2087115.9171.1
94Allen LazardIowa StateWR2277716.0171.0
95Jojo WickerArizona StateDE2967524.1250.9
96Frank RagnowArkansasC3127725.1260.9
97Roc ThomasJacksonville State (AL)RB1987015.2160.8
98Uchenna NwosuSouthern CaliforniaOLB2517519.2200.8
99Oren BurksVanderbiltOLB2337517.3180.7
100Marcus AllenPenn StateFS2027414.3150.7
101Kahlil MckenzieTennesseeDT3147725.3260.7
102Keke CouteeTexas TechWR1817013.4140.6
103Leighton Vander EschBoise StateOLB2567619.4200.6
104Dorance ArmstrongKansasDE2577619.5200.5
105Jason CabindaPenn StateILB2397318.6190.4
106Marcell HarrisFloridaSS2087215.6160.4
107Deshon ElliottTexasSS2057414.6150.4
108Kurt BenkertVirginiaQB2187515.7160.3
109Grant HaleyPenn StateCB1906914.7150.3
110Azeem VictorWashingtonILB2407318.7190.3
111Andre SmithNorth CarolinaILB2377218.7190.3
112Byron PringleKansas StateWR2037314.7150.3
113Holton HillTexasCB2007513.7140.3
114Chris CampbellPenn StateCB1947313.8140.2
115Tremaine EdmundsVirginia TechOLB2537718.8190.2
116Jaylen SamuelsNorth Carolina StateTE2257117.8180.2
117Max RedfieldIndiana (PA)SS2057315.0150.0
118Dominick SandersGeorgiaFS1937214.0140.0
119Alex CappaHumboldt State (CA)OT3057824.0240.0
120Josey JewellIowaILB2347318.118-0.1
121Trey WalkerLouisiana-LafayetteSS2007414.114-0.1
122Jordan WilkinsMississippiRB2167316.116-0.1
123Anthony AverettAlabamaCB1857213.113-0.1
124Jack CichyWisconsinILB2387418.218-0.2
125Chris JonesNebraskaCB1957214.214-0.2
126Jaire AlexanderLouisvilleCB1927114.214-0.2
127Scott QuessenberryUCLAC3107625.225-0.2
128Olubunmi RotimiOld Dominion (VA)DE2737621.321-0.3
129J.C. JacksonMarylandCB1937114.314-0.3
130Peter KalambayiStanfordOLB2527519.319-0.3
131Will ClappLouisiana StateC3117625.325-0.3
132Tony BrownAlabamaCB1987214.514-0.5
133Avonte MaddoxPittsburghCB1806913.613-0.6
134Darius LeonardSouth Carolina StateOLB2347417.717-0.7
135Dee DelaneyMiami (FL)CB1947313.813-0.8
136Durham SmytheNotre DameTE2537718.818-0.8
137D.J. MooreMarylandWR2107215.815-0.8
138Martinas RankinMississippi StateOT3087625.024-1.0
139Tanner CarewOregonLS2437319.018-1.0
140Ryan IzzoFlorida StateTE2567719.118-1.1
141Royce FreemanOregonRB2297118.217-1.2
142Nick DelucaNorth Dakota StateILB2517519.218-1.2
143Steven MitchellSouthern CaliforniaWR1897014.213-1.2
144Jarvion FranklinWestern MichiganRB2397119.318-1.3
145Duke DawsonFloridaCB2087016.315-1.3
146Ade ArunaTulane (LA)DE2627819.418-1.4
147Tyler ConklinCentral MichiganTE2547519.618-1.6
148Justin JacksonNorthwesternRB1997214.613-1.6
149Ray-Ray MccloudClemsonWR1906914.713-1.7
150Andre ChachereSan Jose StateCB2007214.813-1.8
151Justin JonesNorth Carolina StateDT3097425.824-1.8
152Mason ColeMichiganC3077624.923-1.9
153Derrick NnadiFlorida StateDT3177327.025-2.0
154Mike MccrayMichiganOLB2437618.016-2.0
155Mark AndrewsOklahomaTE2567719.117-2.1
156Marcell AtemanOklahoma StateWR2167615.113-2.1
157John KellyTennesseeRB2167017.115-2.1
158Dimitri FlowersOklahomaFB2487419.217-2.2
159Kalen BallageArizona StateRB2287317.415-2.4
160Ryan NallOregon StateRB2327417.515-2.5
161Armani WattsTexas A&MFS2057115.613-2.6
162Akrum WadleyIowaRB1947014.812-2.8
163Dalton SchultzStanfordTE2447717.815-2.8
164Kyle HicksTexas ChristianRB2047015.913-2.9
165Derrius GuiceLouisiana StateRB2247018.015-3.0
166Braxton BerriosMiami (FL)WR1846914.011-3.0
167Donnie ErnsbergerWestern MichiganFB2417518.215-3.2
168Chris WorleyOhio StateILB2387418.215-3.2
169Quadree HendersonPittsburghWR1926815.212-3.2
170Chris LacyOklahoma StateWR2057514.311-3.3
171Deon CainClemsonWR2027414.311-3.3
172Bo ScarbroughAlabamaRB2287317.414-3.4
173Justin CrawfordWest VirginiaRB1997115.011-4.0
174Davin BellamyGeorgiaOLB2557719.015-4.0
175Jordan ThomasMississippi StateTE2657720.116-4.1
176Troy FumagalliWisconsinTE2477718.114-4.1
177James DanielsIowaC3067525.121-4.1
178Rashaad PennySan Diego StateRB2207117.213-4.2
179Geron ChristianLouisvilleOT2987723.619-4.6
180Simmie CobbsIndianaWR2207515.911-4.9
181Michael GallupColorado StateWR2057315.010-5.0
182Will DisslyWashingtonTE2627620.115-5.1
183Kameron KellySan Diego StateFS2007414.19-5.1
184Sean WelshIowaOG3067525.120-5.1
185Zaycoven HendersonTexas A&MDT2987225.320-5.3
186Donte JacksonLouisiana StateCB1757112.47-5.4
187Joshua FrazierAlabamaDT3217626.421-5.4
188Kerryon JohnsonAuburnRB2137116.511-5.5
189Rashaan GauldenTennesseeFS1937313.78-5.7
190Demario RichardArizona StateFB2186917.712-5.7
191Austin CorbettNevadaOG3067624.819-5.8
192Jordan LasleyUCLAWR2037314.78-6.7
193Richie JamesMiddle Tennessee StateWR1837013.66-7.6
194Tyrell CrosbyOregonOT3097724.817-7.8
195Taylor HearnClemsonOG3207626.318-8.3
196Jamil DembyMaineOG3197626.217-9.2
197K.J. MaloneLouisiana StateOG3037624.515-9.5
198Orlando BrownOklahomaOT3458027.714-13.7

What stands out to you? Other than Orlando Brown finishing at the bottom for the second day in a row.

{ 1 comment }

UTSA defensive end Marcus Davenport is a likely first round pick who should be one of the more interesting stories of the draft’s opening night. He is also, pound for pound, the fastest man in the draft.

Last year, I used the following formula to project estimated 40-yard dash times based on weight:

Estimated 40-yard dash time = 3.283 + 0.00606 x weight (lbs)

Davenport weighted 264 pounds in Indianapolis, which would give him a projected time of 4.88 seconds.  But Davenport ran the 40 in a blistering 4.58 seconds, a remarkable 0.30 seconds faster than expected for a man of his size.

Georgia linebacker Lorenzo Carter weighed in at 250 pounds, and he ran the 40 in just 4.50 seconds! That’s also 0.30 seconds faster than the weight-influenced expectation of 4.80 for a man of his size. Davenport and Carter ran the two fastest 40-yard dashes after adjusting for weight at the combine. Coming in third? Perhaps the first non-QB off the board in the 2018 Draft, Penn State RB Saquon Barkley. [continue reading…]

{ 5 comments }

Myles Garrett Is Your 2017 Combine Champion

Myles Garrett is in good shape.

Over the last few days, we have looked at how the top college athletes performed in various drills at the NFL combine, after adjusting for height and weight. Today, we look at the full results and crown a combine champion.

That is a pretty easy thing to do, as it turns out. Texas A&M defensive end Myles Garrett is likely going to be the first overall pick in the draft, and his performance in Indianapolis cemented such a distinction. Garrett had the 2nd best performance in three separate drills: the 40-yard dash, the bench press, and the vertical jump. Then, he produced a 5th-place finish in the broad jump, while sitting out the 3-cone drill. Garrett competed in four of these five events and his averaged finish was 2.8. That’s tremendous.

The table below shows the results in these five drills. I have also included an average rank, excluding all events where a player didn’t participate. That’s not the best way to do this, but I don’t know of a simpler method to rank them. The far right column shows how many of the 5 events each player competed in, so that can be a useful guide. It’s clear to me that the runner up for Combine King is Solomon Thomas rather than Aviante Collins. Thomas had an average rank of 7.6, but he competed in all five events. Collins has a higher rank at 5.0, but the TCU tackle only competed in the 40 and the bench press. To me, a 1-7-8-8-14 is more impressive than a 5-5-dnp-dnp-dnp, but to keep things simple, I just used a simple average. [continue reading…]

{ 1 comment }

Thomas was a combine superstar

As you can imagine, heavier players fare much worse in the 3-cone drill, and taller players have a slight advantage, too. Here was the best-fit formula from the 2017 combine:

7.3397 -0.0317 * Height (Inches) + 0.0091 * Weight (Pounds)

Stanford running back Christian McCaffrey is one of the more interesting prospects from this draft, and he dominated in the 3-cone drill, finishing in 6.57 seconds, just one hundredth of a second behind the leader. Given his dimensions — 71 inches, 202 pounds — he’d be expected to complete the drill in 6.93. McCaffrey therefore finished the drill in 0.36 seconds more than expected, the 7th-best adjusted performance in this drill.

The top performance belonged to a different Stanford player, defensive end Solomon Thomas, who finished a full 0.50 seconds above expectation. The full results, below: [continue reading…]

{ 1 comment }

Hey, look who it is again.

Yesterday, we looked at the vertical jump, which is biased towards lighter players. The star at the combine was Connecticut safety Obi Melifonwu, who had both the top vertical jump and the top weight-adjusted vertical jump. Well, Melifonwu also had the longest broad jump at the combine.

The broad jump is also biased in towards lighter players, but it’s also biased towards taller players. As a result, we need to adjust broad jump results for both weight and height: the best-fit formula from the results of the 2017 combine is:

Broad Jump = 84.14 + 1.0766 * Height (Inches) – 0.1940 * Weight (Pounds)

For Melifonwu, he weighed 224 pounds and was 76 inches tall; that means he’d be projected to jump a solid 122.5 inches. That’s a pretty high projection, showing that Melifonwu’s body is well-tailored for this drill. But even still, he exceeded that jump by 18.5 inches, courtesy of his remarkable 141 inch jump. As a result, he once again had both the top jump and the top adjusted jump: [continue reading…]

{ 0 comments }

Being able to jump high might be useful for a safety

Let’s begin with the most remarkable of today’s feats: Myles Garrett is getting pretty good at this number two thing. After finishing second in the weight-adjusted 40 and second in the height and weight adjusted bench press, Garrett has again finished second in a combine drill, this time the weight-adjusted vertical.

When it comes to the vertical jump, weight is by far the most important thing that matters. For every additional 16.7 pounds a player weights, his expected vertical declines by one inch. That’s because the best-fit formula for projecting the vertical jump at the 2017 combine was 46.38 – 0.0597 * weight (pounds). Connecticut safety Obi Melifonwu weighed 224 pounds in Indianapolis, which would project him to jump an even 33 inches if he was average at this drill.

Well, Melifonwu was anything but average. He jumped an incredible 44 inches: for comparison’s sake, Florida State / Jacksonville safety Jalen Ramsey had a 41.5 inch vertical last year, tied for the most of any player at the 2016 combine. And that was at 209 pounds. Melifonwu was 15 pounds heavier and jumped 2.5 inches higher. That’s a remarkable feat, and brings to mind some of the great verticals from the 2015 combine.

And while Melifonwu was 11 inches better than expected, Garrett was right on his heels at +10.9 inches. Garrett weighed 272 pounds at the combine, but still jumped an insane 41 inches. That’s only three fewer inches than Melifonwu at 48 pounds heavier. Now because the average player lost 16.7 inches for every pound, that makes Melifonwu’s jump just slightly better, but the two of them were far ahead of the rest of the pack. Below are the full results: [continue reading…]

{ 1 comment }

Lawson, when he’s not on the bench press

Yesterday, I looked at the best weight-adjusted 40-yard dash times at the 2017 NFL Combine. The Browns are expected to select Texas A&M defensive end Myles Garrett with the first overall pick, and with good reason: he had the 2nd best weight-adjusted 40-yard dash time, and he comes in 2nd place again today in the height and weight adjusted bench press.

In 2015, Clemson/Atlanta Falcon Vic Beasley was the bench press champion, using a formula involving expected bench press reps based on a player’s height and weight.  That turned out to be pretty predictive of future success; on the other hand, last year’s winner was Nebraska fullback Andy Janovich, who wound up being a 6th round pick and a minor contributor as a rookie with the Broncos.

The best-fit formula to project bench press reps for the 2017 Combine was:

17.401 -0.3354 * Height (Inches) + 0.1075 * Weight (Pounds)

Using that formula, Garrett — at 76 inches and 272 pounds — would be projected to bench press 225 pounds for 21.1 reps. In reality, Garrett produced a whopping 33 reps, or 11.9 more than expected. The only way to top him was Auburn’s Carl Lawson, who measured at 74 inches and only 261 pounds. Being shorter is better, but being lighter is worse, and Lawson would be projected using the regression to have 20.6 reps on the bench press. Instead, he had 35, or 14.4 more than projected, easily the largest margin at the combine.
[continue reading…]

{ 0 comments }

O.J. Howard is fast.

As I have done for the last few years, this week I will be using the raw NFL combine data and adjusting them various metrics.  With respect to the 40-yard dash, the only adjustment I’ve made is for weight, as no other variable (e.g., height) impacts a player’s 40 time quite like weight.  The best-fit formula to predict 40-yard dash time during the 2017 combine was 3.283 + 0.00606 x weight. ((This time around, I excluded punters, kickers, and long snappers when running regressions, as those players aren’t invited to their combine for their raw athleticism (and removing them made the numbers a little tighter). As you can see

Let’s use Alabama tight end O.J. Howard as an example.  He weighed 251 pounds at the combine, which means he would be projected to run the 40-yard dash in 4.81 seconds. Instead, he ran it in just 4.51 seconds, a full 0.30 better than expected.

That was the best performance of any player at the combine. A very close second was produced by the presumptive number one pick in the draft, Myles Garrett. The Texas A&M defensive end weighed 272 pounds, so using the formula above, a player of Garrett’s size should run the 40 in 4.93 seconds.  But Garrett was 0.29 seconds better than expected, completing the drill in 4.64 seconds. Garrett reportedly bested that time by running 40 yards in 4.57 seconds at his Pro Day, too. [continue reading…]

{ 4 comments }

Over the last week or so, I have been analyzing the top performers at the combine in various drills. Today, I want to put it all together. Let’s use Northwestern fullback Dan Vitale as our example.

In the 40-yard dash, Vitale was expected to run it in 4.76 seconds, but instead ran it in 4.6 seconds. That gave him the 28th best score. Put another way, his 40-yard time was 1.18 standard deviations better than the average score, after adjusting for weight.

In the bench press, he was even better. putting up 30 reps, 10.4 more than would be expected given his height and weight. His Z-Score in that event — i.e., how many standard deviations above average he scored — was 2.56.

You might not think of a fullback as dominating in the Vertical Jump, but Vitale excelled here, too. Given his height and weight, he would have been expected to jump 32.6 inches. Instead, he bested that by 5.9 inches, making him the 8th biggest overacheiver in this drill, and 1.97 standard deviations above average.

Vitale was not quite as good in the Broad Jump, but he still ranked 31st by outjumping his projected by 7.8 inches and 1.29 standard deviations.

In the Short Shuttle, Vitale was once again very good, posting the 12th-best adjusted time, which gave him a Z-score of 1.71.

Finally, the 3-Cone drill was his worst, as he finished 62nd and just 0.59 standard deviations above average. Still, add it up, and Vitale was 9.30 standard deviations above average in all of the drills. [continue reading…]

{ 4 comments }

Raiders linebacker Ben Heeney had a nondescript rookie season after being drafted by Oakland in the fifth round of the 2015 Draft. But the Kansas linebacker dominated the 3-cone drill at the 2015 Combine.

As a reminder, here’s a description of the 3-cone drill from NFL.com.

The 3 cone drill tests an athlete’s ability to change directions at a high speed. Three cones in an L-shape. He starts from the starting line, goes 5 yards to the first cone and back. Then, he turns, runs around the second cone, runs a weave around the third cone, which is the high point of the L, changes directions, comes back around that second cone and finishes.

In general, this drill favors taller (i.e., fewer strides) and lighter players. The best-fit formula to project a 3-cone score from the 2016 combine was 7.23 – 0.028 * Height (Inches) + 0.0087 * Weight (Pounds). And Ohio State defensive end Joey Bosa, who some believe is the best player in the draft, absolutely dominated this drill. Despite weighing 269 pounds, Bosa completed the drill in 6.89 seconds, the 26th-fastest time out of 217 participants. He was the only player at even 250+ pounds to finish in under 6.9 seconds.

But Bosa only had the second best rating in this drill. And frankly, it wasn’t even close. Stanford wide receiver Devon Cajuste is 234 pounds — that’s pretty big for a wide receiver — and he ran the single fastest 3-cone drill at the combine. That’s not the fastest among players that weigh 200+ pounds, or even wide receivers. It’s the fastest, period, and by 0.09 seconds. Cajuste may profile as a hybrid wide receiver/tight end, but this sort of shiftiness adds intrigue to his ability to play in the slot. According to Josh Norris, Cajuste — again, ignoring that he weighs 234 pounds! — ran the 5th best 3 cone time by any wide receiver in the last decade. [continue reading…]

{ 1 comment }

The 20-yard shuttle is the Combine’s approach to measure an athlete’s agility, short-range explosiveness, and lateral quickness. Here’s the description from NFL.com:

The athlete starts in the three-point stance, explodes out 5 yards to his right, touches the line, goes back 10 yards to his left, left hand touches the line, pivot, and he turns 5 more yards and finishes.

As you can imagine, heavier players fare much worse in this metric, and shorter players have a slight advantage, too. The best-fit formula from the 2016 Combine using height and weight as inputs is: 4.00 -0.012 * Height (Inches) + 0.005 * Weight (Pounds). In other words, for every 20 pounds a player weighs, he would be expected to take an extra tenth of a second to complete the drill. UCLA center Jake Brendel is 6’4 and weighs 303 pounds; that’s not exactly the formula for dominating this drill. But he wound up completing the workout in just 4.27 seconds, the exact same time it took Notre Dame wideout Will Fuller (6’0, 186 pounds). Based on Brendel’s profile, we would have projected him to take an extra 0.40 seconds to finish, which means he is your 2016 Short Shuttle champion. [continue reading…]

{ 1 comment }

Ohio State outside linebacker Darron Lee had a productive collegiate career, but really raised eyes at the 2016 Combine. Lee had the 6th best weight-adjusted 40-yard time, and then added to that with an incredible performance in the broad jump.

This drill is biased in favor of taller and lighter players; as a result, the best-fit formula to project the Broad jump at the 2016 combine was 119.2 + 0.49 * Height (Inches) – 0.164 * Weight (Pounds). Alabama’s Derrick Henry, who had the 5th best weight-adjusted 40-yard time, had the 2nd-best broad jump. [continue reading…]

{ 0 comments }

Virginia Tech defense end Dadi Nicolas is going to have to switch positions in the pros, but there’s no doubting his athleticism. At just 235 pounds, Nicolas projects as a 3-4 outside linebacker/situational pass rusher in the NFL.

At the NFL Combine, seven players jumped over 40 inches in the vertical jump drill. The first six of those players weighed 188, 194, 194, 202, 209, 209 pounds. The seventh was Nicolas, who weighed 235 pounds: that’s light for a defensive end, but really, really heavy for a guy who has a 41″ vertical.

The best-fit formula to project vertical jumps at the 2016 NFL combine was 46.96 – 0.06 * Weight (Pounds). So Nicolas, at 235, would be projected to jump 32.8 inches. That means the Hokies star, who led the ACC in tackles for loss in 2014, outjumped expectations by 8.2 inches, the most of any player in Indianapolis. [continue reading…]

{ 1 comment }

Last week, I looked at weight-adjusted 40-yard dash times from the NFL Combine. Today, I want to analyze the bench press.  Last year, Clemson/Atlanta Falcon Vic Beasley was your bench press champion, using a formula involving expected bench press reps based on a player’s height and weight.  This year, that honor belongs to Nebraska fullback Andy Janovich.  The fullback position may be of declining importance in the modern NFL, but this can only help Janovich’s stock.

The best-fit formula to project bench press reps for the 2016 Combine was:

37.97  -0.65 * Height (Inches) + 0.119 * Weight (Pounds)

By this formula, the 73-inch, 238-pound Janovich “should” have benched 225 pounds 18.8 times; instead, he put up 30 reps.  Arizona State guard Christian Westerman led the way with 34 reps, but at 6’3, 317, he only produced 9.3 more reps than expected.

Thanks to NFLCombineResults for the raw data. [continue reading…]

{ 2 comments }

As I did the last couple of years, I used the raw NFL combine data and adjusted them various metrics.  With respect to the 40-yard dash, the only adjustment I’ve made is for weight, as no other variable (e.g., height) impacts a player’s 40 time quite like weight. The best-fit formula to predict 40-yard dash time during the 2016 combine was 3.38 + 0.00577 x weight.

Oklahoma defensive end Charles Tapper weighed in at 271 pounds, which would “project” to a 40-yard time of 4.94.  Tapper, though, ran the 40 in a blistering 4.59 seconds.  That’s not quite Jadeveon Clowney (266, 4.53), but it’s comparable to what Bud Dupree (269, 4.56) did last year. Tapper ran the top weight-adjusted 40-yard dash time of 2016, with Todd Gurley’s former running back mate, Keith Marshall, the runner up. Thanks to NFLCombineResults for the raw data. [continue reading…]

{ 1 comment }

Here’s how NFL.com’s Lance Zierlein described Kansas inside linebacker Ben Heeney:

Undersized inside linebacker with a big motor and willingness to take chances. Lacks the athleticism to recover from mistakes in the running game and is too tight to cover in space against the pass.

But at the combine, Heeney didn’t appear out of his athletic class. He ranked a respectable 49th in the 40 yard dash and 58th in the broad jump, while performing at perfectly average levesl in the vertical jump and bench press.

But it’s the 3-cone drill where Heeney starred.   Based on my research from last year, the best-fit formula to project a prospect’s performance in the 3-cone drill is:

Expected 3-Cone = 6.98 – 0.023 * Height + 0.0081 * Weight

For every 12.3 pounds of weight, a player’s expected 3-cone time increases by 0.1 seconds.  Height, meanwhile, is positively correlated: taller players tend to perform better in this drill, which is probably due to stride length/having to take fewer steps.   Heeney, as Zierlein noted, is a bit undersized at inside linebacker: he weighed in at 231 pounds and stood at six feet even (though that combination has worked out well for other inside linebackers).

Given that height/weight combination, we would expect Heeney to complete the 3-cone drill in 7.20 seconds. But Heeney finished it just 6.68 seconds, 0.52 seconds better than expected. According to NFLSavant.com, Heeney is just the 9th inside linebacker in combine history to break 7 seconds in the 3-cone drill; Prior to Heeney, the top two times came in 2012, when undrafted Chris Galippo ran it in 6.90, and Luke Kuechley did it in 6.92.

The table below shows the results of all 207 participants in the 3-cone drill at the combine.  Thanks to NFLSavant.com for the data. [continue reading…]

{ 1 comment }

Connecticut cornerback Byron Jones made history at the 2015 combine, with an unbelievable broad jump of 147 inches. And the video was every bit as impressive as it sounds. Keep in mind that no other player in combine history has ever even hit the 140 inch mark, giving Jones a full 8″ lead on every other broad jump ever recorded in Indianapolis.

On the other hand, Alvin “Bud” Dupree did something special, too. Remember, the Kentucky outside linebacker weighed in at 269 pounds, and he managed to jump 138 inches. In combine history, no other player over 260 pounds has jumped more than 129 inches; lower the weight to over 250 pounds, and the best mark after Dupree is 131 inches. So the Wildcats edge rusher was really in a class of his own, too.

There were 249 prospects in Indianapolis who performed in the broad jump. I performed a regression analysis using weight and height as my inputs, since both variables were highly significant in predicting the broad jump. Here is the best-fit formula: [continue reading…]

{ 7 comments }

As a general rule, shorter and heavier guys tend to dominate the bench press. When I looked at this last year, the best-fit formula to predict the number of reps of 225 a prospect could achieve was:

Expected BP = 30.0 – 0.560 * Height + .1275 * Weight

What does that mean? All else being equal, if Prospect A is 7 inches shorter than Prospect B, we would expect Prospect B to produce about 4 more reps than Prospect A. And for every eight pounds of body weight a player has, we would expect one additional rep out of that prospect.

Which brings us to Clemson outside linebacker Vic Beasley. Standing 6’3 and “only” 246 pounds, Beasley doesn’t exactly fit the profile of a bench pressing machine. But in Indianapolis, he pumped out an incredible 35 reps, tied for the third most at the combine (no other player under 300 pounds had even 33 reps). Given his height and weight, the formula above would project Beasley for 19.4 reps, which means he exceeded expectations by a whopping 15.6 reps. No other player came close to exceeding expectations to such a significant degree.

The table below shows the results of all players who participated in the bench press at the combine.  All data comes courtesy of NFLSavant.com.

[continue reading…]

{ 2 comments }

One of the biggest headlines from the combine were the jumps from Byron Jones, a cornerback from Connecticut. Most impressive was his broad jump, which was not only 8 inches better than everyone else in Indianapolis, but also 8 inches better than anyone else in combine history. More on his broad jump in a future post, but Jones’ 44.5″ vertical too shabby, either: it was the best since 2009, when Ohio State and eventual Chiefs safety Donald Washington jumped 45 inches (a feat later matched by one other player at this year’s combine).

But Jones didn’t have the most impressive vertical at the combine, because at 199 pounds, there’s an expectation that he would do fairly well in that drill.  Given his weight, we would expect Jones to jump about 35.5 inches, based on the best-fit formula derived here, and defined below:

Expected VJ = 48.34 – 0.0646 * Weight

One way to think of that formula is that for every 15.5 pounds of player weight, the expectation on the vertical is one fewer inch.  So at 230 pounds, the expectation would be 33.5 inches.  Which brings us to Alvin “Bud” Dupree, whom we lauded yesterday for the top performance in the 40-yard dash.  At 269 pounds, he would be expected to jump roughly 31.0 inches.  Instead, the Kentucky edge rusher jumped a whopping 42.0 inches — or 11.0 inches over expectation — making it the best weight-adjusted performance of any player in Indianapolis.

Below are the results of the Vertical Jump for every player at the combine. All data comes courtesy of NFLSavant.com. [continue reading…]

{ 5 comments }
Previous Posts