≡ Menu

You probably have heard the stat: Matt Ryan just set an NFL record by throwing touchdowns to 13 different receivers. Here’s the final tally:

Games Receiving
No. Player Age Pos G GS Rec Yds Y/R TD
18 Taylor Gabriel 25 wr 13 3 35 579 16.5 6
11 Julio Jones 27 WR 13 13 76 1313 17.3 5
12 Mohamed Sanu 27 WR 14 14 55 621 11.3 3
83 Jacob Tamme 31 te 8 5 22 210 9.5 3
81 Austin Hooper 22 te 14 3 19 271 14.3 3
16 Justin Hardy 25 wr 15 2 17 160 9.4 3
24 Devonta Freeman 24 RB 15 15 49 381 7.8 2
26 Tevin Coleman 23 12 0 28 406 14.5 2
19 Aldrick Robinson 28 wr 15 1 18 287 15.9 2
80 Levine Toilolo 25 TE 15 10 12 246 20.5 2
42 Patrick DiMarco 27 fb 15 8 7 52 7.4 1
82 Joshua Perkins 23 te 7 1 3 42 14.0 1
86 D.J. Tialavea 25 1 0 1 1 1.0 1

[continue reading…]

{ 7 comments }

There were 15 quarterbacks selected in the 2016 NFL Draft. Two notable ones were Big 10 stars Christian Hackenberg and Connor Cook.

Hackenberg had an impressive freshman year at PSU, then regressed significantly. He had the tools but not the resume, making him one of the more polarizing prospects out there. The Jets drafted him 51st overall. Last year, Penn State went 7-6; this year, without Hackenberg, the team went 11-2. That represents an increase in winning percentage of 0.308.

Meanwhile, Cook led the Spartans to a 12-2 record last year. This year, without Cook and a number of other veterans, Michigan State collapsed, going 3-9. That’s a decline in winning percentage of 0.607. That’s the second largest decline, behind Mississippi State post-Dak Prescott.

Here were the 15 quarterbacks drafted:

And here is the record of their college teams last year and this year, through Dec. 15:

RdPkTeamQuarterbackSchool2015 Win%2015 Rec2016 Win%2016 RecDiff
251NYJChristian HackenbergPenn State0.5387-60.84611-20.308
393CLECody KesslerSouthern California0.5718-60.759-30.179
6191DETJake RudockMichigan0.76910-30.83310-20.064
6187WASNate SudfeldIndiana0.4626-70.56-60.038
4139BUFCardale JonesOhio State0.92312-10.91711-1-0.006
126DENPaxton LynchMemphis0.6929-40.6678-4-0.025
6201JAXBrandon AllenArkansas0.6158-50.5837-5-0.032
391NWEJacoby BrissettNorth Carolina State0.5387-60.56-6-0.038
12PHICarson WentzNorth Dakota St.0.92912-10.86713-2-0.062
6207SFOJeff DriskelLouisiana Tech0.6929-40.6158-5-0.077
7223MIABrandon DoughtyWestern Kentucky0.85712-20.76910-3-0.088
5162KANKevin HoganStanford0.85712-20.759-3-0.107
11LARJared GoffCalifornia0.6158-50.4175-7-0.198
4135DALDak PrescottMississippi State0.6929-40.4175-7-0.275
4100OAKConnor CookMichigan State0.85712-20.253-9-0.607

Let’s be clear: wins and losses aren’t a great way to measure a quarterback, and there’s a ton of noise in the data before you start comparing teams across seasons. Connor Cook on the 2016 Spartans wouldn’t have made Michigan State 12-2. That said, I find this stuff interesting in at least a trivia perspective. But maybe there’s a bit more to it, too. What do you think?

{ 3 comments }

538: Le’Veon Bell’s Historic Performance

Breaking news: Le’Veon Bell is really, really good.  In terms of yards from scrimmage, he had a top-10 performance on Sunday, which has catapulted him to a top-2 season, and into a top-1 career. Today at 538:

Bell’s average of 161.6 yards from scrimmage isn’t remarkable for 2016 alone. If it were to stand through the end of the regular season, Bell’s 2016 performance would rank as the second-highest single-season average since 1932.

This may be Bell’s best season, but he has been a yards from scrimmage monster for much of his career. In 45 career games, Bell has 3,830 rushing yards (85.1 per game) and 1,952 receiving yards (43.4 per game). That translates to 128.5 yards from scrimmage per game for his career, which would be the highest career average since 1932.

You can read the full article here.

{ 1 comment }

Week 14, 2016: Gameday Thread

What’s on your mind today? What do you see happening in today’s games? Post your comments below.

{ 9 comments }

Week 12 Game Scripts Data

I’m short on time today, so here are the Game Scripts from week 12. I’ll leave the commentary to you.

TeamH/ROppBoxscorePFPAMarginGame ScriptPassRunP/R RatioOp_POp_ROpp_P/R Ratio
PIT@INDBoxscore2872111.9212942%392362.9%
TAMSEABoxscore14599.7283544.4%392263.9%
NORRAMBoxscore4921289.2393254.9%351767.3%
BALCINBoxscore191458.3382956.7%512071.8%
TEN@CHIBoxscore272168.2232944.2%542271.1%
DALWASBoxscore312657.6253045.5%531973.6%
GNB@PHIBoxscore2713146.2392858.2%401869%
NYG@CLEBoxscore2713145.6282750.9%512170.8%
ATLARIBoxscore3819194.1373055.2%471477%
SDG@HOUBoxscore211383.8311863.3%382758.5%
OAKCARBoxscore353233.8413057.7%312555.4%
MIASFOBoxscore312473.2322655.2%482565.8%
KAN@DENBoxscore302731.3502665.8%393850.6%
DETMINBoxscore161330.9421968.9%371669.8%
BUFJAXBoxscore28217-1232944.2%283743.1%
NWE@NYJBoxscore22175-1.4502269.4%332358.9%

Also, as always, the season page is now updated.

{ 9 comments }

From Matt To Dak: The Difference A Year Makes

Do you remember the 2010 Panthers? That was the last pre-Cam team in Carolina. That team wast not very good at passing, but got significantly better once Newton arrived. In 2010, Carolina averaged just 2.85 ANY/A, but that jumped to 6.29 the following year, for an increase of 3.43 ANY/A. Here’s the breakdown:

Games Passing
Rk Player Year
Age Draft Tm Lg G GS Cmp Att Cmp% Yds TD Int TD% Int% Rate Sk Yds Y/A AY/A ANY/A Y/G W L T
1 Cam Newton 2011 22 1-1 CAR NFL 16 16 310 517 59.96 4051 21 17 4.10 3.29 84.5 35 260 7.84 7.17 6.24 253.2 6 10 0
2 Armanti Edwards 2011 23 3-89 CAR NFL 16 0 1 1 100.00 11 0 0 0.00 0.00 112.5 0 0 11.00 11.00 11.00 0.7
3 Legedu Naanee 2011 28 5-172 CAR NFL 15 10 1 1 100.00 27 0 0 0.00 0.00 118.7 0 0 27.00 27.00 27.00 1.8
4 Jimmy Clausen 2010 23 2-48 CAR NFL 13 10 157 299 52.51 1558 3 9 1.00 3.01 58.4 33 223 5.21 4.06 2.98 119.8 1 9 0
5 Matt Moore 2010 26 CAR NFL 6 5 79 143 55.24 857 5 10 3.50 6.99 55.6 13 90 5.99 3.55 2.67 142.8 1 4 0
6 Brian St. Pierre 2010 31 5-163 CAR NFL 1 1 13 28 46.43 173 1 2 3.60 7.14 48.7 3 23 6.18 3.68 2.58 173.0 0 1 0
7 Tony Pike 2010 24 6-204 CAR NFL 1 0 6 12 50.00 47 0 0 0.00 0.00 60.1 1 10 3.92 3.92 2.85 47.0 0 0 0
8 Armanti Edwards 2010 22 3-89 CAR NFL 3 0 1 1 100.00 0 0 0 0.00 0.00 79.2 0 0 0.00 0.00 0.00 0.0 0 0 0
9 Brandon LaFell 2010 24 3-78 CAR NFL 14 2 0 1 0.00 0 0 0 0.00 0.00 39.6 0 0 0.00 0.00 0.00 0.0 0 0 0

[continue reading…]

{ 1 comment }

538: Hue Jackson’s Browns Are 0-7

Today at 538: What Does An 0-7 Start Mean For An NFL Coach?

The Browns hired Hue Jackson to lead the team’s latest rebuilding effort in a move that was regarded as one of the best coaching hires of the offseason. In an offseason in which the Browns also brought in Paul DePodesta as chief strategy officer to turn the franchise around, it seemed like Cleveland had its coach of the future. But Jackson is now just the 20th coach since the AFL-NFL merger in 1970 to fail to win a game in his team’s first seven contests.

You can read the full article here.

{ 2 comments }

The 1992 San Diego Chargers are the inspiration for all 0-4 teams.  San Diego, under new head coach Bobby Ross, were 0-4 at the end of September, with three losses of at least 14 points. San Diego then won 11 of their final 12 games. Since 1990, no other team has started 0-4 and won 10 of their final 12 games, and only one other team (the ’04 Bills) went even 9-3.

Similarly, there is one team since 1990 that began 4-0, and then went 1-11. That was the 2012 Cardinals, who unlike the ’92 Chargers, at least showed signs of things to come. At the end of regulation of three of those four games, Arizona outscored is opponents by just six points. The Kevin Kolb/John Skelton/Ryan Lindley Cardinals finished the year 5-11, albeit against the toughest schedule in the NFL.

We know the ’92 Chargers and ’12 Cardinals are outliers, but by how much? The bubble graph below shows every team from 1990 to 2015, how many wins they had in games 1-4 on the X-Axis, and how many wins they had in games 5-16 on the Y-Axis. The red bubble represents the average result, while the size of each bubble shows how many teams met those criteria (i.e., the most common result was 3 wins, 7 wins: [continue reading…]

{ 6 comments }

Footballguys.com – Why Subscribe?

Regular readers know that I’m one of the writers at Footballguys.com. If you are a hardcore fantasy footballer (or daily fantasy sports player), you probably already know that Footballguys.com is the single best source for fantasy football information. If you are a more casual fantasy football player, you’ll find that the tools available at Footballguys will make life much, much easier for you to win your league(s). Either way, I think a Footballguys Insider PRO subscription is a fantastic value for $34.95. Also fantastic values: the Footballguys Draft Dominator for mobile devices, which costs $4.99.

I don’t make extra money if more people sign up for Footballguys or buy an app, but I hope my readers subscribe because I think a subscription is a really good deal. If you play fantasy football and want to win your competitive league or save hours doing research for your local league, a Footballguys subscription is well worth it. For $34.95, you get: [continue reading…]

{ 5 comments }

Jared Goff and Carson Wentz are expected to be the first two picks in the draft tomorrow night. One thing you might not know about the two is that Goff is nearly two years younger than Wentz. Goff, who played three years at California but did not redshirt, was born on October 14, 1994; as a result, he’ll be 21.88 years old on September 1st of this season. Wentz was a fifth year senior for the North Dakota State Bison last year, and was born on December 27th, 1992.

There have been 103 quarterbacks drafted since 1967 in the first round of the NFL draft. Goff will be the 15th youngest as of September 1 of that season, while Wentz will be 15th oldest by that same measure. [continue reading…]

{ 7 comments }

This week at the New York Times, a look at the incredible run the Seahawks are on when it comes to preventing points:

In addition, while Seattle has allowed an average of 15.7 points per game over the last four years, only one other team since 2012 has allowed fewer than 20 points a game on average over that same period. That team, the Cincinnati Bengals, at 19.5, has still allowed nearly 4 more points per game than the Seahawks. In other words, what really distinguishes this Seattle team is how far ahead of the rest of the N.F.L. it has been in this statistic.

One way to measure this is by measuring the number of standard deviations from average. Over the last four years, Seattle has allowed 15.73 points a game, relative to the league average of 22.89. The standard deviation in points allowed by the league’s 32 teams over this period has been 2.62 points per game. This means Seattle, which has been over 7 points a game better than average, has been 2.73 standard deviations better than average, a statistic known as a Z-score.

You can read the full article here.

{ 0 comments }

Post Your 2015 Playoff Predictions here

Post your playoff predictions in the comments. Here are mine:

Wild Card Round

(5) Kansas City over (4) Houston
(3) Cincinnati over (6) Pittsburgh
(5) Green Bay over (4) Washington
(6) Seattle over (3) Minnesota

Divisional Round

(5) Kansas City over (1) Denver  
(2) New England over (3) Cincinnati
(1) Carolina over (6) Seattle
(2) Arizona over (5) Green Bay

Conference Championships

(2) New England over (5) Kansas City
(2) Arizona over (1) Carolina

Super Bowl

(2) Arizona over (2) New England

{ 17 comments }

Merry Christmas (2015)!

Just a quick note from me today.  Hopefully each and every one of you has a chance to sit back, relax, and enjoy a much-needed day off.  I know I have a lot of reasons to be thankful and happy, and that includes the very loyal community here.  From the Football Perspective family to yours, here’s wishing you a Merry Christmas!

Oh, and if you want some Christmas-related football nuggets, there’s always this post!

{ 0 comments }


This week at the Washington Post, a look at how the Chiefs have turned into one of the best teams in the NFL.

Alex Smith has gone nine straight games without throwing an interception, tied for the third longest streak (minimum five pass attempts) since 1960.  He’s thrown 305 consecutive passes since his last interception, also the third longest streak in NFL history.  And while there’s a significant amount of luck involved in maintaining turnover-free play for so long, the Chiefs and Smith operate a conservative offense that is more focused on ball control than explosive plays.  Smith’s average pass this season has been just 6.32 yards downfield, the shortest distance in the NFL, and short passes have a much lower chance of being intercepted.

You can read the full article here.

{ 1 comment }

Some quick data dumps today.

The first graph shows the percentage of 1-yard touchdowns that were rushing touchdowns or passing touchdowns in each year since 1950. As you can see, while the majority of all 1-yard scores are still rushing touchdowns, the ratio has changed considerably over the last 40 years.

1yd pass run [continue reading…]

{ 8 comments }

On Tuesday, I looked at the fantastic rookie class of wide receivers that entered the NFL last year. But in that post, I focused on receiving yards; in fact, the group was even more incredible when it comes to receiving touchdowns.

Rookie wide receivers caught an astounding 92 touchdowns last year, highlighted by Odell Beckham and Mike Evans each snatching a dozen scores. In addition, Kelvin Benjamin (9), Martavis Bryant (8), Jordan Matthews (8), Sammy Watkins (6), Allen Hurns (6), John Brown (5) and Jarvis Landry (5) each caught at least five touchdowns.

Let’s put that number in perspective. Second-year wide receivers caught just 43 touchdowns last year, while third-year and fourth-year wideouts each caught 59 touchdowns. Players from the class of 2010 caught 72, the second highest amount of any class last year. Take a look: [continue reading…]

{ 2 comments }

Call For Guest Posts

There’s no more enjoyable community than the Football Perspective community. Football Perspective has always encouraged guest submissions, but it’s worthwhile reminding folks of that every now and again.

If you ever want to submit a guest post, all you need to do is write it and email it to me at chase[at]footballperspective[dotcom]. I don’t need a bio or an explanation for why you should be considered for a guest post: at Football Perspective, content trumps all.

{ 0 comments }

My from-the-gut thoughts on this weekend’s games, which of course will also flavor my fantasy decisions.

Seattle/Carolina: It’s easy to get burned by being too cute. Sometimes, things are so obvious that we start to look for contrarian takes. To review: Seattle finished with the best record in the NFC, atop the 538 Elo Ratings, and first in Football Outsiders’ DVOA ratings. As the defending champions, the Seahawks obviously pass the eye test. The defense seems to be playing at 2013 levels, while the offense remains quietly effective.

Carolina is one of the worst playoff teams in NFL history. The Panthers won a terrible division with a 7-8-1 record; Carolina went two full months without winning a game. It is hard to come up with a larger mismatch, at least on paper. Seattle is favored by “only” 10.5 points, but that’s a reflection of Seattle not being a high-scoring team, not indecision about the Seahawks ability.

There have been 25 games in NFL playoff history where a team was favored by double digits and the over/under was also less than 45 (the over/under here is actually quite a bit lower, at 40). The favorites have gone 23-2 in those games, with both upsets being memorable: the 2001 Patriots winning in the AFC Championship Game against the Steelers, and the Jaguars shocking the Broncos in the second round of the ’96 playoffs. That is the sort of enormous upset it would be if Carolina could win, and let’s not forget that the Seahawks are also 24-2 at home over the last two years.

These home teams are 17-8 against the spread, too. I’ll be taking Seattle, and frankly, a blowout win is much more likely, in my opinion, than a Panthers win. The only question that remains: do you take Russell Wilson or Marshawn Lynch in your FanDuel lineups? Wilson has more paths to success, of course, and Lynch has struggled against Carolina over the past three years. On the other hand, a dominant home win typically means big numbers for Lynch. In tournaments, you probably don’t want both, but in 50/50s or cash games, I don’t have a huge issue with that strategy. The other must-play in FanDuel this week, due to salary, is the Seattle D. The Seahawks are $5200, and every other defense is at least $4500; given that Seattle is such a strong play this week, it’s hard to imagine it making sense to keep them out of a lineup. [continue reading…]

{ 0 comments }

Post Your 2014 Playoff Predictions here

Post your playoff predictions in the comments. Here are mine:

Wild Card Round

(4) Indianapolis over (5) Cincinnatip
(6) Baltimore over (3) Pittsburgh
(4) Carolina over (5) Arizona
(6) Detroit over (3) Dallas

Divisional Round

(1) New England over (6) Baltimore
(2) Denver over (4) Indianapolis
(1) Seattle over (6) Detroit
(2) Green Bay over (4) Carolina

Conference Championships

(1) New England over (2) Denver
(2) Green Bay over (1) Seattle

Super Bowl

(1) New England over (2) Green Bay

{ 30 comments }

50 Carries/50 Passes in Consecutive Games

In week 10, the Browns blew out the Bengals in the Andy Dalton Thursday Night Implosion game. A less-publicized factoid from that night: Cleveland became the first team in 2014 to record 50 rush attempts in a game. It was a true team effort on the ground, with Terrance West rushing 26 times for 94 yards, Isaiah Crowell going 12 for 41, and even Ben Tate gaining 34 yards on 10 carries. All three players rushed for a touchdown, too, and Brian Hoyer added four carries, bringing the total to 52 runs.

But in week 11, the Browns had 52 pass attempts in a loss to the Texans. As it turns out, calling 50 runs and 50 passes in consecutive weeks is pretty unusual. In fact, it’s only happened eight other times in NFL history.

u mad bro

2012 New England Patriots

Facing Peyton Manning and the Denver Broncos in week 5, New England dominated the game on the ground. The Patriots at one point led 31-7, allowing Stevan Ridley, Brandon Bolden, Danny Woodhead, and Shane Vereen to combine for 50 carries for a whopping 253 yards (Ridley (28/151/1) shouldered the largest load).

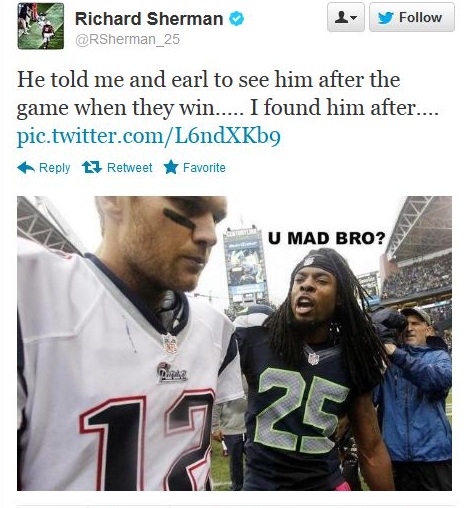
The next week, the Patriots helped bring Richard Sherman into the national spotlight. Tom Brady threw 58 passes as the Patriots lost 24-23 to Seattle.

1994 Pittsburgh Steelers

This was the first great season of the Bill Cowher  era, and you won’t be surprised to learn that Pittsburgh finished 2nd in rush attempts and 1st in rushing yards in 1994.  In the Steelers first playoff game — against Bill Belichick, Nick Saban, and the Cleveland Browns — Pittsburgh rushed 51 times for 238 yards. Barry Foster rushed for 133 yards on 24 carries, Bam Morris produced a very Morris-like stat line of 22/60, and fullback John L. Williams (of Seahawks fame) had two carries for 43 yards and a touchdown. Pittsburgh won comfortably, 29-9, which made what happened next so surprising.

In the AFC Championship Game against the Chargers the following week, Pittsburgh again enjoyed the lead for most of the day (Game Script of +3.9). But there, Foster gained just 47 yards on 20 carries, which led to a very pass-happy offensive approach. Neil O’Donnell finished 32 of 54 for 349 yards and 1 touchdown with no picks and was not sacked. But the Steelers, despite controlling the game and the clock (TOP of 37:13) wound up losing, 17-13.

1987 Cincinnati Bengals

In 1988, the Bengals had rookie Ickey Woods and Pro Bowler James Brooks lead the NFL’s best rushing attack. But in ’87, Woods was dominating at UNLV, while Brooks was still in San Diego. So in week 9 of the ’87 season, when the Bengals rushed 50 times, it was Larry Kinnebrew (27/100/1) and Stanford Jennings (12/91) leading the way, while Boomer Esiason also carried 10 times for 77 yards. The Bengals won in Atlanta that day, 16-10.

The following week against the Steelers, the ground game was not working, and Esiason dropped back an incredible 58 times. Esiason did throw for 409 yards, but took five sacks and was intercepted three times, as the Bengals fell, 30-16.

1986 Detroit Lions

The Lions and Packers were not very good 18 years ago, and staged a forgettable game back in week 6 of the 1986 season. Eric Hipple completed 15 of 19 passes but for only 102 yards. Fortunately for Detroit, the ground game was humming along just fine: Garry James (20/140/1) and James Jones (29/99) carried the day in Green Bay, leading the Lions to a 21-14 victory.

The next week in Anaheim, the Rams jumped out to a 14-0 first quarter lead; Jones and James would finish the day with just 57 yards on 22 carries. As a result, the game was in Hipple’s hands, and he went 31/50 for 316 yards and a touchdown. Those numbers aren’t bad, but Hipple was sacked twice and threw a pair of picks, including a pick six. Los Angeles threw just 12 passes all day, and held on to win, 14-10.

1985 New York Giants

The NFC East was up for grabs when the 9-5 Giants traveled to Dallas to take on the 9-5 Cowboys. Neither team ran the ball that efficiently, but the Giants went unusually pass-happy. Phil Simms had 55 dropbacks, completing 24 passes and taking five sacks, while throwing for 329 yards, 2 touchdowns, and 3 interceptions (including a pick six).

With the division title gone, New York needed to win in week 16 to make the playoffs. Simms threw just 16 passes, as the Giants rode Joe Morris to the tune of 36 carries for 202 yards and 3 touchdowns. As a team, the Giants rushed 51 times for 292 yards (excluding a pair of Simms kneeldowns), and blew out the Steelers, 28-10.

1984 Seahawks

Heading into the final weekend of the season, the Seahawks and Broncos were both 12-3. The teams squared off in Seattle for AFC West supremacy, just four weeks after Seattle won in Denver, 27-24. Things were different in the rematch: Denver won 31-24 despite John Elway going just 9 of 21 for 148 yards with 4 interceptions. The Seattle running game was ineffective, so Dave Krieg wound up dropping back 54 times, going 30 for 50 for 334 yards, with four sacks, two touchdowns, and two interceptions.

The loss put Seattle in the Wild Card round, and that’s when Ground Chuck took over. The Seahawks rushed 51 times for 204 yards … and completed just four passes! Dan Doornick rushed 29 times for 126 yards, while Krieg was limited to just 12 dropbacks. As you can imagine, the Seahawks defense came to play, shutting out Oakland for most of the game in a 13-7 victory.

1975 New Orleans Saints

In week 10 of the ’75 season, Archie Manning went 25 of 52 for 207 yards with no interceptions and two picks in a 16-6 loss to the 49ers. If you think 52 pass attempts (and four sacks) is a pass-heavy game plan for 1975, you are correct: it was the most pass-happy game of the season.

The next week, New Orleans jumped out to a 16-3 lead against the Browns in Cleveland, which seemed to dictate a change in strategy. Manning finished the day 6 of 10 for 92 yards, while Mike Strachan (21/99) and Alvin Maxson (16/45/2) powered the offense. The Saints finished with 177 rushing yards on 51 carries, but a late Cleveland rally turned it into a 17-16 Browns win.

1961 Houston Oilers

The early AFL Oilers teams were one of history’s great aerial attacks. In 1960, Bill Groman produced a 72/1473/12 stat line in 14 games, George Blanda guided the AFL’s top passing offense, and Houston won the AFL title. The following year, Houston averaged a whopping 36.6 points per game, Blanda threw for 3,330 yards and 36 touchdowns, Groman caught 17 touchdowns, and Charley Hennigan caught 82 passes for 1,746 yards and 12 touchdowns. And Houston again finished the season as the AFL champion.

But the 1961 season didn’t start the way you might think. In the opener against a bad Raiders team, Houston jumped out to a 28-0 lead before the half. As a result, Billy Cannon rushed 22 times for 82 yards, Charley Tolar added 101 yards on 18 carries, and the Oilers finished with 203 yards on the ground on 55 carries.

The next week, Houston lost to San Diego, an outcome the Oilers would avenge in the AFL Championship Game. After a 3-3 first quarter, Houston scored four touchdowns in the second quarter, putting the game out of hand. George Blanda finished 15/29 for 131 yards and 4 picks, while Jacky Lee came in and threw 25 times for 190 yards (with 3 touchdowns and 2 picks) in the second half. A week after rushing 55 times, the Oilers dropped back 57 times in the loss to San Diego.

The real question: why didn’t someone start crunching Game Scripts data in 1961?!

{ 2 comments }

The Pro-Rex Ryan Argument

Rex Ryan’s sixth year as head coach of the Jets will almost certainly end the way each of his last three seasons ended: with New York missing the playoffs. While that lack of success often leads to a coach getting fired after just a couple of down seasons, Ryan’s career in New York — in many more ways than what will be described below — has been a unique one. If so inclined, one could argue that no coach has done more with less than Ryan.

To make that statement, one simply needs to define “more” as “win games” and “less” to mean “having an efficient passing offense.” From 2009 to 2013, the Jets averaged just 4.60 Adjusted Net Yards per Attempt, which was 1.21 ANY/A below league average. That was the 2nd worst performance over that period, ahead (just barely) of the Cleveland Browns. [1]And from 2009 through eight weeks of the 2014 season, no team has a worse ANY/A average than New York.

The metric ANY/A correlates very strongly with winning percentage, but here’s the weird part: New York has averaged 8.4 wins per year over those five years, making the Jets a slightly above average team. For reference, the other four teams in the bottom five in ANY/A averaged just 5.6 wins per season. New York has been a crazy outlier: none of the other teams that ranked in the bottom 12 in ANY/A posted a winning record during that time span.

Take a look at the graph below. The Y-Axis shows wins per year, while the X-Axis depicts ANY/A relative to league average from 2009 to 2013. The Jets are the biggest outlier in that group, with only the Ravens coming anywhere near the Jets level of “overachievement.” [continue reading…]

References

References
1 And from 2009 through eight weeks of the 2014 season, no team has a worse ANY/A average than New York.
{ 25 comments }

Temporary Archive Page

As regular readers know, the site is currently in somewhat of a transition period, at least from a tech standpoint. Rest assured, content will continue to flow on a daily basis (at a minimum) while we fix things on the back end.

One of the current casualties is the archive page, which is one of the favorite pages on the site both for me and many readers. The archive page provides a simple listing of every post ever published on the site. Well, I’ve created this temporary archive page, which includes every post (except this one) through September 9, 2014. Hopefully, this helps you folks out in the short-term, and thank you for sticking around during this maintenance period. [continue reading…]

{ 0 comments }

The Coryell Index

Yesterday, we looked at the Billick Index, a measure of coaches who managed teams that were good at preventing offensive touchdowns and bad at creating them. Today, the reverse, which is appropriately named after Don Coryell. Coryell’s teams were slanted towards the offense even when he was in St. Louis, but the situation exploded when he went to San Diego. Here’s a look at Coryell’s year-by-year grades in the Coryell Index: for example, in 1981, his Chargers scored 23.1 more offensive touchdowns than the average team, while opposing offenses against San Diego scored 10.1 more touchdowns than average. Add those two numbers together, and there were 33.3 more offensive touchdowns scored in San Diego games than in the average game in 1981 (this is the same information presented as yesterday, but now the “Grade” column reflects the number above average).

YearRecordOFFDEFGRADE
19734-9-11.8-11.813.5
197410-43.52.51
197511-36.50.55.9
197610-44.8-1.86.6
19777-76.6-6.613.1
19788-46.8-1.68.4
197912-412.46.65.8
198011-51119.9
198110-623.1-10.133.3
19826-314.3-0.314.6
19836-105.1-16.121.1
19847-96.4-13.419.8
19858-819.8-15.835.6
19861-72.4-2.95.3
Total111-83-1124.4-69.6194

[continue reading…]

{ 10 comments }

Previewing the World Cup by NFL Divisions

The Super Bowl is a football competition decided by a series of single-elimination playoff games played after 32 teams attempt to qualify from eight groups of four teams each. That’s the World Cup, too!

And just like the NFL, there are some not-so-good AFC South-ish groups and some very good NFC West-like groups. So let’s assign each World Cup group its doppelganger of an NFL division, and then every team to one of the NFL teams in that division.

That gives us our NFL World Cup Bracket. The AFC South is Group E, which contains no great team and at least one candidate to be the Jacksonville Jaguars of the World Cup. The NFC West is Group B, which has three legitimate contenders to win the whole thing, one of which will not even make it out of the group.

Each team is listed in its predicted order of finish within the group according to my highly scientific NFL-based World Cup prediction machine. Teams with a * are predicted to advance out of the group.

NFL WC Bracket [continue reading…]

{ 19 comments }

Bradford had a lot of surrounding talent in Norman.

Bradford had a lot of surrounding talent in Norman.

Do players get too much credit when teammates make them look good? Take Johnny Manziel. In the last thirty years, no quarterback has had teammates around him drafted so highly. Last year, his left tackle (Luke Joeckel) was the second pick in the draft. This year, his new left tackle (Jake Matthews) was the sixth pick in the draft and his talented wide receiver went immediately after. That’s three top seven picks from his offense in two drafts. Does this means, perhaps, that Manziel was riding those players’ coattails? Or is it Manziel who helped make his teammates look better?

The first round quarterback with the closest comparable surrounding college talent — a left-handed former Florida QB drafted in 2010 — doesn’t appear to be a very promising comparison. Tim Tebow’s top wide receiver was drafted 22nd overall (Percy Harvin) in 2009, and successive linemen Pouncey brothers were drafted in the top 20 the next two years (Maurkice went #18 in 2010 and Mike #15 in 2011). [1]And he had a talented tight end go in the fourth round in 2010, too. Like Tebow, he is also no longer playing football. Let’s move on. Tebow is obviously very different from Manziel, most notably in lacking the important skill for a quarterback of being able to throw a football well. But Tebow may have looked better as a college player in part because of the great talent around him, a situation which may be similar to Manziel.

In general, does having better college teammates cause QBs like Manziel to be overvalued in the draft? Or, do better QBs cause their college teammates to be overdrafted? To check these ideas out, I compared how draft picks performed in their first five years (according to PFR’s Approximate Value) relative to their expected value given their draft position. [2]I did this by running a regression of a player’s value in the first five years on a fifth-order polynomial in draft position. This is pretty much the same thing as looking at the value a player … Continue reading I then compared performance relative to expectation for players who had the benefit of teammates who were drafted in the first round to those who weren’t so lucky. The results are certainly not what I expected: by the end of this post, it might be Bucs fans who worry the most that they overvalued a high pick in the 2014 draft.

Quarterbacks

I first considered the value above expectation (VAE) for quarterbacks drafted in the first three rounds since 1984. It looks like having a lineman drafted in the first round either in the same or subsequent draft has no clear impact on the QB’s VAE. Those QBs who played with first-round linemen do about 1.8 points worse in VAE than QBs (relative to a baseline of 22.2), but this difference isn’t close to being distinguishable from zero. [3]The p-value is 0.70

Here’s the list of QBs from the first three rounds who had at least one lineman drafted in the first round of the same or subsequent draft. [4]All analysis in this post ignores the supplemental draft. The VAE for the last few entries is missing because those players have not finished their first five seasons. Keep in mind that the VAEs cannot be too low for third-round picks like Bobby Hoying, since little was expected of them given their draft position.

QuarterbackYearVAESchoolOL
Boomer Esiason198441.3MarylandRon Solt
Chuck Long1986-18.7IowaMike Haight
Todd Marinovich1991-21.2USCPat Harlow
Matt Blundin1992-19.2VirginiaRay Roberts
Billy Joe Hobert1993-8.4WashingtonLincoln Kennedy
Rick Mirer1993-5.8Notre DameAaron Taylor
Kerry Collins1995-6.8Penn St.Jeff Hartings; Andre Johnson
Todd Collins1995-10MichiganTrezelle Jenkins
Bobby Hoying1996-9.6Ohio St.Orlando Pace
Charlie Batch199814.9East. MichiganL.J. Shelton
Eli Manning20049.5MississippiChris Spencer
Brian Brohm2008-15.7LouisvilleEric Wood
Chad Henne20086.4MichiganJake Long
Matt Ryan200837.9Boston Col.Gosder Cherilus
Sam Bradford20100OklahomaTrent Williams
Tim Tebow20100FloridaMaurkice Pouncey; Mike Pouncey
Andrew Luck20120StanfordDavid DeCastro
Ryan Tannehill20120Texas A&MLuke Joeckel
Russell Wilson20120WisconsinKevin Zeitler; Travis Frederick

There are definitely some classic failures on this list, notably Todd Marinovich, but there are some big successes, too. And, for the more recent QBs, Andrew Luck and Russell Wilson will more than balance out Tebow. Overall, there’s little reason to think getting to play with a first-round lineman causes QBs to be overdrafted in general. As a result, Manziel critics may not have much support if they want to point to Matthews and Joeckel as the reason for Manziel’s college success.

But what about the presence of Mike Evans? Does having an elite wide receiver or tight end mean that a QB might be overvalued in the draft? I ran a separate regression looking at whether having a first-round WR/TE predicts a QB to succeed or flop relative to his expectation. Here, there’s more reason to think there might be something going on, but there is still not clear evidence that teammates make the QB. Part of this is just the relatively small number of QBs with first-round WR/TEs in the sample. On average, QBs with first-round WR/TE teammates in college do 6.5 points worse relative to expectation than other QBs. That gap is still indistinguishable from zero, however. [5]p = .20

Below are the QBs since 1984 who had at least one WR/TE teammate in the same or following year drafted in the first round.

QuarterbackYearVAESchoolWR/TE
Vinny Testaverde1987-4.5Miami (FL)Michael Irvin
Tony Sacca1992-17.7Penn St.O.J. McDuffie
Rick Mirer1993-5.8Notre DameIrv Smith
Kerry Collins1995-6.8Penn St.Kyle Brady
Kordell Stewart199519.9ColoradoMichael Westbrook
Bobby Hoying1996-9.6Ohio St.Terry Glenn; Rickey Dudley
Peyton Manning199840.5TennesseeMarcus Nash
Marques Tuiasosopo2001-14.2WashingtonJerramy Stevens
Chris Simms2003-2.3TexasRoy Williams
Matt Schaub200410.9VirginiaHeath Miller
JaMarcus Russell2007-30.5LSUDwayne Bowe; Craig Davis
Sam Bradford20100OklahomaJermaine Gresham
Brandon Weeden20120Oklahoma St.Justin Blackmon
Robert Griffin20120BaylorKendall Wright
Geno Smith20130West VirginiaTavon Austin

The repeats from the earlier list who were blessed with great help both on the line and at WR/TE were Rick Mirer, Kerry Collins and Sam Bradford. [6]All of those first-rounders were actually TEs (Irv Smith, Kyle Brady and Jermaine Gresham, respectively), although Collins also threw to a second-round WR in Bobby Engram. As you can see, Peyton Manning swings this upwards, but JaMarcus Russell swings it down just as much. Both of those would seem to be anecdotes that fit the story of teammates potentially inflating another player’s perceived value, with the QB inflating the WR (the instantly forgotten Marcus Nash) in Manning’s case and the WR (Dwayne Bowe) perhaps inflating the QB in Russell’s case.

Overall, though, it’s unclear whether WRs in general tend to inflate their QBs, making them overvalued in the draft. The effect size is substantial and just three of the 11 QBs have positive VAE, but it could be driven by random chance given the small sample size. [7]Kordell Stewart is one of those three and he did play a little WR in his first few years, too, but almost all of his value was at QB Given what I find below for predicting WR success, I suspect that the Manning-Nash example may happen more often than the Russell-Bowe situation.

Wide Receivers

Do great college quarterbacks cause NFL talent evaluators to reach for their wide receiver and tight end teammates? It seems like the answer to this question might be yes. Receivers selected in rounds 1-3 who come from schools with first-round QBs drafted the same or following year do 6.4 points worse relative to expectation from their draft position. Here, we have more data and the results are statistically significant that having a first-round college QB has led to their wide receivers being overvalued in the draft. [8]The p-value for this effect is .01 WRs drafted in the first three rounds without a top QB generated an average value in their first five years of 17.6, so the predicted drop in value is down to about 11.2. Having a first round QB thus predicts a WR gets taken a little more than a round too early. [9]For wide receivers, I estimate 17.6 as being the expected value generated by about the 46th pick, with 11.2 the expected value generated by the 89th pick

In fact, from 1984 to 2009, only 20% of the round 1-3 WR/TEs who played with first-round QBs had a positive VAE.

WR/TEYearVAESchoolQB
Jonathan Hayes1985-11.9IowaChuck Long
Flipper Anderson198817.3UCLATroy Aikman
Mike Bellamy1990-16.9IllinoisJeff George
Derek Brown1992-26.7Notre DameRick Mirer
Irv Smith1993-14.9Notre DameRick Mirer
Cory Fleming1994-10.4TennesseeHeath Shuler
Malcolm Floyd1994-7.9Fresno St.Trent Dilfer
Tydus Winans1994-9.8Fresno St.Trent Dilfer
Kyle Brady1995-20.4Penn St.Kerry Collins
Bryan Still1996-10.9Virginia TechJim Druckenmiller
Joey Kent1997-15.7TennesseePeyton Manning
Marcus Nash1998-21.1TennesseePeyton Manning
Patrick Johnson1998-8.7OregonAkili Smith
Kevin Johnson199910.6SyracuseDonovan McNabb
Jabar Gaffney2002-1.1FloridaRex Grossman
Reche Caldwell20022.7FloridaRex Grossman
Taylor Jacobs2003-16.2FloridaRex Grossman
Mike Williams2005-25.8USCMatt Leinart
Anthony Fasano2006-2.3Notre DameBrady Quinn
David Thomas2006-2.5TexasVince Young
Dominique Byrd2006-10.7USCMatt Leinart
Maurice Stovall2006-6.1Notre DameBrady Quinn
Craig Davis2007-15.1LSUJaMarcus Russell
Dwayne Bowe200713.4LSUJaMarcus Russell
Fred Davis2008-2.3USCMark Sanchez
Jordy Nelson200812.8Kansas St.Josh Freeman
Juaquin Iglesias2009-10.1OklahomaSam Bradford
Mohamed Massaquoi2009-2.9GeorgiaMatthew Stafford
Patrick Turner2009-10.4USCMark Sanchez
Percy Harvin200917FloridaTim Tebow
Jermaine Gresham20100OklahomaSam Bradford
Coby Fleener20120StanfordAndrew Luck
Justin Blackmon20120Oklahoma St.Brandon Weeden
Kendall Wright20120BaylorRobert Griffin

And at least one of the successes on this list is an exception that fits the broader idea. Percy Harvin played with a QB who just maybe was a slight reach as a first round pick. It’s hard to think that Tim Tebow made Percy Harvin look good. [10]I’d argue the same for Dwayne Bowe and JaMarcus Russell, but Russell at least was a legitimately excellent passer in 2006 At least based on these results, having a great college QB has caused wide receivers to be drafted much too highly over the last thirty years.

Conclusion

So it seems like Bucs fans might have more to worry about than Browns fans. The evidence is unclear on whether QBs such as Manziel generally become overvalued from playing with first-round receiver talent, although there might be something going on there. But the evidence is much clearer that WRs such as Evans become overvalued from playing with premier college QBs. Perhaps it’s not surprising from what we know about the NFL that there’s a pretty good chance that Manziel’s excellence helped inflate Evans’s value.

Of course, the last example of a 6’5 receiver drafted in the top ten who played with a first-round Heisman-winning QB doesn’t bode well for Evans, either. [11]The similarities don’t stop there. Mike Williams is listed at 229 lbs and ran a 4.56 40 at the combine. Evans is at 231 and ran a 4.53. And they’re both named Mike. And while Evans will likely still be in the NFL after six years unlike Mike Williams, it is likely that he would have gone lower in the draft if he played with a quarterback not quite so good as Johnny Football.

References

References
1 And he had a talented tight end go in the fourth round in 2010, too. Like Tebow, he is also no longer playing football. Let’s move on.
2 I did this by running a regression of a player’s value in the first five years on a fifth-order polynomial in draft position. This is pretty much the same thing as looking at the value a player generates compared to their expected value according to Chase’s chart, except I also control for whether a player went to a major football school.
3 The p-value is 0.70
4 All analysis in this post ignores the supplemental draft.
5 p = .20
6 All of those first-rounders were actually TEs (Irv Smith, Kyle Brady and Jermaine Gresham, respectively), although Collins also threw to a second-round WR in Bobby Engram.
7 Kordell Stewart is one of those three and he did play a little WR in his first few years, too, but almost all of his value was at QB
8 The p-value for this effect is .01
9 For wide receivers, I estimate 17.6 as being the expected value generated by about the 46th pick, with 11.2 the expected value generated by the 89th pick
10 I’d argue the same for Dwayne Bowe and JaMarcus Russell, but Russell at least was a legitimately excellent passer in 2006
11 The similarities don’t stop there. Mike Williams is listed at 229 lbs and ran a 4.56 40 at the combine. Evans is at 231 and ran a 4.53. And they’re both named Mike.
{ 37 comments }

Colleges with the Best Drafts In Each Year

Half of the top four picks in the 2010 draft.

Half of the top four picks in the 2010 draft.

Thanks to the Football Perspective Draft Value Chart, we know the value of each pick in the draft. If we assign the draft value associated with each pick to the college of that player, then we can determine which school produced the most draft value in any given year.  For example, this year, Texas A&M could have three players selected in the top ten: Johnny Manziel, Jake Matthews, and Mike Evans.  In fact, I have the trio all going in the top 8 in my mock draft.

Only three times in the last 25 years has a school had three of its players go in the top ten. Four years ago, Oklahoma had three players go in the top four, with Sam Bradford, Gerald McCoy, and Trent Williams only interrupted by the Lions selection of Ndamukong Suh.  Nine years ago, Auburn running backs Ronnie Brown and Cadillac Williams went in the top five and cornerback Carlos Rogers was selected ninth overall. And in 1995, Penn State sent Ki-Jana Carter, Kerry Collins, and Kyle Brady to the NFL, although the Nittany Lions didn’t even have the best draft of any school that year.

But no school dominated a single draft quite like Notre Dame back in 1946. The Fighting Irish had three of the first five picks (including Jason’s boy, Johnny Lujack and Hall of Famer George Connor), and the 10th and 16th overall selections. And then seven more in the top 135! In more modern times, the Hurricanes’ 2004 class takes the cake.  That year, Miami had six of the top 21 picks (Sean Taylor (5), Kellen Winslow Jr. (6), Jonathan Vilma (12), D.J. Williams (17), Vernon Carey (19) and Vince Wilfork (21))! [continue reading…]

{ 1 comment }

When a general manager trades away a future first round pick, it’s worth wondering if the transaction was the effect of the principal-agent problem. A general manager is supposed to act in the best interest of the franchise, but he may instead choose to act in his own self-interest. If he’s on the hot seat, trading a future first round pick for something right now may be a pretty attractive option, as he may not be around when the bill comes due.

Does that happen in practice? The most obvious example I can think of involved the Raiders in 2011.  On October 8th, Al Davis passed away. Eight days later, starting quarterback Jason Campbell went down for the season with a collarbone injury. With the owner and general manager positions unsettled, head coach Hue Jackson became the de facto head of football operations. And he traded first and second round picks to Cincinnati for Carson Palmer. Had the move worked out and the 4-2 Raiders gone on to make the playoffs, Jackson would have been very happy. When the move failed, the Raiders missed the playoffs and Jackson was fired. As a result, it was Reggie McKenzie sitting at the table when the bill arrived.

[continue reading…]

{ 21 comments }

Don't worry, this will all make sense by the end. I think.

Don't worry, this picture's presence will make sense by the end. I think.

Two years ago, I wrote this post on running back aging curves. One conclusion from my research was that age 26 was the peak age for running backs, which was immediately followed by a steady decline phase until retirement. In that study, I only wanted to look at very good-to-excellent running backs in the modern era; as a result, I was forced to limit myself to just 36 players. I’ve been meaning to update that post, but wasn’t quite sure what methodology to use.

Last year, Neil wrote a very interesting post on quarterback aging curves. In it, Neil computed the year-to-year differences in Relative ANY/A at every age. While reviewing that post, a lightbulb went off. We can greatly increase the sample size if we only look at running backs from year-to-year, and not just the best running backs on the career level.

There are 723 running backs since 1970 who had at least 150 carries in consecutive seasons and who were between 21 and 32 in the first of those two seasons. For each running back pair of seasons, I calculated how many rushing yards the player gained in Year N and many yards he gained in Year N+1. Take a look:

[continue reading…]

{ 28 comments }

2013 NFL Playoffs: Post Your Predictions

Before the playoffs start, I encourage everyone to post their playoff predictions in the comments. Here are mine:

Wild Card Round
Saturday, Jan. 4, 4:35 p.m.: Chiefs at Colts — Chiefs
Saturday, Jan. 4, 8:10 p.m.: Saints at Eagles — Eagles
Sunday, Jan. 5, 1:05 p.m.: Chargers at Bengals — Bengals
Sunday, Jan. 5, 4:40 p.m.: 49ers at Packers– 49ers

Divisional Round
Saturday, Jan. 11, 4:30 p.m.: 49ers/Packers/Saints at Seahawks — 49ers
Saturday, Jan. 11, 8:15 p.m.: Bengals/Colts/Chiefs at Patriots — Bengals
Sunday, Jan. 12, 1:05 p.m.: Eagles/49ers/Packers at Panthers — Panthers
Sunday, Jan. 12, 4:40 p.m.: Colts/Chiefs/Chargers at Broncos— Broncos

Conference Championship Round

Sunday, Jan. 19: 3:00 p.m.: 49ers at Panthers 49ers
Sunday, Jan. 19: 6:30 p.m.: Bengals at Broncos Broncos

Super Bowl
Sunday, Feb. 2, 2013 – 6:20 p.m.: Broncos vs. 49ersBroncos

{ 25 comments }

Eleven Years And Counting

Outstanding. Now the real question? Want to be a Footballguy?

That was the e-mail I received from David Dodds on June 6, 2002. The co-owner of Footballguys.com then and now, Dodds was replying to a freelance article I submitted to his site. Two days later, my article was posted, and I had become a paid writer.

Eleven years ago, there was no twitter, blogging wasn’t mainstream, and fantasy football was probably less cool and definitely less popular than Dungeons and Dragons. I hated writing: growing up, I was always a “math person.” I thought of writing proficiency as a soft skill, itself a euphemism for a useless skill, and had no desire to spend a moment of my time writing. My brother was and is a sports anchor/reporter, and he was the writer in the family.

I began playing fantasy sports in the late ’90s, which was a year-round hobby as fantasy basketball and fantasy football rose in popularity (I started off with fantasy baseball). I was quickly hooked on fantasy football, but it took a couple of years before Footballguys came across my radar. The articles were terrific and opened my eyes to the intricacies and strategies of the game. But the real treasure was the site’s message board. I could post on the board and minutes later someone would reply. That was my first introduction to the value of reader feedback. I didn’t think of “posting” on the message board as writing, but it was there that I learned the appropriate ways to craft an argument. The board also helped me develop a pretty thick skin for internet criticism, the sort of armor every blogger needs.
[continue reading…]

{ 37 comments }
Next Posts Previous Posts