
From 2005 to 2010, 42% of all players (minimum one game) in the NFL were in their 5th year or later. Meanwhile, playing in their first three years made up just 47% of all players in the NFL during that time. In other words, there were only a few more of the youngest players than the oldest players (5th plus years) in the NFL.
In 2011, there was a lockout and then the new CBA was instituted. The collective bargaining agreement instituted a very low wage scale for rookies and a higher floor for veterans; as a result, all other things equal, players on rookie contract were much more valuable than veterans due to significantly lower salaries. The 2011 year is a complicated year to analyze because teams scrambled to put together rosters and they didn’t have a chance to fully comprehend the new CBA. But let’s look at 2012 to 2017: during the last six years, less than 36% of all players to play one game in a season was in their 5th year or later, and over 53% of all players were in their first three years.
The graph below shows what percentage of players were in their 1st, 2nd, 3rd, 4th, etc., years of playing status over two sets of eras: 2005 to 2010, and 2012 to 2017.
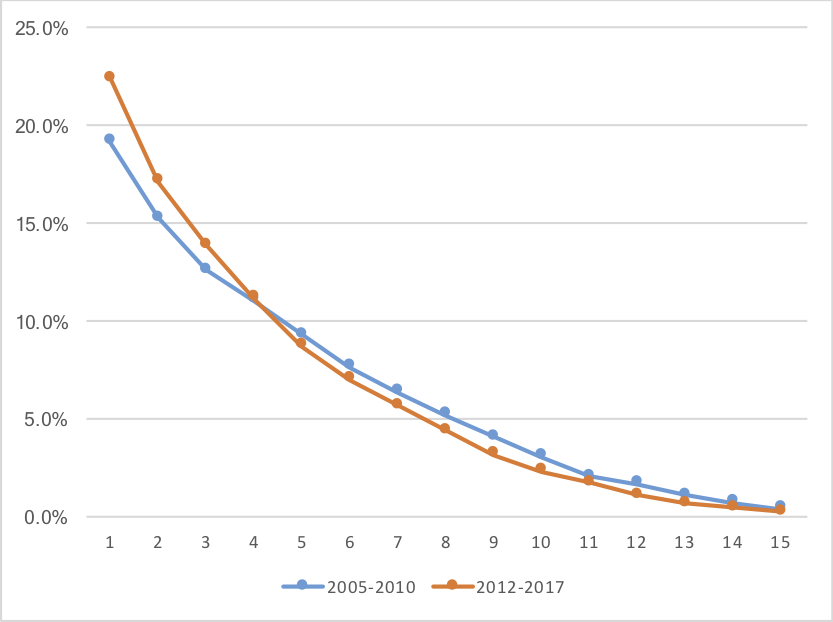
As you can see, there has been a small but clear shift in number of roster spots from older players to younger players. The table below is color-coded to show the percentage of players to play at least one game from each class year. So last year, 12.1% of all players to play at least one game were 4th-year players. In 2016, 15.4% of all players to play at least one game were 3rd-year players. Darker blue means more players; darker red means fewer players. The 7th-through-10th year players are the ones who seem most harmed by the current CBA:

This is just one way to look at the data. What other ways would you suggest analyzing and parsing the data to better understand the current CBA?