
Last week, I looked at the Green Bay Packers passing offense since 2008 in trailing 16 game increments. I thought it would be fun to do the same thing today for Tom Brady.
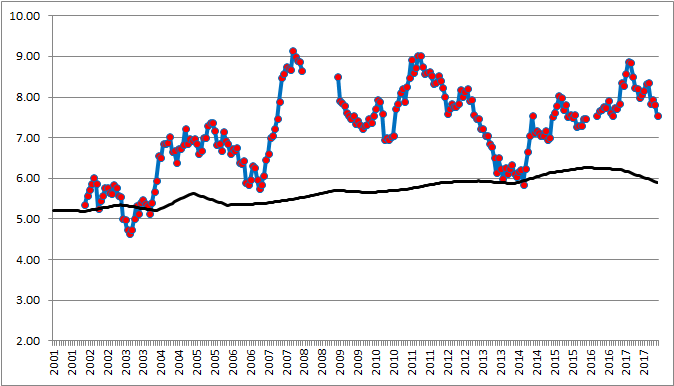
The blue and red line shows Brady’s trailing 16 game Adjusted Net Yards per Attempt. The black line shows the trailing 16 game league average. As you can see, Brady was around league average for awhile, jumped way up prior to 2007, when he jumped way, way up.
The gaps in the line show his injury in 2008 and suspension in 2016. One interesting note is how Brady dipped just below average on his trailing 16 game average after the MNF game against the Chiefs in 2014.
What stands out to you?