
How consistent are passing offenses from year to year? What about passing defenses?
To measure this, I looked at all teams from 2002 to 2017 and measured how effective their passing attacks were by Adjusted Net Yards per Attempt relative to league average. So the best passing offense by this measure was the 2004 Colts, who were +3.97 ANY/A better than average. The next year, Indianapolis was 2.55 ANY/A better than average. In the graph below, I have shown every team during this era, with their Relative ANY/A on the X-Axis and their Relative ANY/A the next season on the Y-Axis.
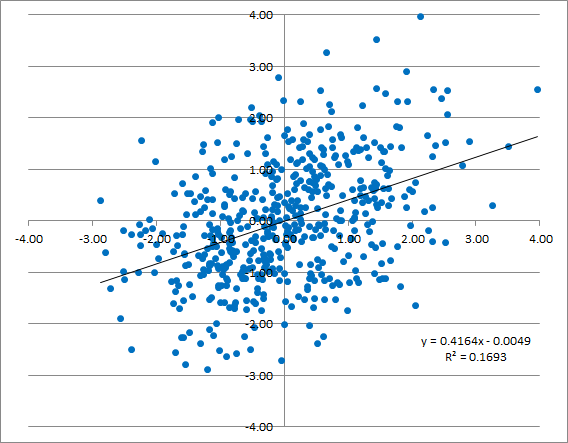
The 2003 Colts would be the dot that is at the top of the graph, with 2.13 RANY/A on the X-AXis and 3.97 RANY/A on the Y-Axis. The 2004 Colts are the dot at the far right (3.97, 2.55). Given that this graph is broken into four quadrants, here is how I would think about it:
Top Right: Passing offenses that were ABOVE average in Year N and in Year N+1
Bottom Right: Passing offenses that were ABOVE average in Year N and then BELOW average in Year N+1
There are, it should be clear, many more dots in the top right quadrant than the bottom right quadrant. This is a sign that passing efficiency is at least somewhat sticky from year to year.
Top Left: Passing offenses that were BELOW average in Year N and ABOVE average in Year N+1. The 2015 Cowboys fit in here, as Dallas had a RANY/A of -1.27 that season but it jumped to +1.34 in 2016.
Bottom Left: Passing offenses that were BELOW average both years.
Again, there are more dots in the bottom left quadrant than the top left quadrant, showing that there is some year-over-year consistency. You can also see the best-fit line and the R^2 on that graph of 0.17. This means that yes, there is definitely a positive relationship, but the effect is not super strong. Quite literally, it means that roughly 17% of the variability of a team’s RANY/A in Year N+1 can be explained by its Year N RANY/A. In addition, if you were to project an offense’s RANY/A for next season, you would simply take 42% of the team’s RANY/A from the prior year (remember, an average RANY/A is 0.00).
This is all pretty abstract, but that’s only until we compare it to another element. In this case, let’s use pass defense. The best pass defense by this measure was from the 2002 Bucs, who had a RANY/A of +3.01. The 2013 Seahawks (+2.68) were second, and the 2008 Steelers (+2.53) were third. Here’s the same graph as before, but for pass defense, with Year N RANY/A Allowed on the X-Axis and Year N+1 RANY/A Allowed on the Y-Axis.

There are a couple of clear takeaways from this graph. One is that all of the data is condensed: the axes are the same in both graphs, but pass defense is more concentrated closer to zero. Another takeaway is that Year N+1 looks less correlated to Year N efficiency. Yes, there are more dots in the upper right quadrant than the lower right quadrant, but it’s not quite as clear. The same goes for the lower left quadrant compared to the upper left. And here, just 8% of the variation in Year N+1 pass defense can be explained by Year N pass defense efficiency. On the other hand, if you were to project how good a pass defense will be in 2019, this suggests we would take 27% of a team’s RANY/A last year.
Let’s drive the home a bit more clearly by putting all the data in one graph:

Please leave your thoughts in the comments.