
Typically, there is a very strong relationship between passing offense and team winning percentage. But over shorter samples, that doesn’t always hold up, and that’s been a noticeable trend so far this season.
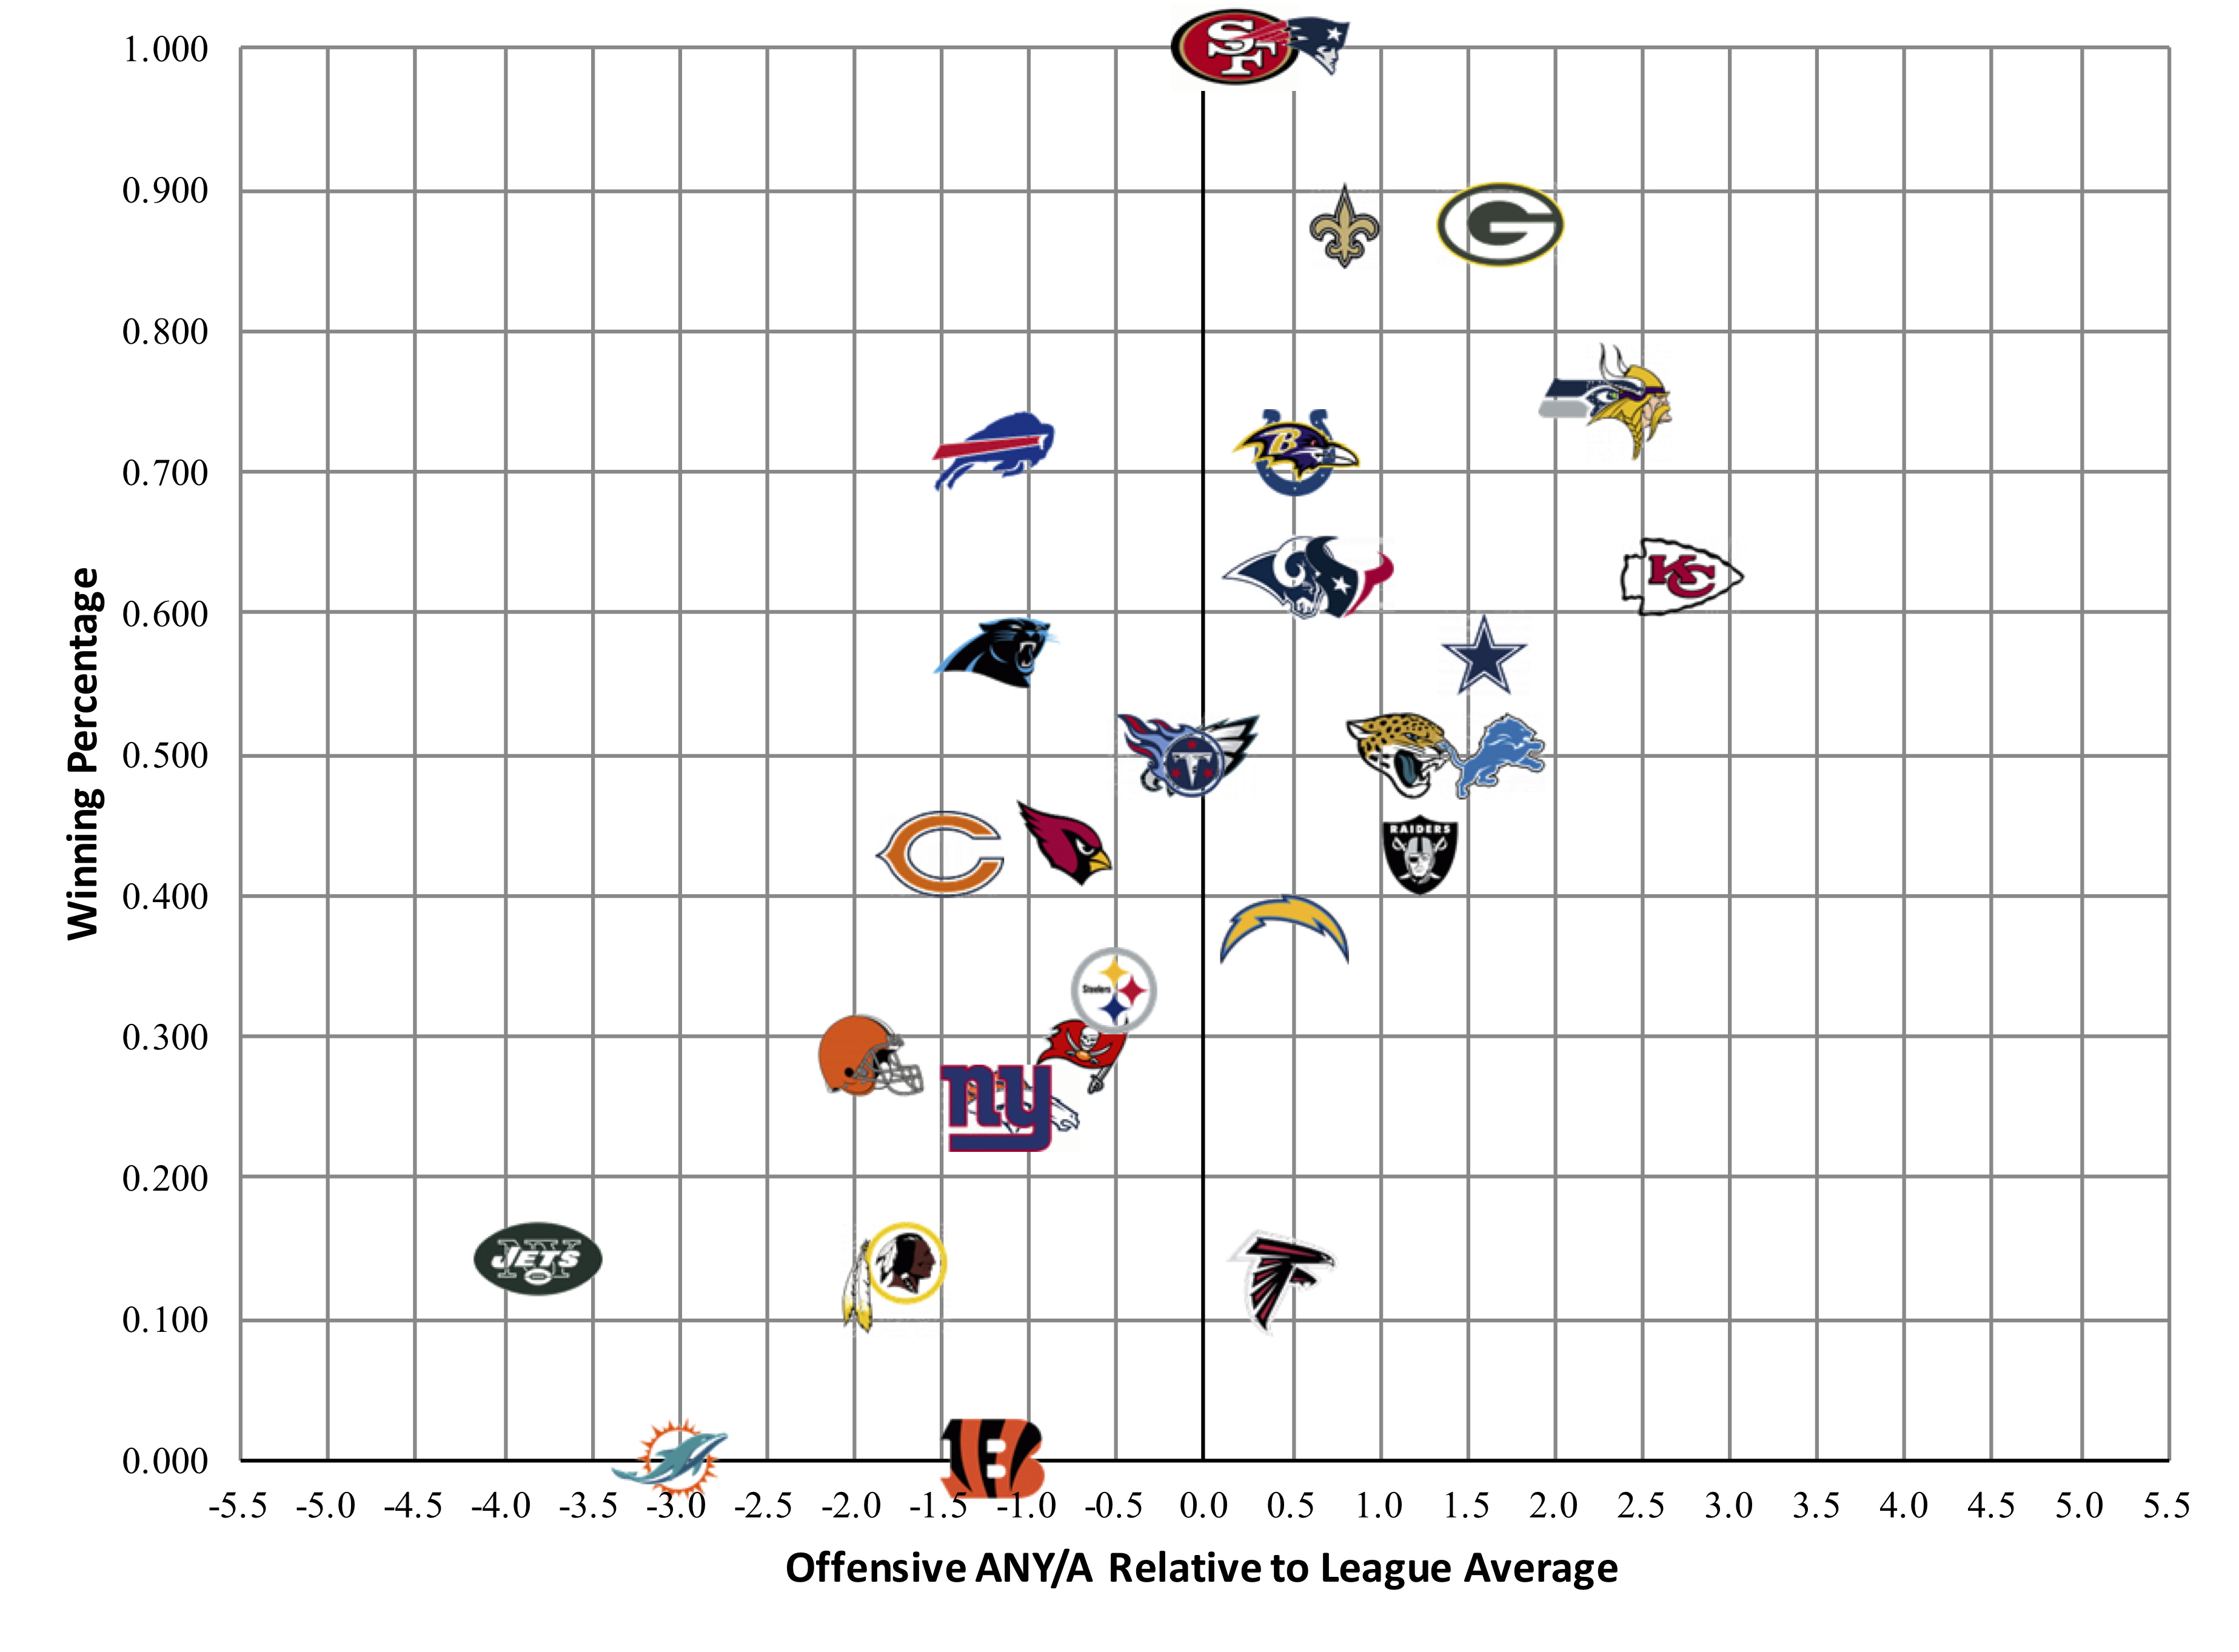
The Patriots, 49ers, Falcons, and Chargers are all in the same tier of passing efficiency: not in the top ten, but slightly above league average. And yet New England and San Francisco are undefeated, while Atlanta and Los Angeles are 4-12. The graph below shows all 32 teams in the NFL and their statistics through 8 weeks (of course, this is prior to the Steelers/Dolphins MNF game tonight). The X-Axis shows each team’s offensive Adjusted Net Yards per Attempt average relative to league average. The Chiefs, Vikings, and Seahawks are the top three teams in this metric so far this season. The Y-Axis shows winning percentage.
One thing you’ll notice is that the teams looked bunched together. The X-Axis runs from -5.5 to 5.5, and you’ll see why in a moment.
So how are the 49ers and Patriots undefeated? Well let’s run the same numbers but use defensive ANY/A. The X-Axis in this graph shows how much better (positive number = better) than league average each defense has been so far this season against the pass. The Patriots defensive Relative ANY/A is at a whopping 5.1, and that’s why the X-Axis goes from -5.5 to 5.5. It helps to use the same scale for both charts to see just how dominant the pass defenses have been for New England and San Francisco. You’ll also notice, contrary to most years, that the spread here is wider, too. The standard deviation in pass defense is 1.75 ANY/A, while the standard deviation on offense is 1.49 ANY/A.
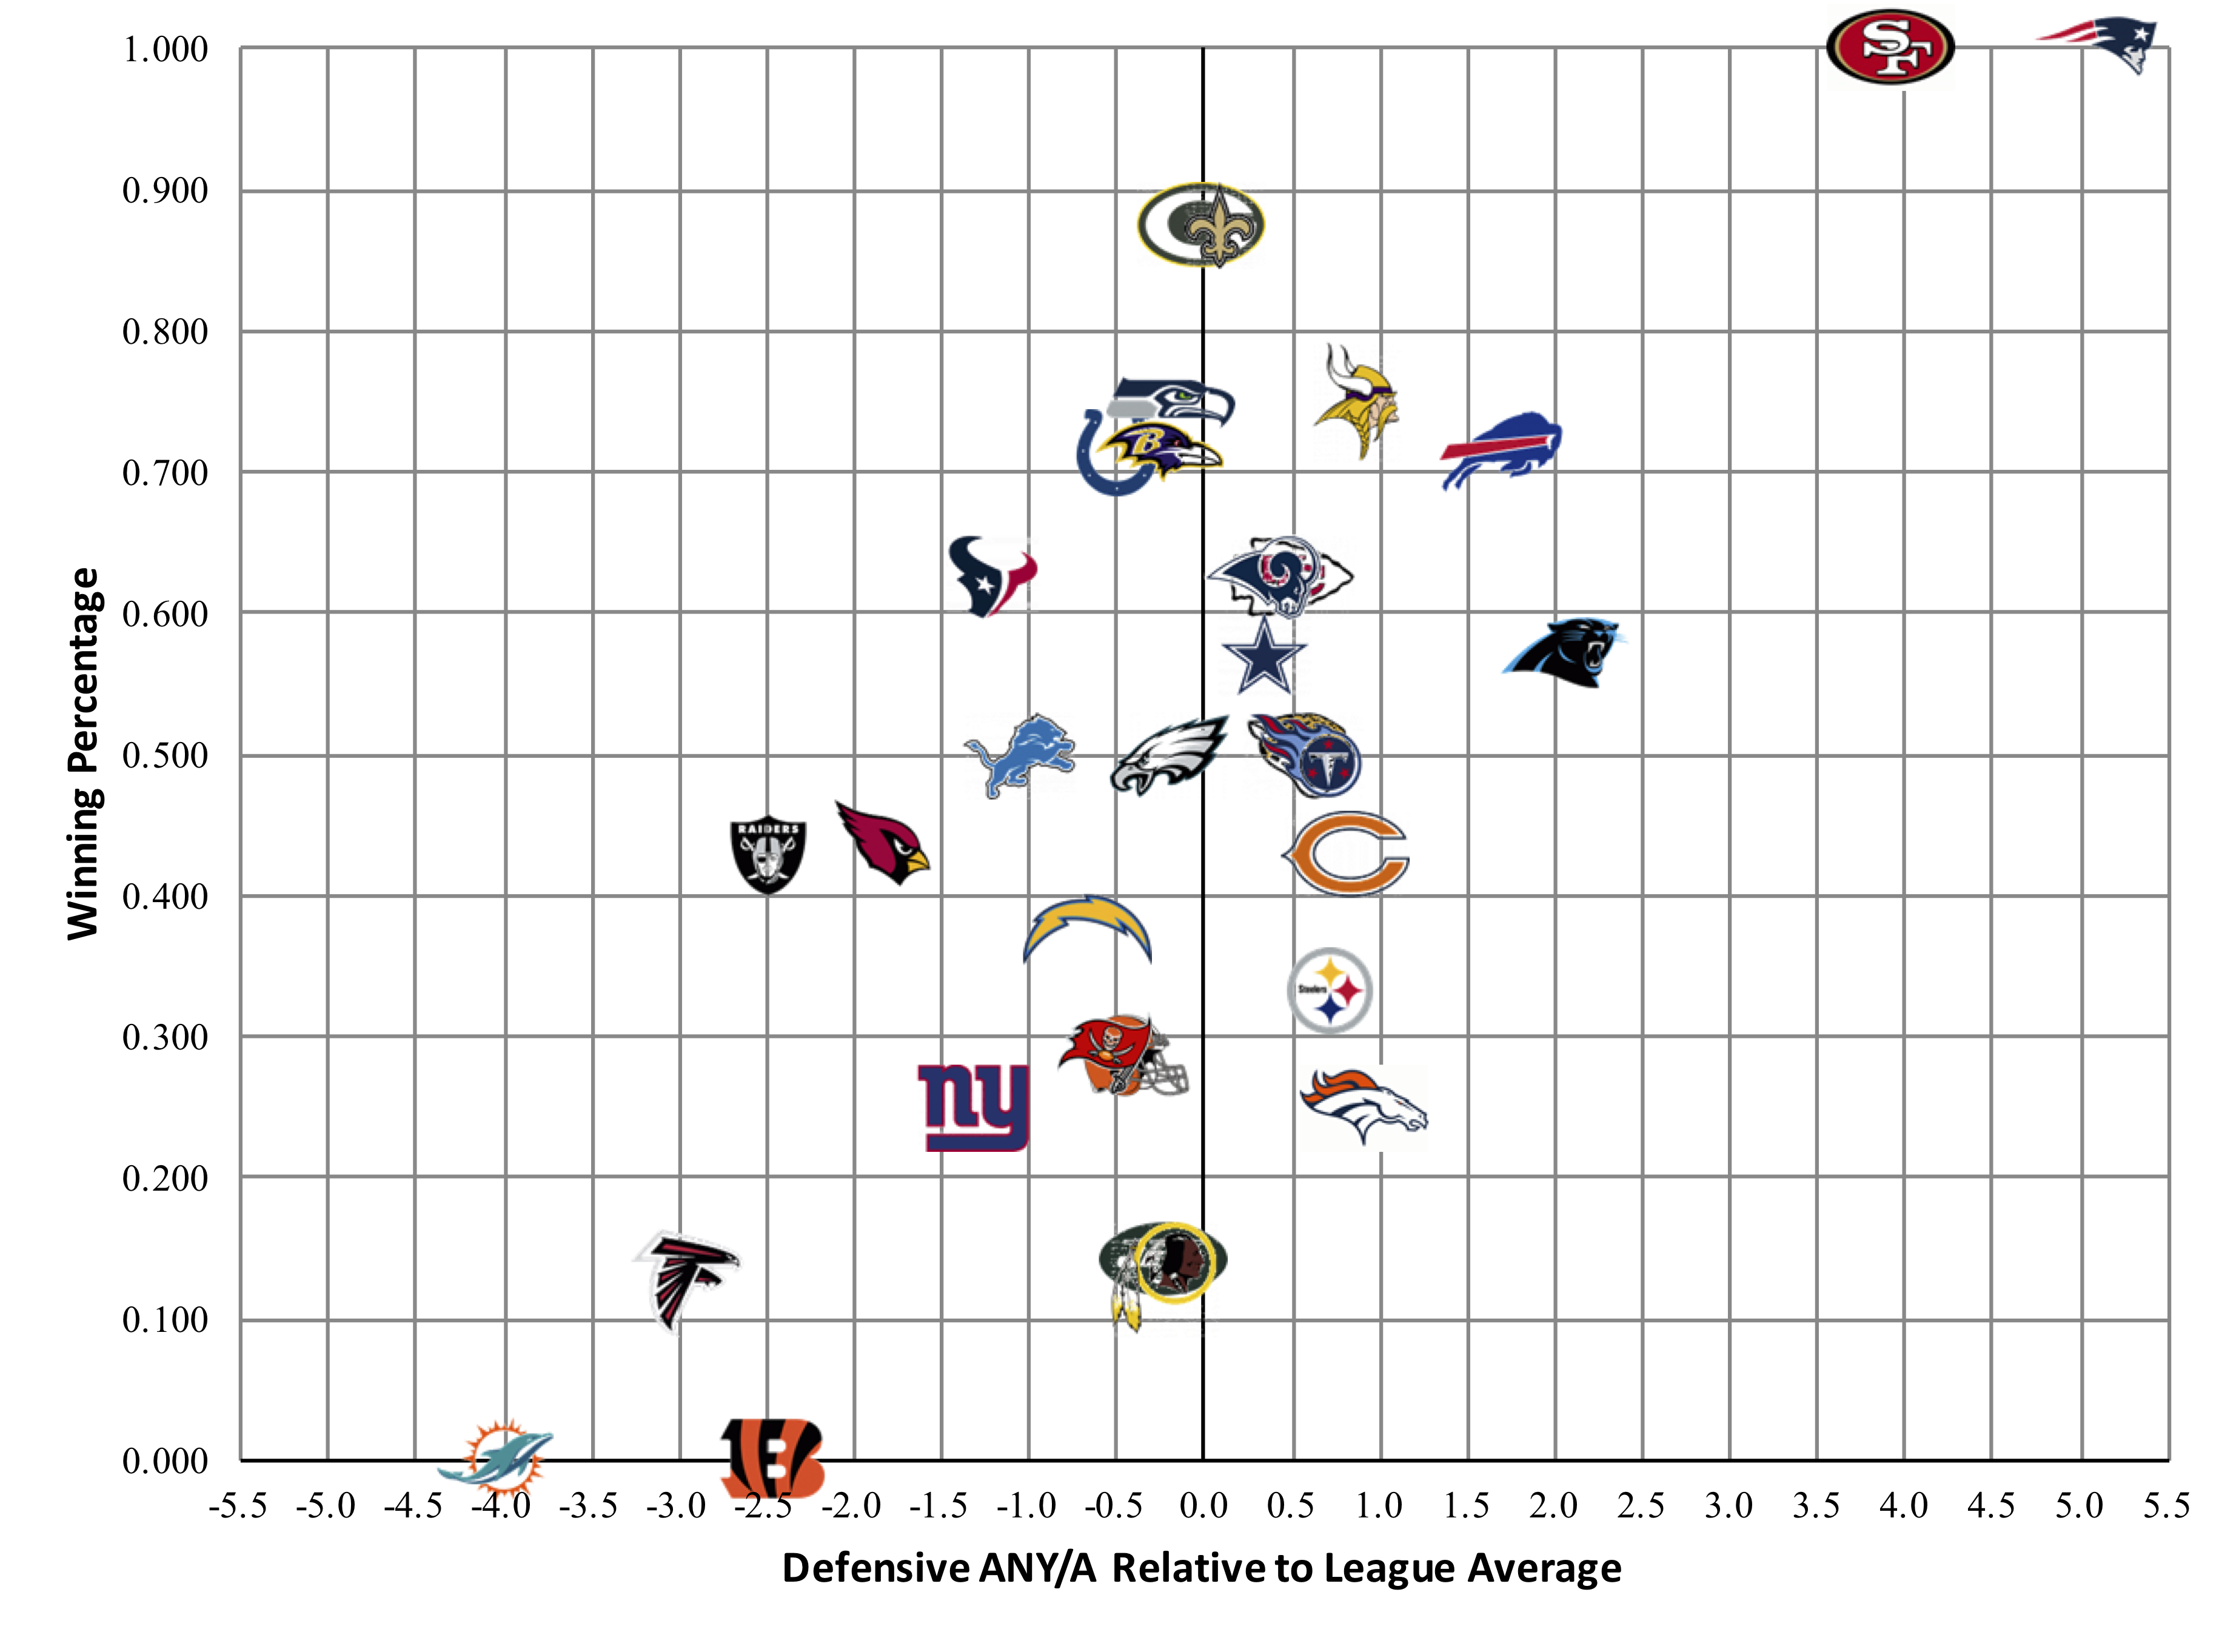
The 49ers and Patriots are riding undefeated seasons right now because of dominant pass defenses. That is probably less sustainable than a dominant pass offense, and it’s also less sexy, which is probably why these teams don’t “feel” as dominant as other teams to open up undefeated.
The best way to understand a team’s record is by using ANY/A differential. That’s shown in the graph below, with Offensive ANY/A minus Defensive ANY/A on the X-Axis. And the Patriots and Dolphins are at the extremes.
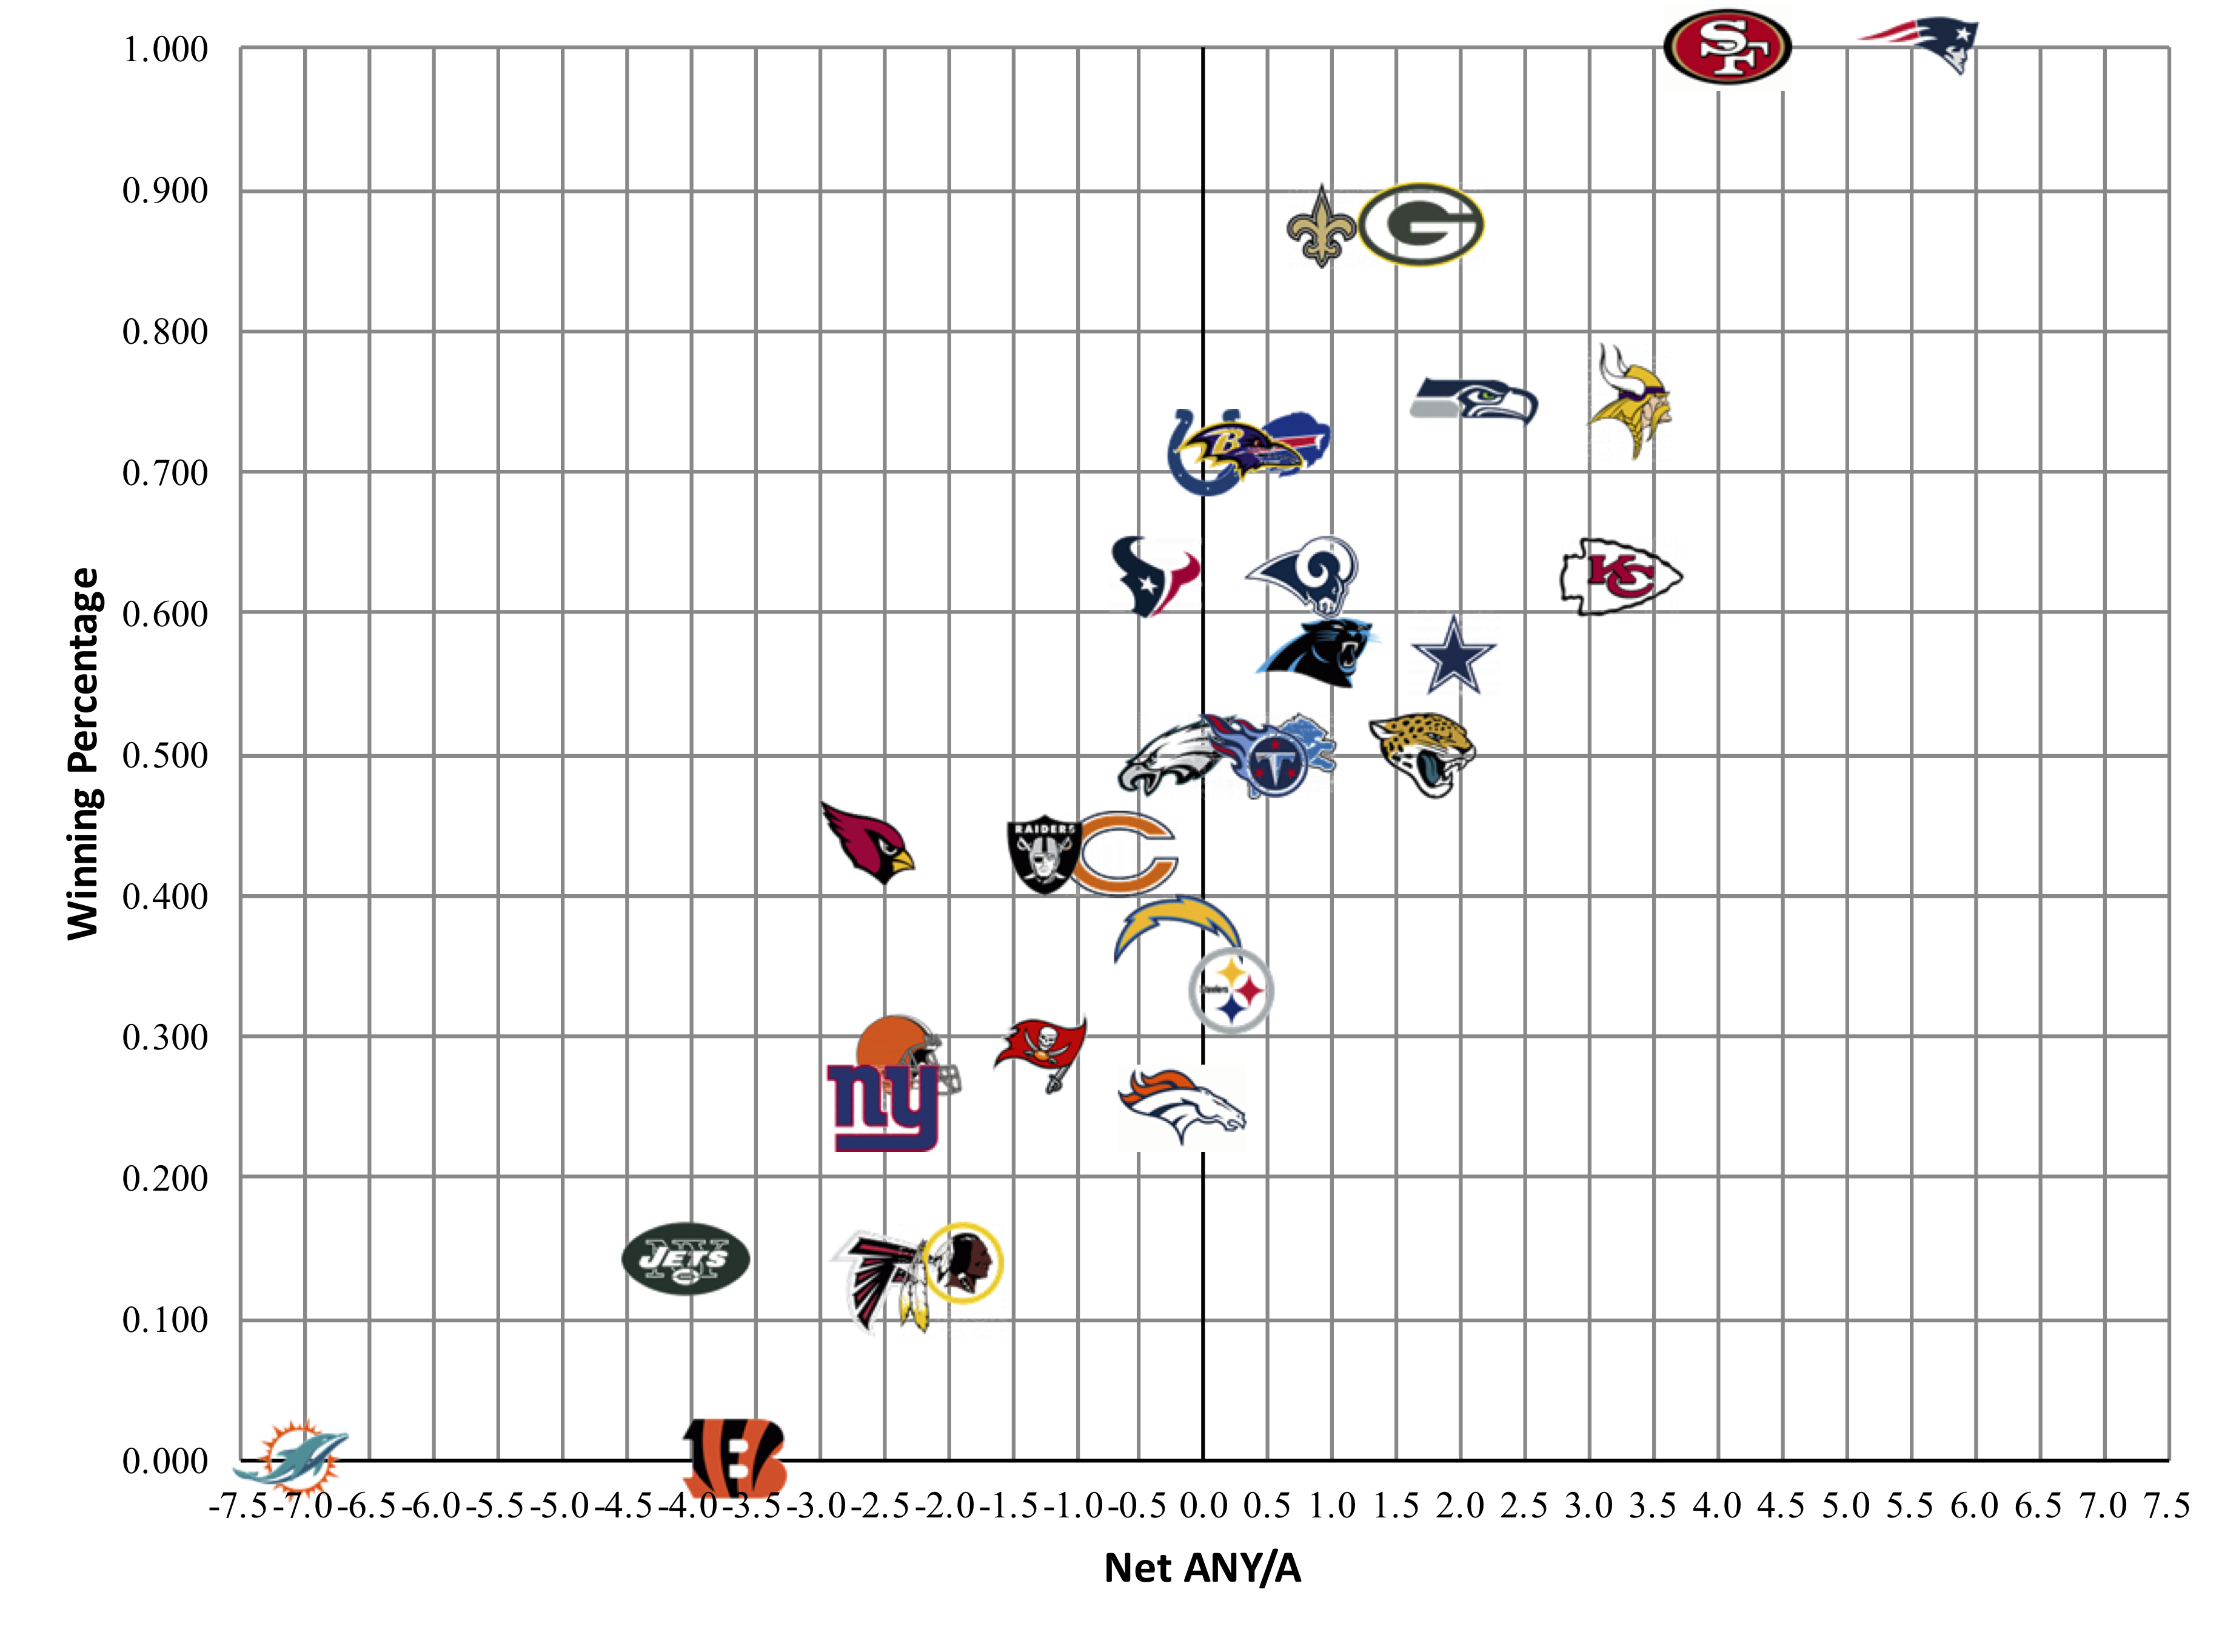
In fact, they are so much at the extremes that it’s hard to read the graph. So let’s run it again, but only make the X-Axis go from -4.5 to 4.5, cutting off those two AFC East teams.
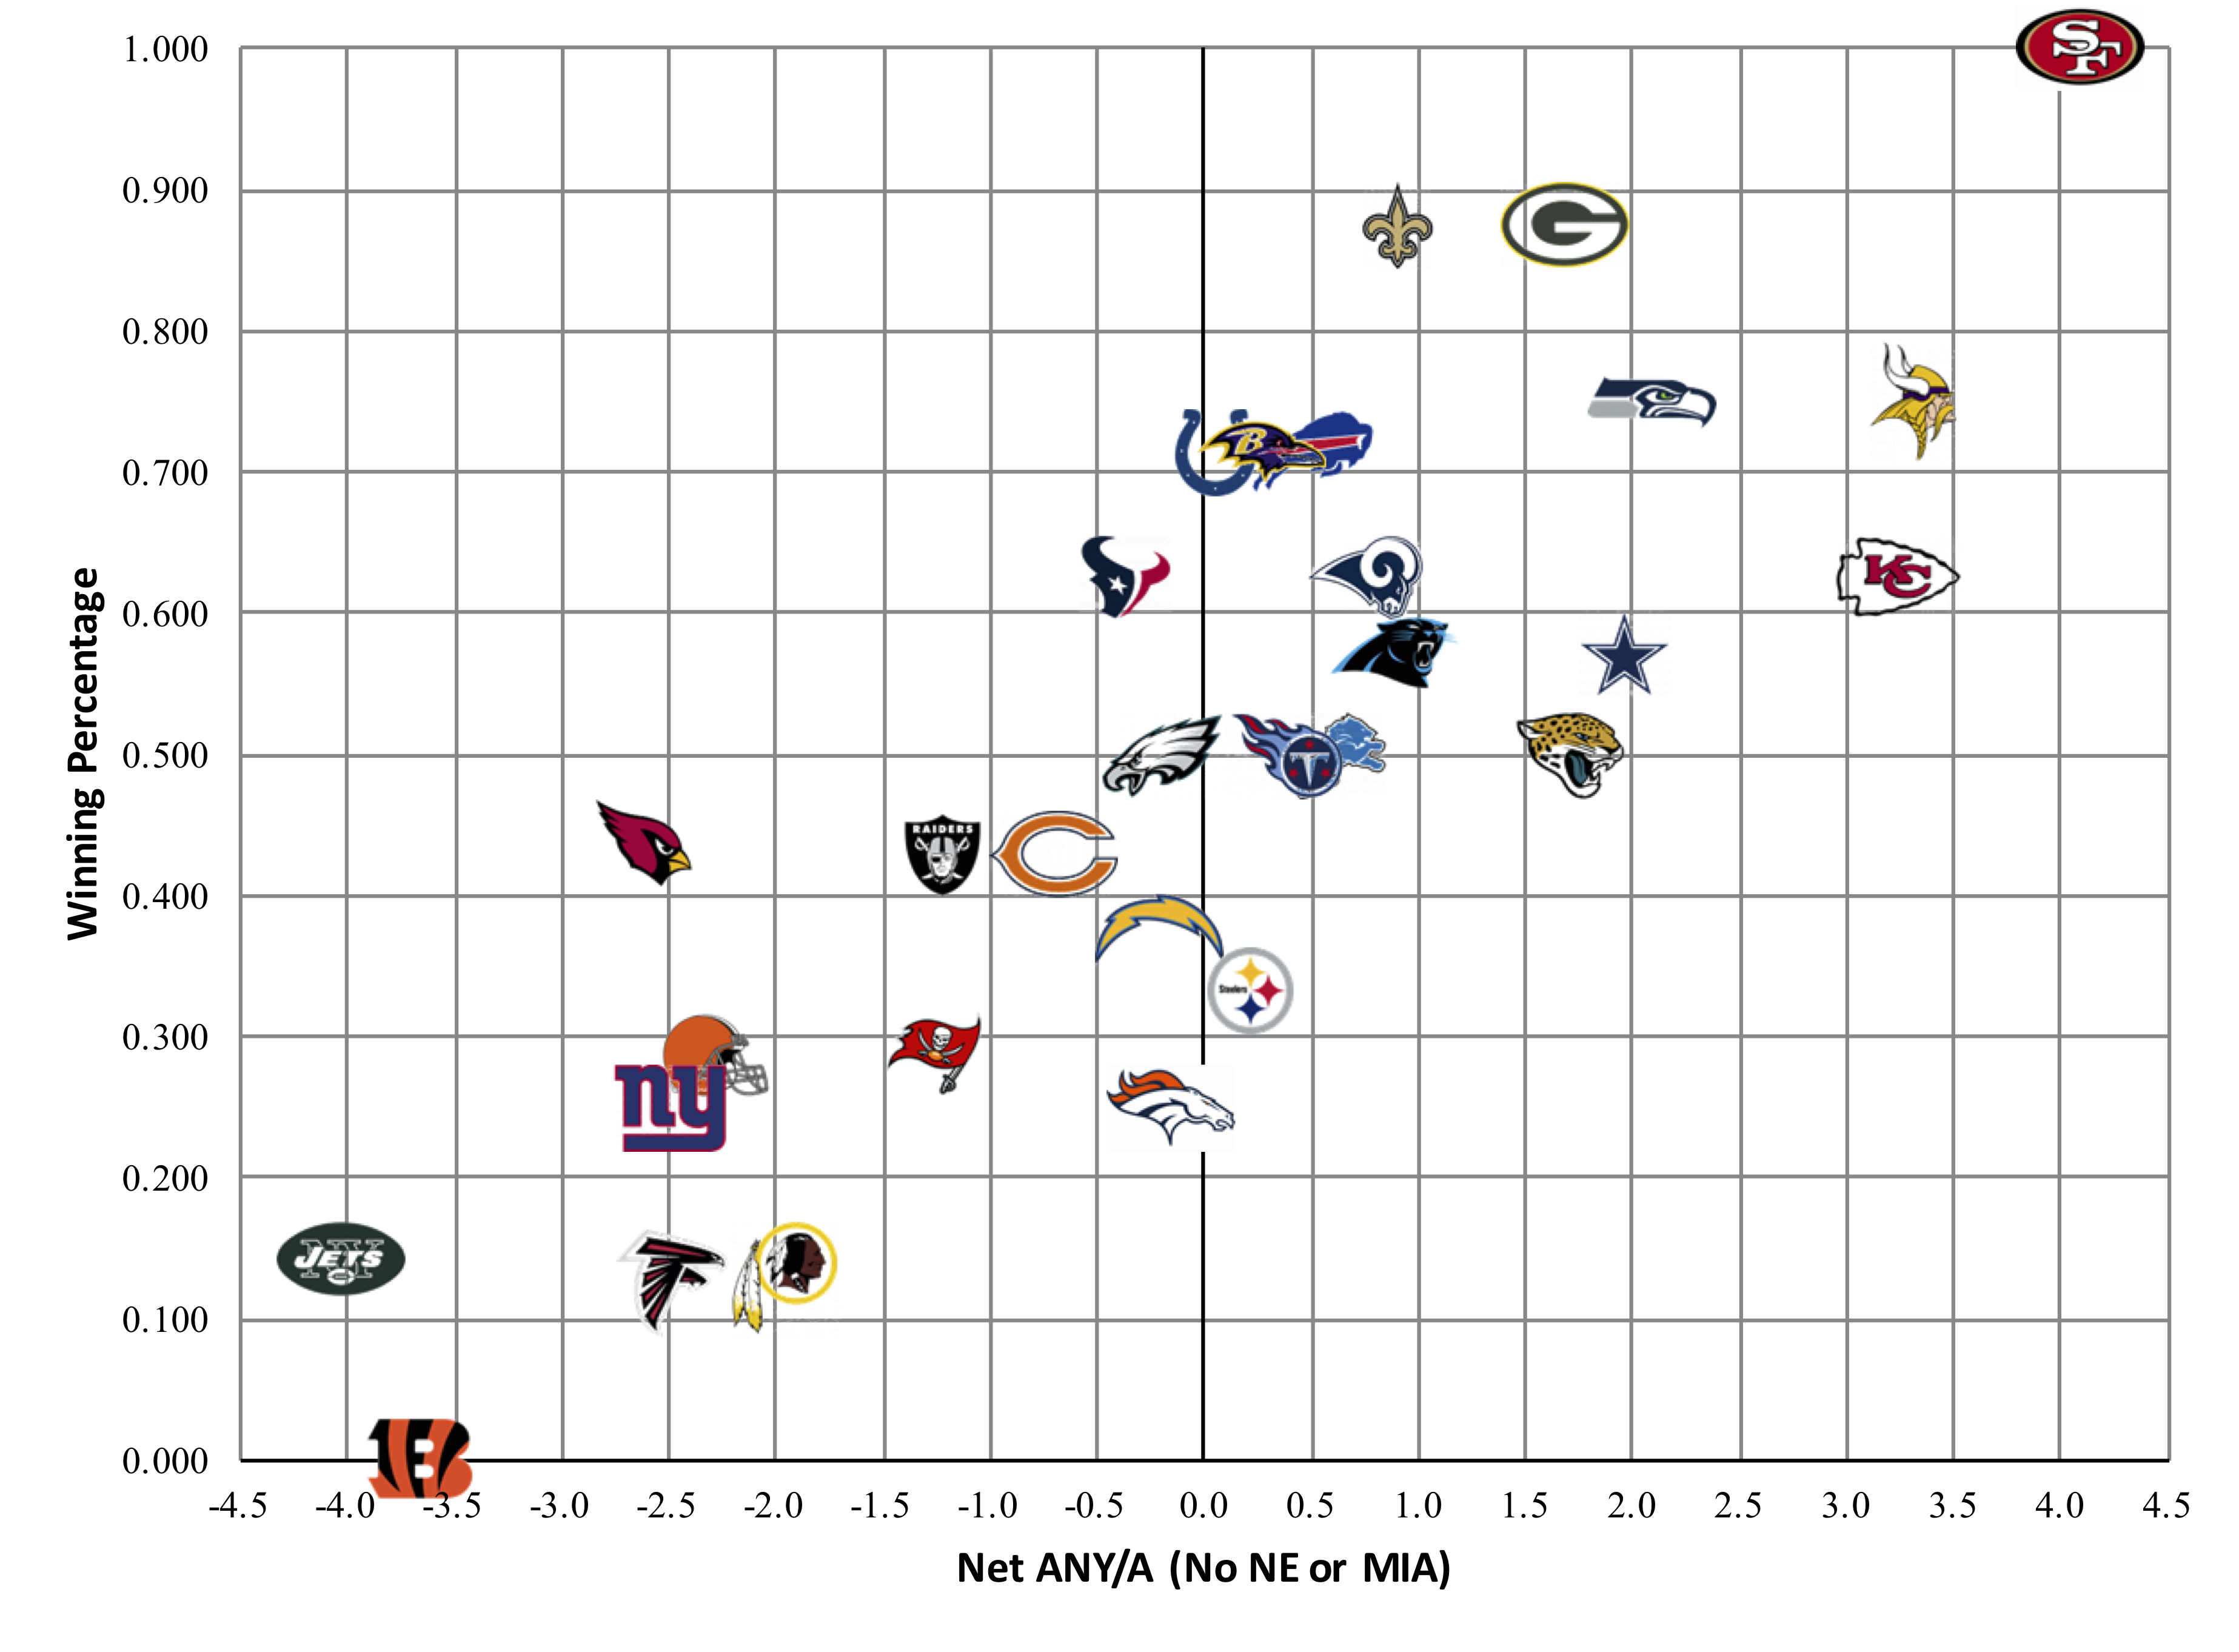
The Colts, who are about half a yard of ANY/A above average on offense and half a yard below average on defense, look to be an average team using this methodology. In reality, they are 5-2, and unlike say Baltimore and Buffalo, they don’t have a rushing quarterback who is adding more value than just the ANY/A implies. All 7 Colts games so far this year have been decided by one score, and at 5-2, it’s pretty easy to make the argument that they haven’t been playing as well as their record indicates. Similarly, the Broncos look much better than their 2-6 record. Of course, on Sunday, the Colts beat Denver after hitting a 51-yard field goal in the final seconds, helping to widen these extremes.
What stands out to you?