There were 14 NFL teams back in 1962, and the starting quarterbacks for 11 of them averaged more yards per pass attempt than the starting quarterbacks for those same teams did in 2018. We learned that in Part I of this series. Today, in Part II, we will look at the evolution of passing efficiency in the NFL since 1940.
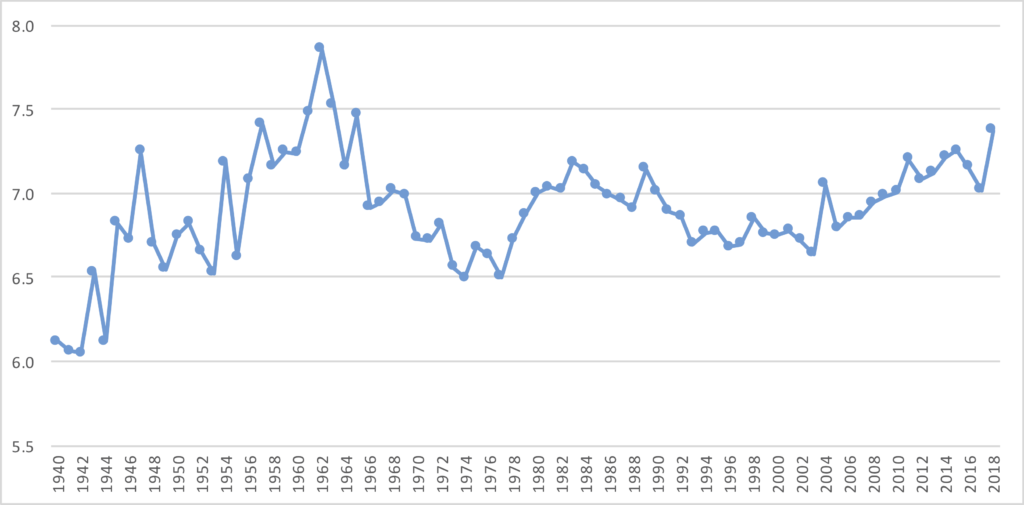
In 1962, the league as a whole averaged 7.9 yards per pass attempt. That’s a remarkable figure. So remarkable that it remains the record and is unlikely to be broken anytime soon. The graph below shows the NFL yards per attempt average in each season from 1940 to 2018.
 It doesn’t take a long examination to see that the 1962 season is a significant outlier. So what caused this? It helps to begin by breaking down yards per attempt into two components: Completions per Attempt and Yards per Completion; the product of these two statistics is, of course, yards per attempt.
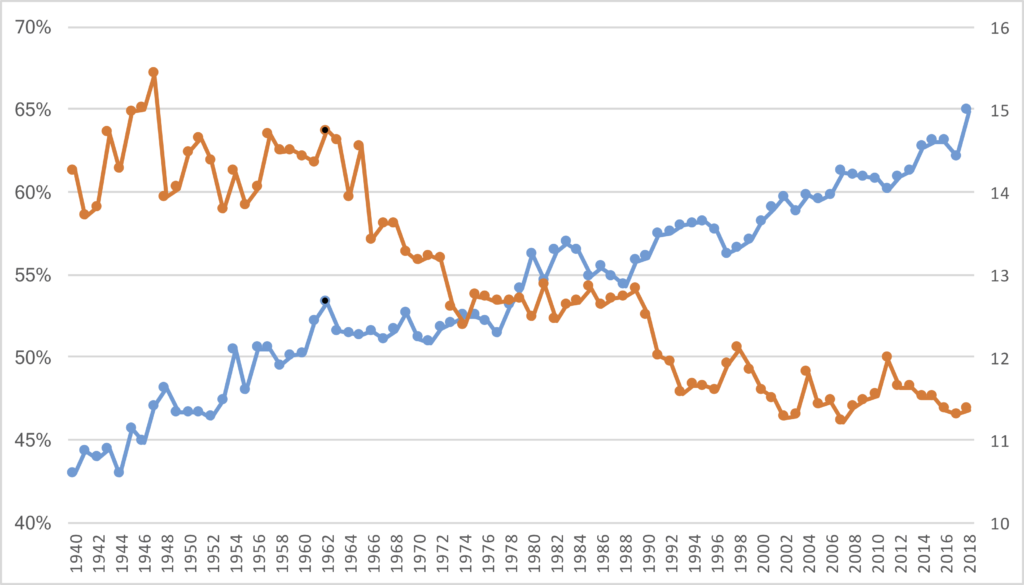
Over the last 80 years, completion percentages have been rising. This is well known, but less discussed is that the average gain on those completed passes — the statistic known as yards per completion — has been steadily falling. The graph below shows the NFL average completion percentage in blue and marked against the Left Y-Axis, and NFL yards per completion average in orange marked against the Right Y-Axis, for each year from 1940 to 2018. The graph forms a jagged X: yards per completion starts up and to the left and ends down and to the right, with completion percentage beginning in the lower left quadrant and ending on the upper right quadrant.
 To make it easier for you to see, I shaded the 1962 season in black dots on both lines. There was a large jump in completion percentage in 1962 — in fact, ’62 set the new record for completion percentage in a season at 53%, and that mark wasn’t broken until 1979! On the other hand, this wasn’t shocking for the era: after all, 1961 also set a new record for completion percentage. The 53% rate was notably high and a bit of an outlier, but part of a (still) growing trend towards higher completion percentages year over year.
On the other hand, the 1962 season also represented a reversal of the trend in terms of yards per completion. Teams gained 14.74 yards per completed pass, the 4th-highest since 1940 both at the time and since. And the three higher seasons all had come well over a decade earlier, so this was a true change in the tides. Not only were teams completing more passes than ever, but they were doing so at a rate similar to what happened prior to 1950.
Of course, simple math tells us that if you have an extraordinarily high (for that era) completion percentage combined with an extraordinarily high yards per completion average, that you will wind up with a record-setting yards per attempt average. And that’s exactly what happened. The early 1960s were somewhat of an inflection point in this regard: the top three yards per attempt seasons in NFL history were in 1961, 1962, and 1963! And the 4th-best mark came in 1965.
In the early part of the ’60s, while the AFL was earning a reputation for being a pass-happy league, the NFL was quietly enjoying its most pass efficient seasons in history. And to be clear, all data in this post is NFL-only. But even among this era of rising completion percentages and still-high YPC averages, the ’62 season stands alone. If 1962 didn’t exist, we’d talk about how 1961 and 1963 were remarkably high yards/attempt seasons, but 1962 easily eclipses both of those marks.
Finally, here is the data from every year since 1940, presented in table form.

So what caused all of this? Stay tuned for Part III.
