
How has the NFL evolved when it comes to third down passing? Using the PFR Play Index, I looked at all passes on third downs in each season from 1997 to 2017 that met the following criteria:
- The play came during the regular season.
- The pass happened in the first three quarters of the game to minimize the effects of game situation, as 4th quarter passes may be different than passes earlier in the game (although that’s worth investigating, too!).
- The team on offense was down by no more than 14 points or up by no more than 14 points, to again minimize the effects of game situation.
- The distance was between 5 and 10 yards to go, to isolate obvious passing situations but not hopeless ones.
What were the results? What do you *think* the results would be?
As it turns out, the rate at which teams convert on third downs has been relatively constant. It’s ticked up slightly over the years, but in these situations, teams have picked up a first down on about 36.0% of all pass plays (pass attempts plus sacks). That number was 34.2% from 1997 to 2001, and up to 36.8% from 2013-2017. The results from each season are plotted below:

The changes to the underlying metrics are pretty much in the direction you would expect, but maybe not the magnitude. Completion percentages went up, although not as much as you probably thought (average of 54.8%; 52.8% average the first 5 years, 56.4% average the last 5 years), sack rate was consistently just south of 10%, interception rate went down, but only barely (3.5% overall 3.7% the first 5 years, 3.2% the last 5), touchdown percentage went slightly up (4.0%, 3.6%, 4.3%), yards per attempt went up (6.9, 6.6, 7.3) and yards per completion was pretty stable around 12.6.
But here’s the question I really wanted to examine. If you know a quarterback completed a pass on third down, how likely was it to go for a first down? This is the sort of thing that feels like it should have changed over the years. After all, more teams are throwing shorter passes, so a completion on 3rd-and-8 is hardly a guarantee to go for a first down. Right?
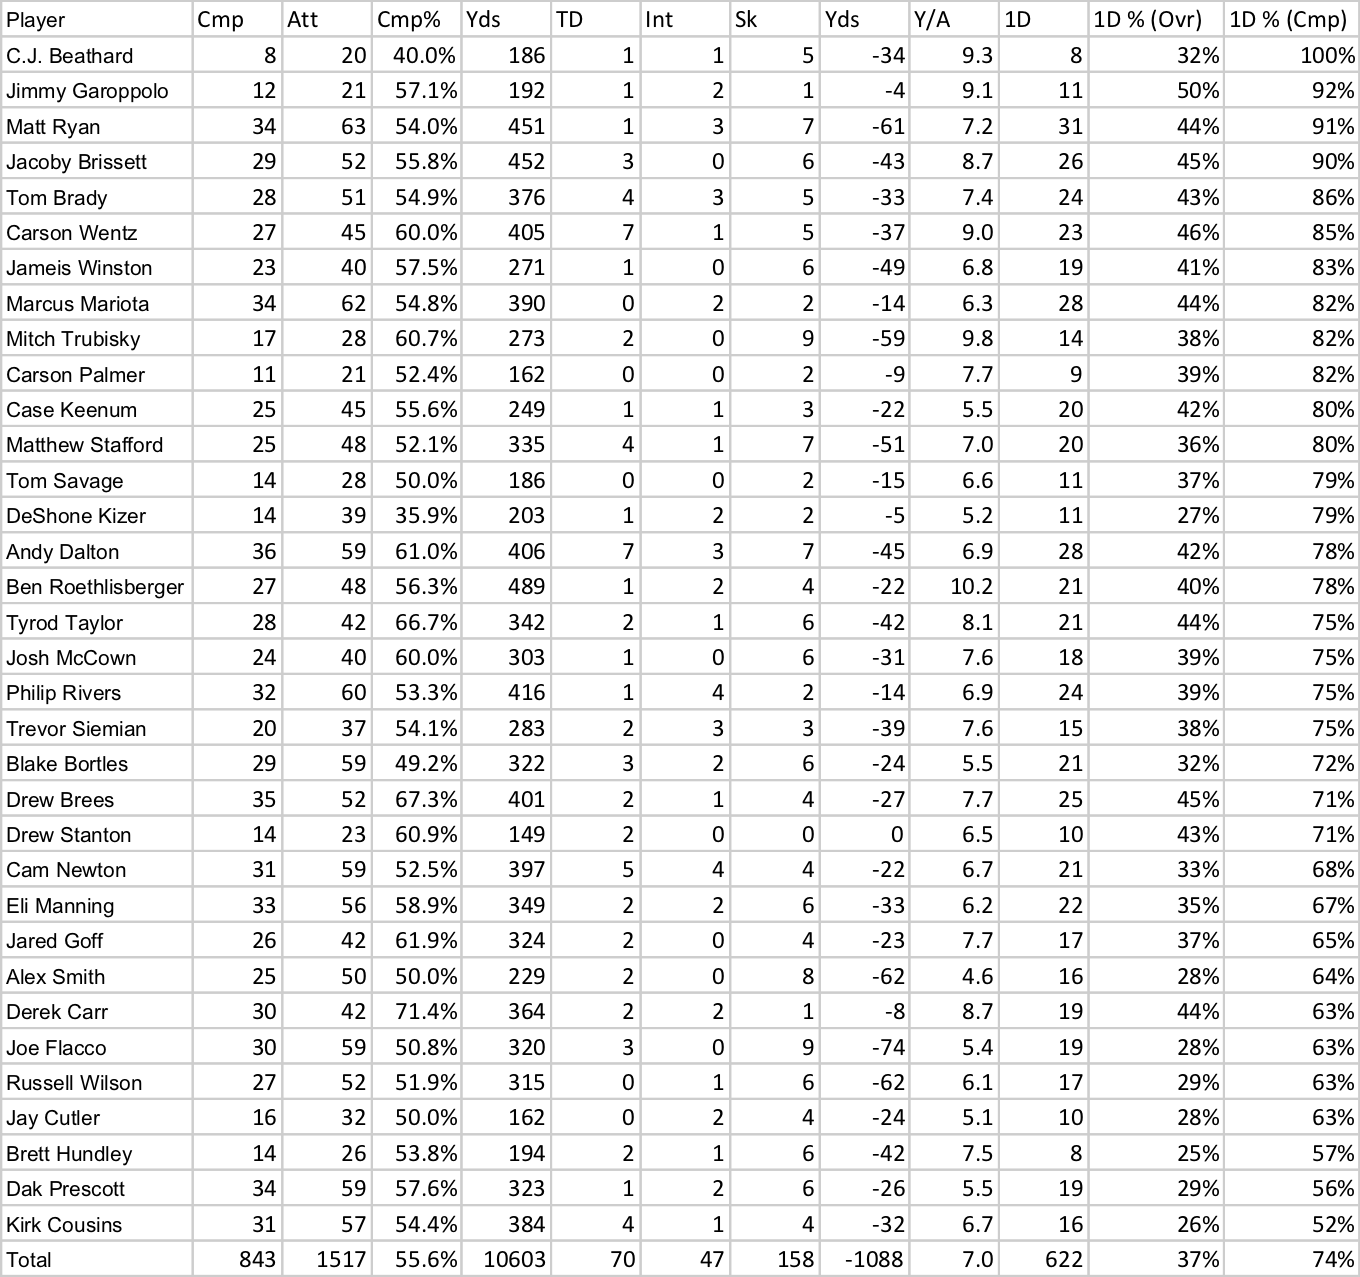
The table below shows all quarterbacks in 2017 who had at least 20 pass attempts in these situations, and is sorted from highest first down rate (assuming the pass was completed) to lowest. In other words, the players at the bottom are the checkdown artists, which might be because of a style of play or because of a poor supporting cast:
But to my surprise, in the aggregate, the percentage of completed passes that went for a first down has actually increased slightly during this time period:

Teams have generally averaged around a 72% conversion rate on third downs conditional on having completed the pass, whether the pass was completed in 1997 or 2007 or 2017. That’s pretty interesting, and not what I expected.
The full dataset below.
| Year | Cmp | Att | Cmp% | Yds | TD | Int | Sk | 1D | 1D% (Ovr) | 1D% (Cmp) |
|---|---|---|---|---|---|---|---|---|---|---|
| 1997 | 839 | 1639 | 51.2 | 10832 | 57 | 67 | 175 | 633 | 34.9% | 75.4% |
| 1998 | 842 | 1564 | 53.8 | 10654 | 71 | 47 | 181 | 603 | 34.6% | 71.6% |
| 1999 | 896 | 1751 | 51.2 | 10782 | 62 | 70 | 164 | 616 | 32.2% | 68.8% |
| 2000 | 895 | 1605 | 55.8 | 11165 | 52 | 54 | 162 | 640 | 36.2% | 71.5% |
| 2001 | 840 | 1610 | 52.2 | 10515 | 55 | 64 | 178 | 597 | 33.4% | 71.1% |
| 2002 | 889 | 1673 | 53.1 | 10912 | 53 | 58 | 160 | 635 | 34.6% | 71.4% |
| 2003 | 888 | 1713 | 51.8 | 10888 | 73 | 79 | 185 | 624 | 32.9% | 70.3% |
| 2004 | 921 | 1673 | 55.1 | 10889 | 72 | 59 | 176 | 636 | 34.4% | 69.1% |
| 2005 | 918 | 1648 | 55.7 | 11365 | 69 | 52 | 176 | 659 | 36.1% | 71.8% |
| 2006 | 1006 | 1799 | 55.9 | 12869 | 77 | 69 | 182 | 728 | 36.7% | 72.4% |
| 2007 | 926 | 1665 | 55.6 | 11420 | 60 | 53 | 154 | 668 | 36.7% | 72.1% |
| 2008 | 933 | 1646 | 56.7 | 11415 | 64 | 52 | 172 | 666 | 36.6% | 71.4% |
| 2009 | 925 | 1662 | 55.7 | 11132 | 61 | 58 | 173 | 655 | 35.7% | 70.8% |
| 2010 | 944 | 1677 | 56.3 | 11622 | 82 | 62 | 165 | 676 | 36.7% | 71.6% |
| 2011 | 888 | 1644 | 54 | 11698 | 66 | 45 | 177 | 659 | 36.2% | 74.2% |
| 2012 | 949 | 1709 | 55.5 | 12062 | 73 | 55 | 168 | 687 | 36.6% | 72.4% |
| 2013 | 970 | 1724 | 56.3 | 12796 | 67 | 57 | 194 | 706 | 36.8% | 72.8% |
| 2014 | 950 | 1643 | 57.8 | 13079 | 89 | 59 | 165 | 709 | 39.2% | 74.6% |
| 2015 | 959 | 1694 | 56.6 | 11971 | 68 | 53 | 192 | 670 | 35.5% | 69.9% |
| 2016 | 956 | 1685 | 56.7 | 12153 | 70 | 47 | 179 | 683 | 36.6% | 71.4% |
| 2017 | 933 | 1706 | 54.7 | 11673 | 72 | 55 | 197 | 685 | 36.0% | 73.4% |
| Avg | 917 | 1673 | 54.8 | 11519 | 67 | 58 | 175 | 659 | 35.7% | 71.8% |
Leave your thoughts in the comments.