
Ten years ago, I looked at the passing distribution of NFL teams since 1970. Let’s revisit that post today, with an expanded look at what’s happened over the last decade.
I examined every season in the NFL since 1970, when the AFL and NFL merged. [1]It is not lost on me that NFL history is not linear, and in many ways, the 1960s is more similar to the 1980s than the 1970s. That said, out of laziness, I only went back to 1970. I then calculated the percentage of receiving yards for each team that went to its running backs, tight ends and wide receivers. The graph below shows the breakdown from each season from 1970 through 2021. [2]Some caveats: Obviously many players straddle the line across multiple positions. There are some judgment calls involved with H-Backs, tight ends turned wide receivers, running backs turned tight … Continue reading. There are two large trends: wide receivers have become slightly more important over time, jumping from 53% of the receiving pie during the ’70s to 63% over the last ten years. The entire jump, though, came in the aftermath of the 1978 rules changes, as the percentage of receiving yards that went to wide receivers steadily rose form 53% in 1977 to 62% in 1987 and 1988.
The other notable change is the switch in primacy of the tight end relative to the running back. From 1970 to 1983, running backs gained 27% of all receiving yards while tight ends picked up just 19% of the pie. That breakdown was pretty consistent each season: tight ends were at 18%, 19%, or 20% almost every season, and running backs consistently gained between 25% and 29& of the receiving game. The 1984 season was a weird outlier: running back production was way down while tight end production was up, but that was mostly a one year blip. From 1985 to 1994, running backs averaged 22% of the pie, a noticeable decrease from the pre-1984 era, but tight ends dropped, too, down to 15% during that decade. And from 1986 through 2007, tight ends were under 20% of the receiving pie each year. But tight ends have held steady at 20 or 21 percent, while running back production in the receiving game has dropped to about 16%. In 2004, tight ends gained more receiving yards as a group than running backs, and it has remained that way in every season since. This is strongly tied, of course, to the near-elimination of the fullback position from the modern game.
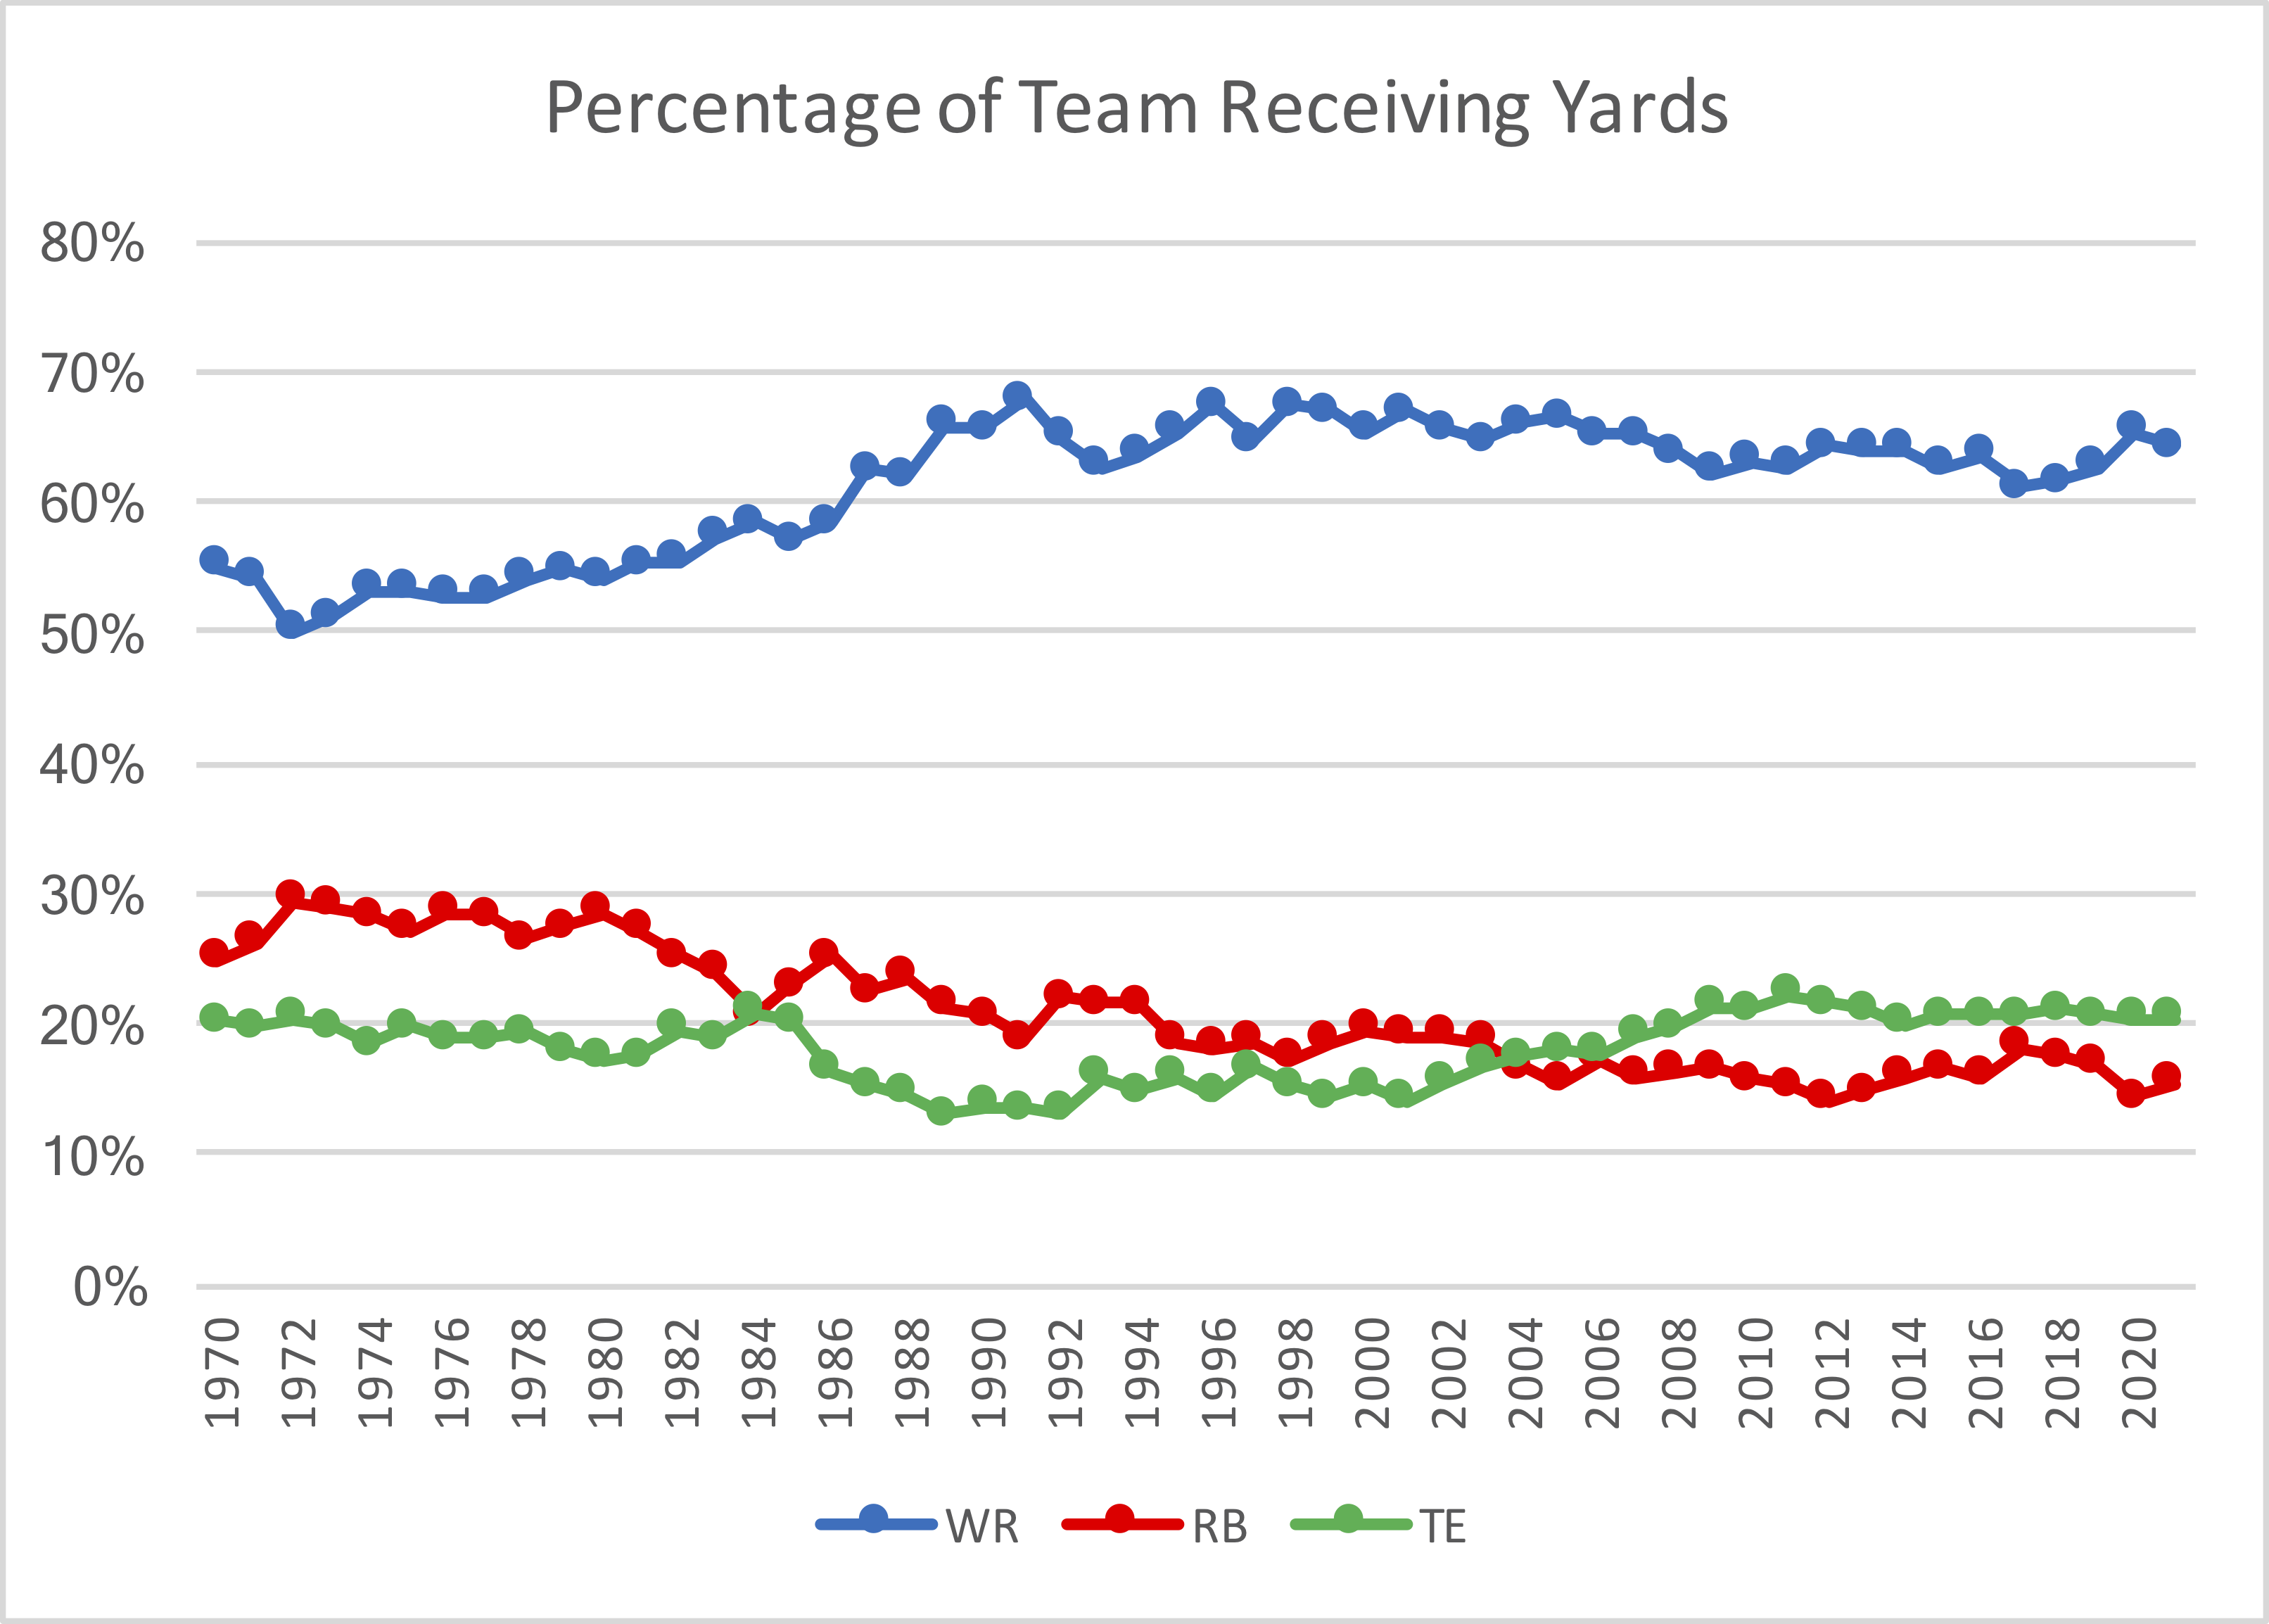
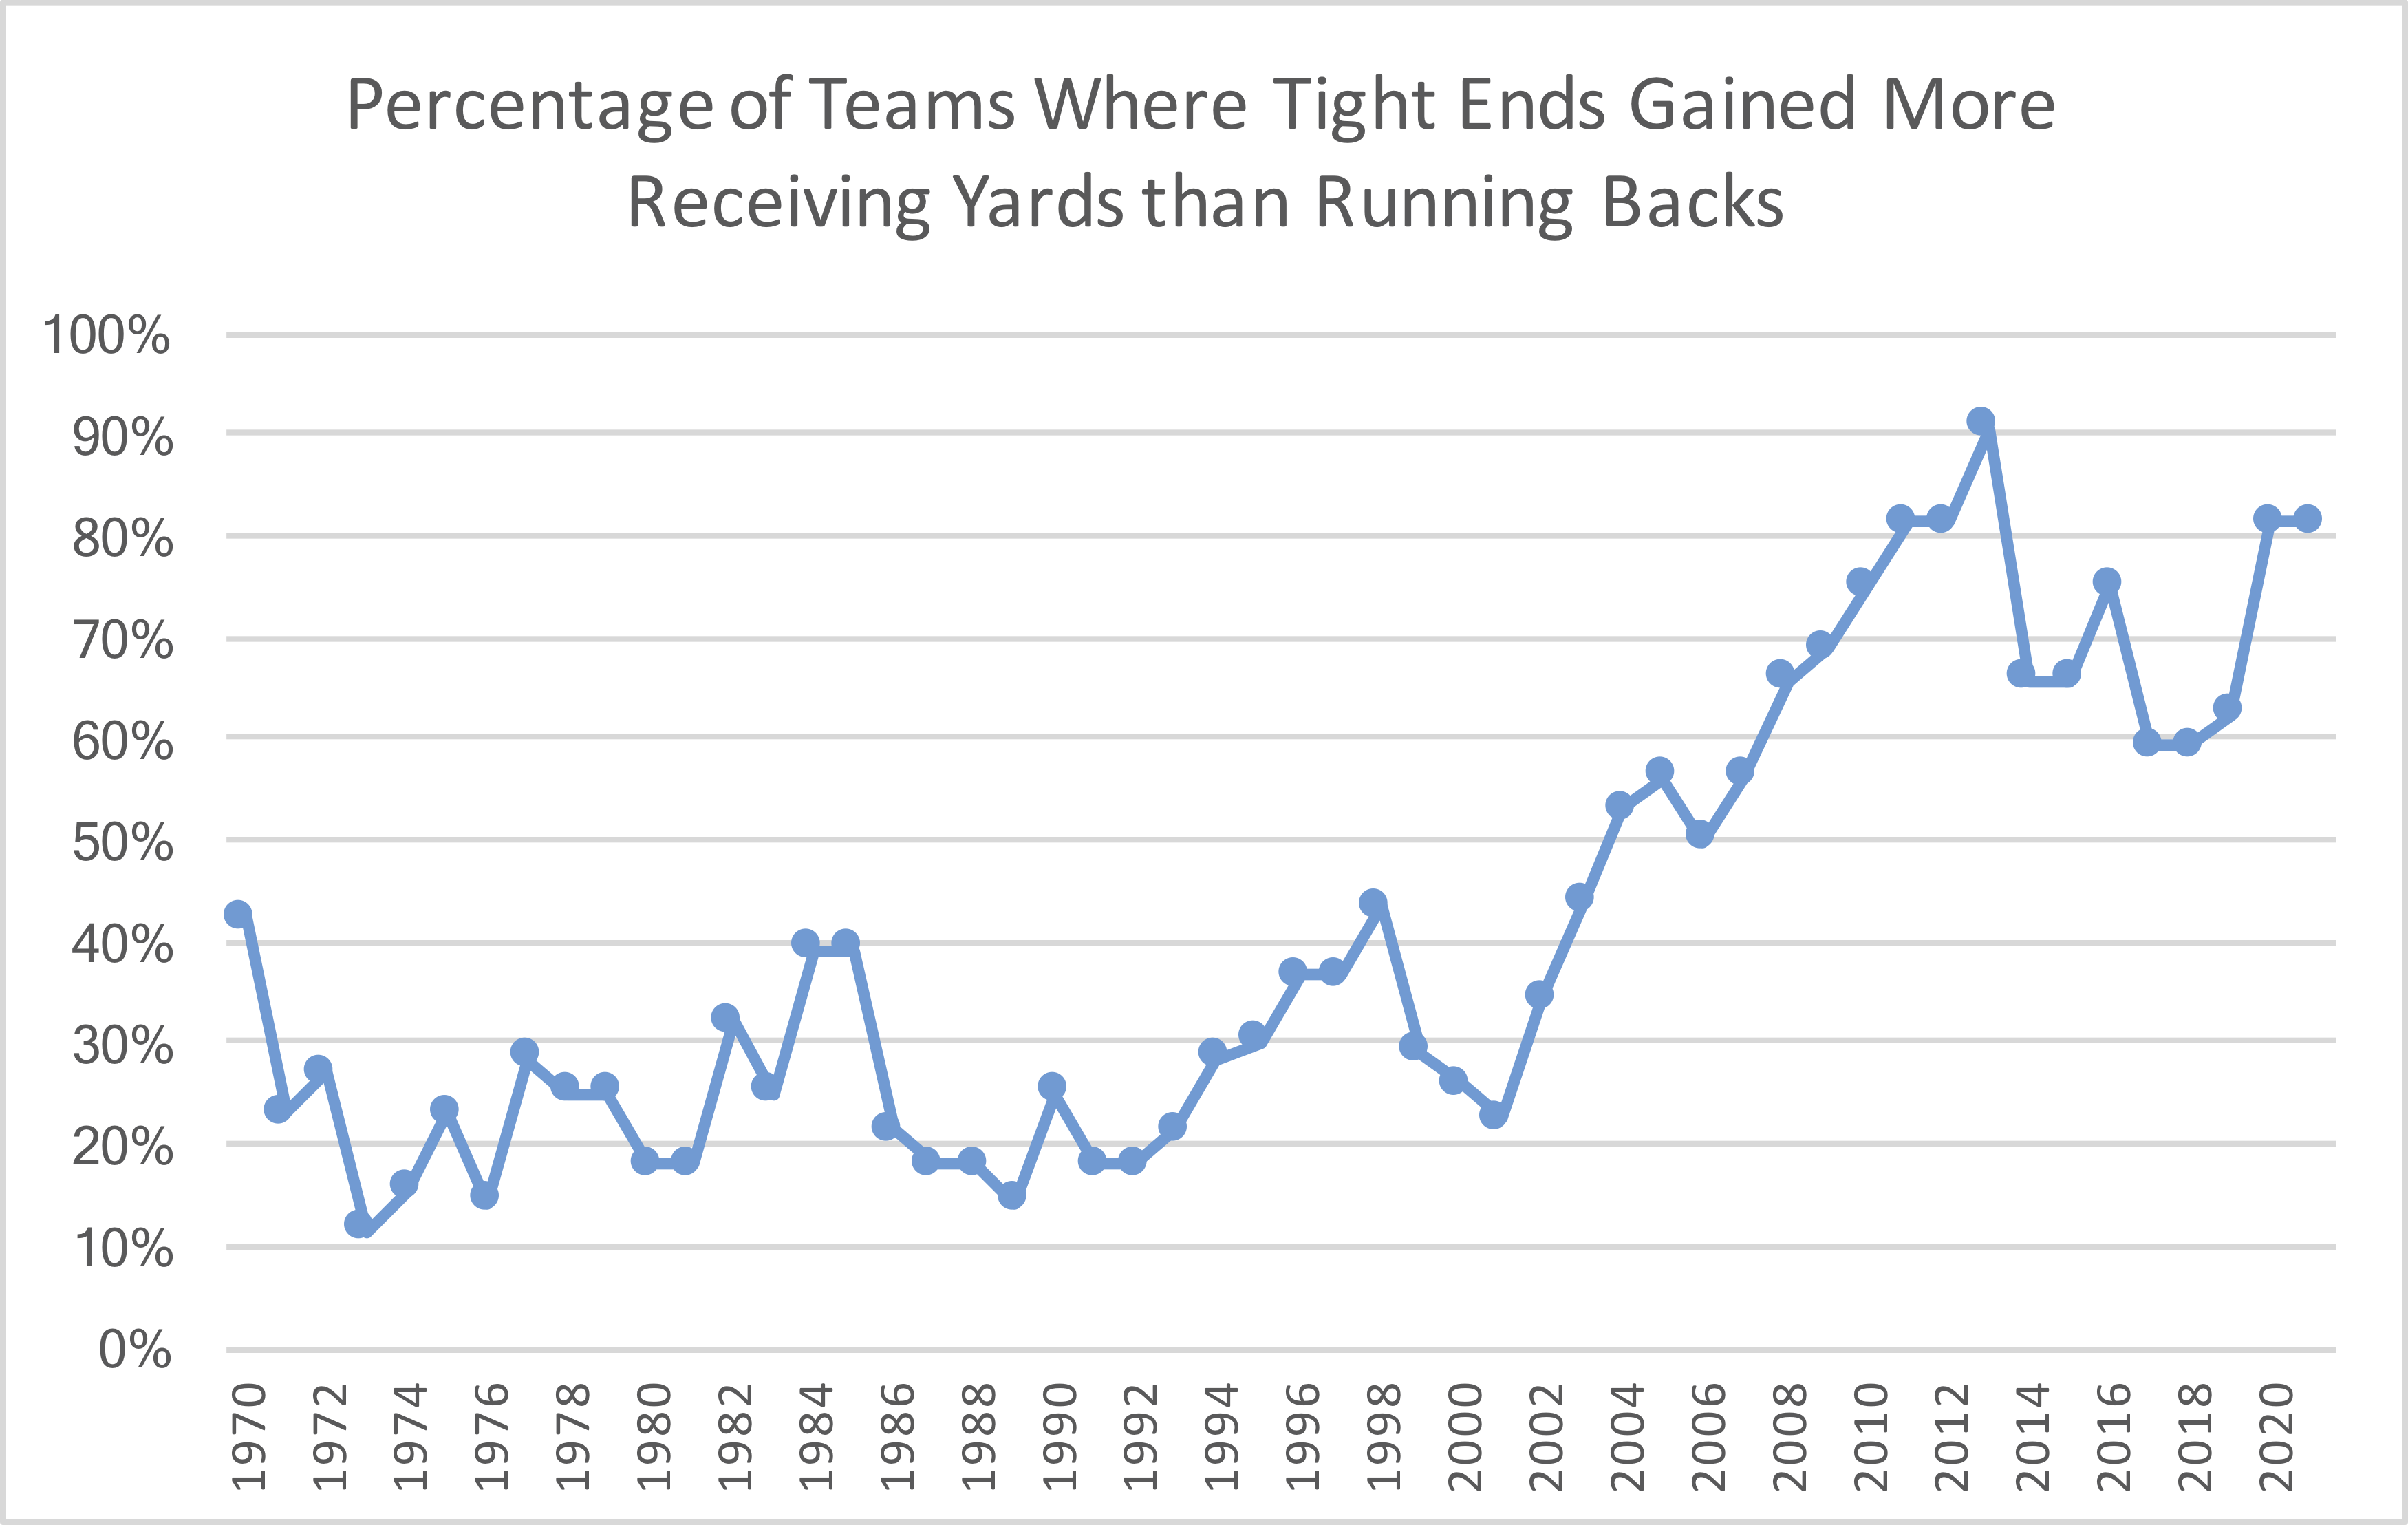
The elevation of the tight end position relative to running backs is one of the largest stories of the last 50 years. In 1973, just 3 teams — all in the AFC East (the Jets with Rich Caster, the Colts with Tom Mitchell and Raymond Chester, and the Super Bowl champion Dolphins who didn’t need to throw to their running backs — had more receiving yards from their tight ends than their running backs. Forty years later, in 2013, just 3 teams — the Lions (Joique Bell and Reggie Bush), the Chiefs (Jamaal Charles, who led the team), and the 4-12 Raiders who didn’t throw much to the tight end — had more receiving yards from their running backs than their tight ends!
But we can also look at production at a more granular level. Let’s begin with wide receivers. For each team in each season, I labeled the WR with the most receiving yards his team’s wide receiver 1, the WR with the second-most receiving yards his team’s wide receiver 2, and then all other wide receivers as WR3+. Obviously injuries can skew results, but the hope is that by looking at broad league trends, that will mostly eliminate those concerns. It’s worth noting that in some cases, a team’s WR1 may be a slot wide receiver, even though perhaps the depth chart (along with NFL analysts) might consider an outside wide receiver the team’s WR1. Regardless, the ranking of wide receivers here is based purely on receiving yards, which will get us the correct result most of the time.
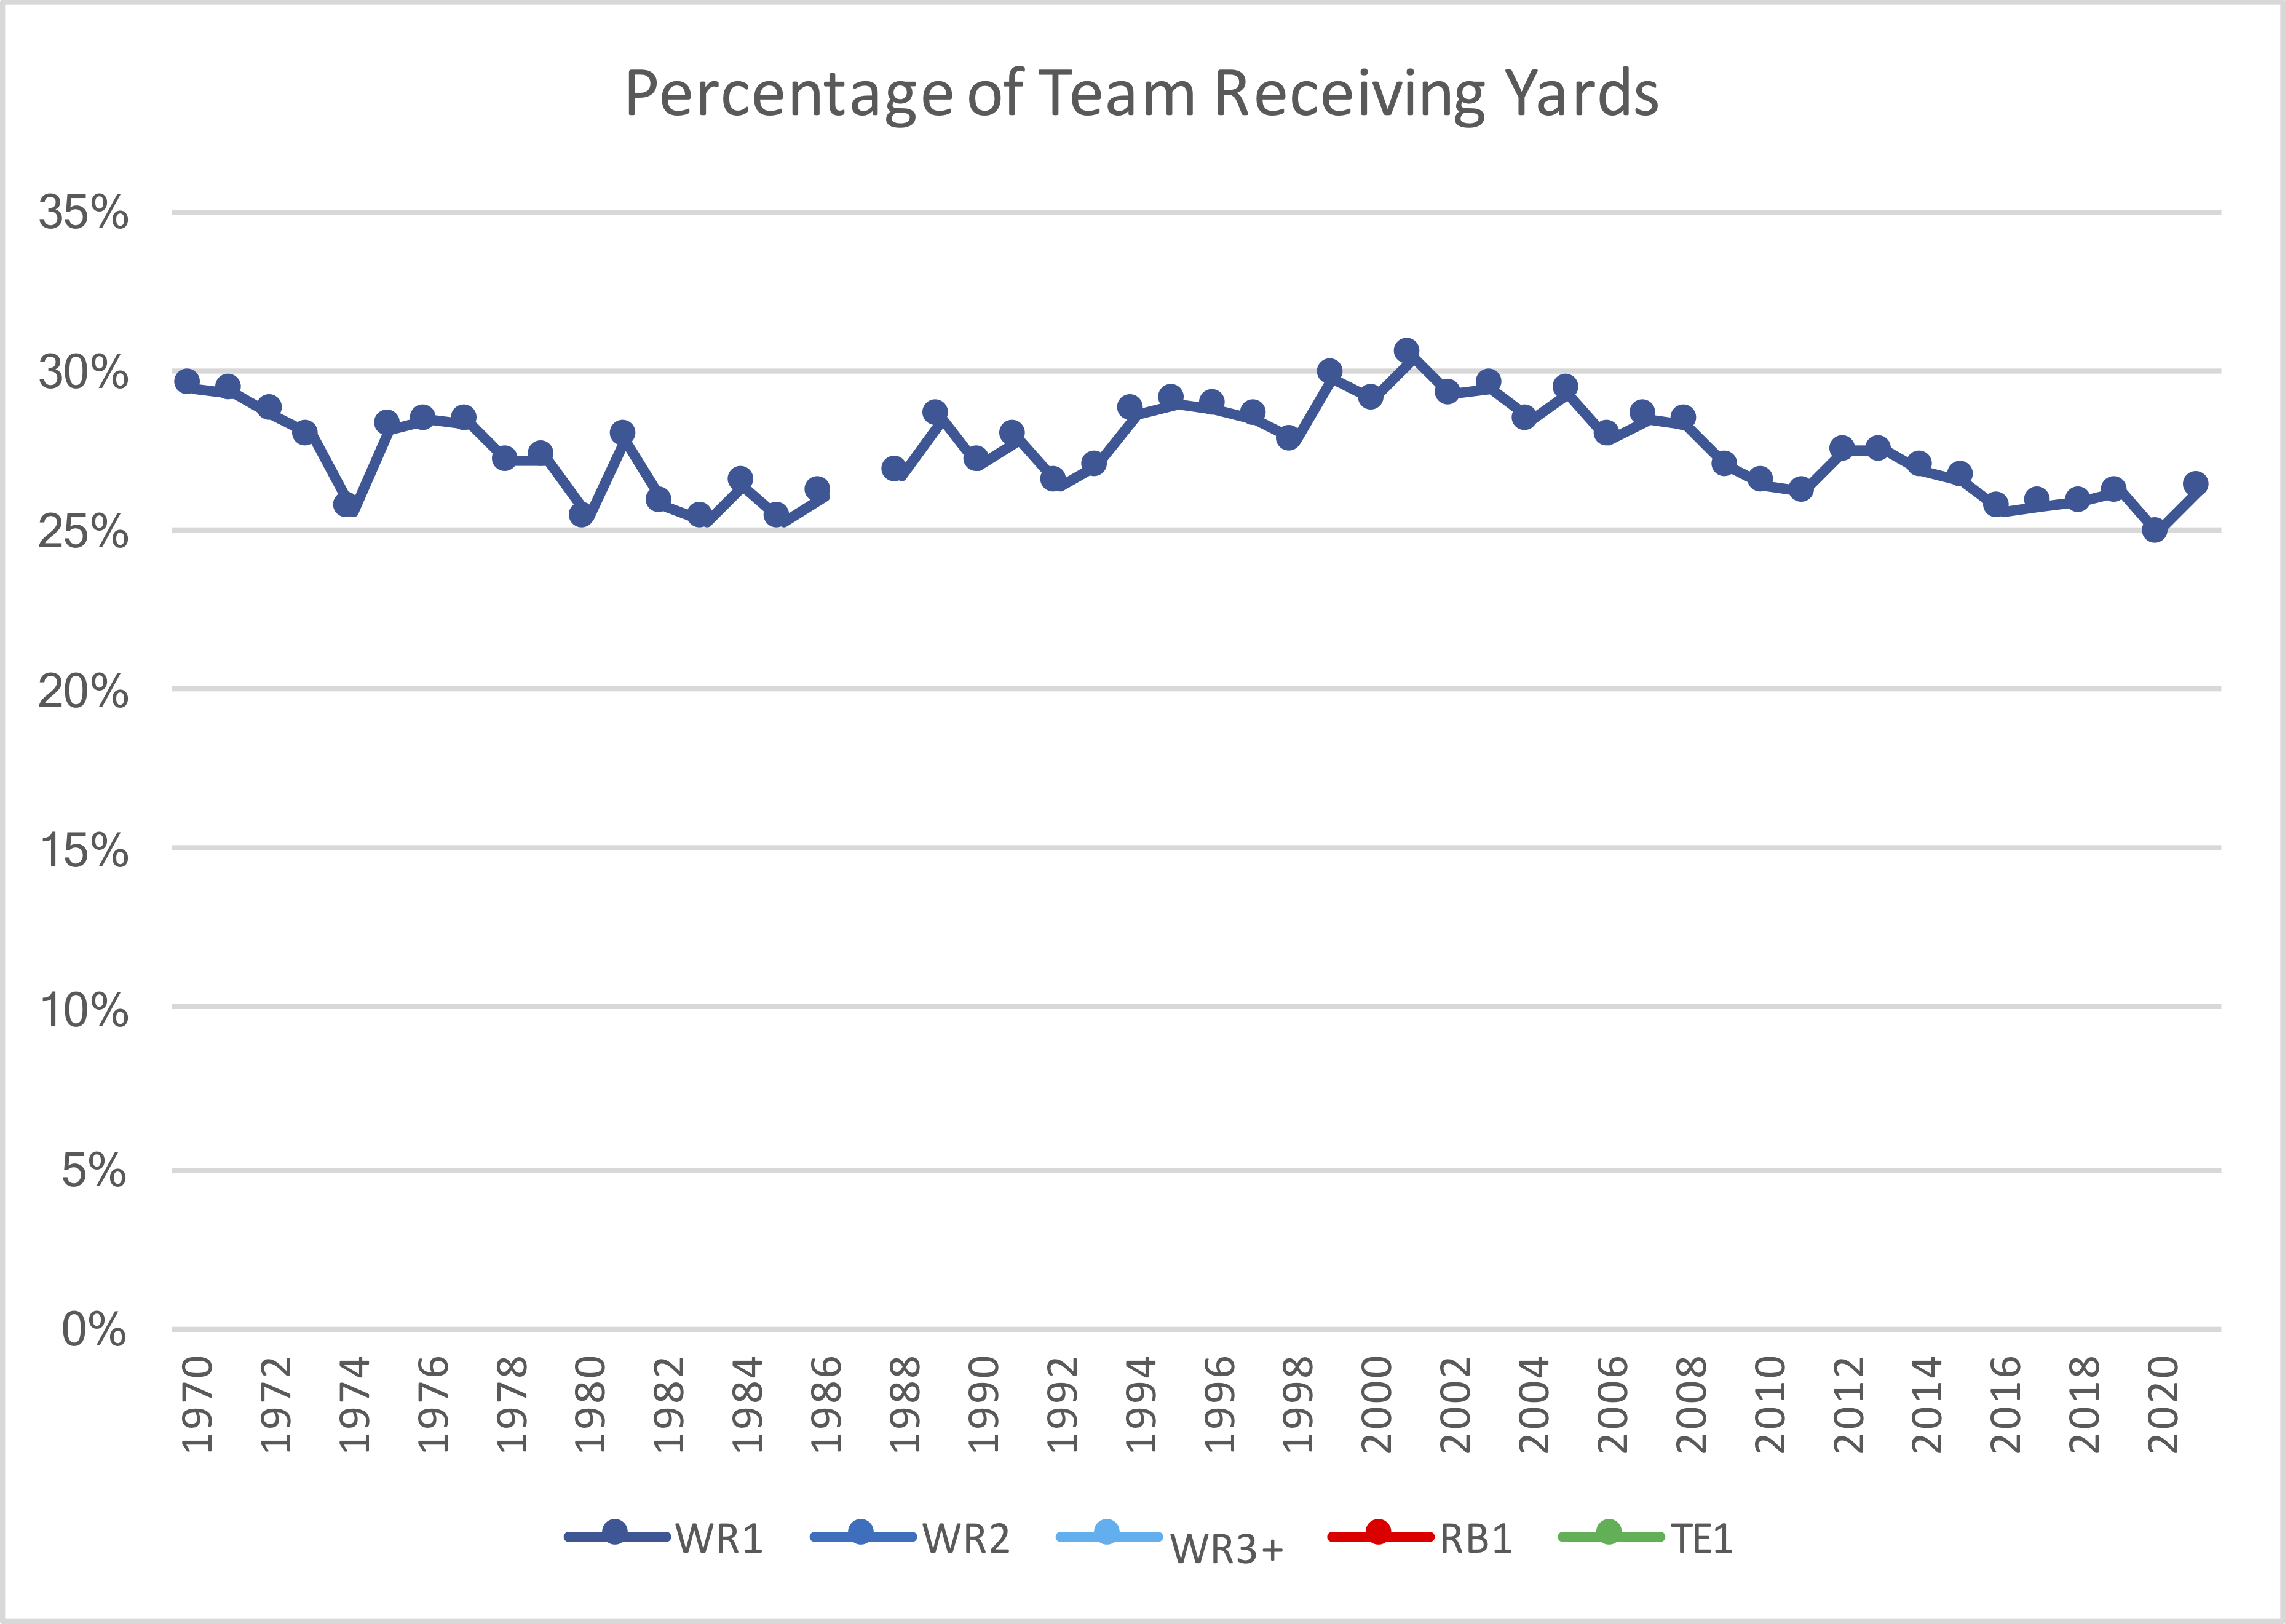
Wide Receiver 1
The production from a team’s top wide receiver has been a bit of a moving target, although within a somewhat narrow range of 25% to 30%. A team’s top wide receiver gained a larger share of the pie in the early ’70s than they do now, although teams also pass for significantly more yards. In the modern game, the early 2000s was the prime year for the top wide receiver. The stars of those eras benefited from that style of play more than the 1970s receivers (who played in the deadball era) or the current generation (where teams spread the ball around more evenly). Other than that, however, I suspect that most of the ups and downs are probably due to sample size issues rather than changes in league philosophy.
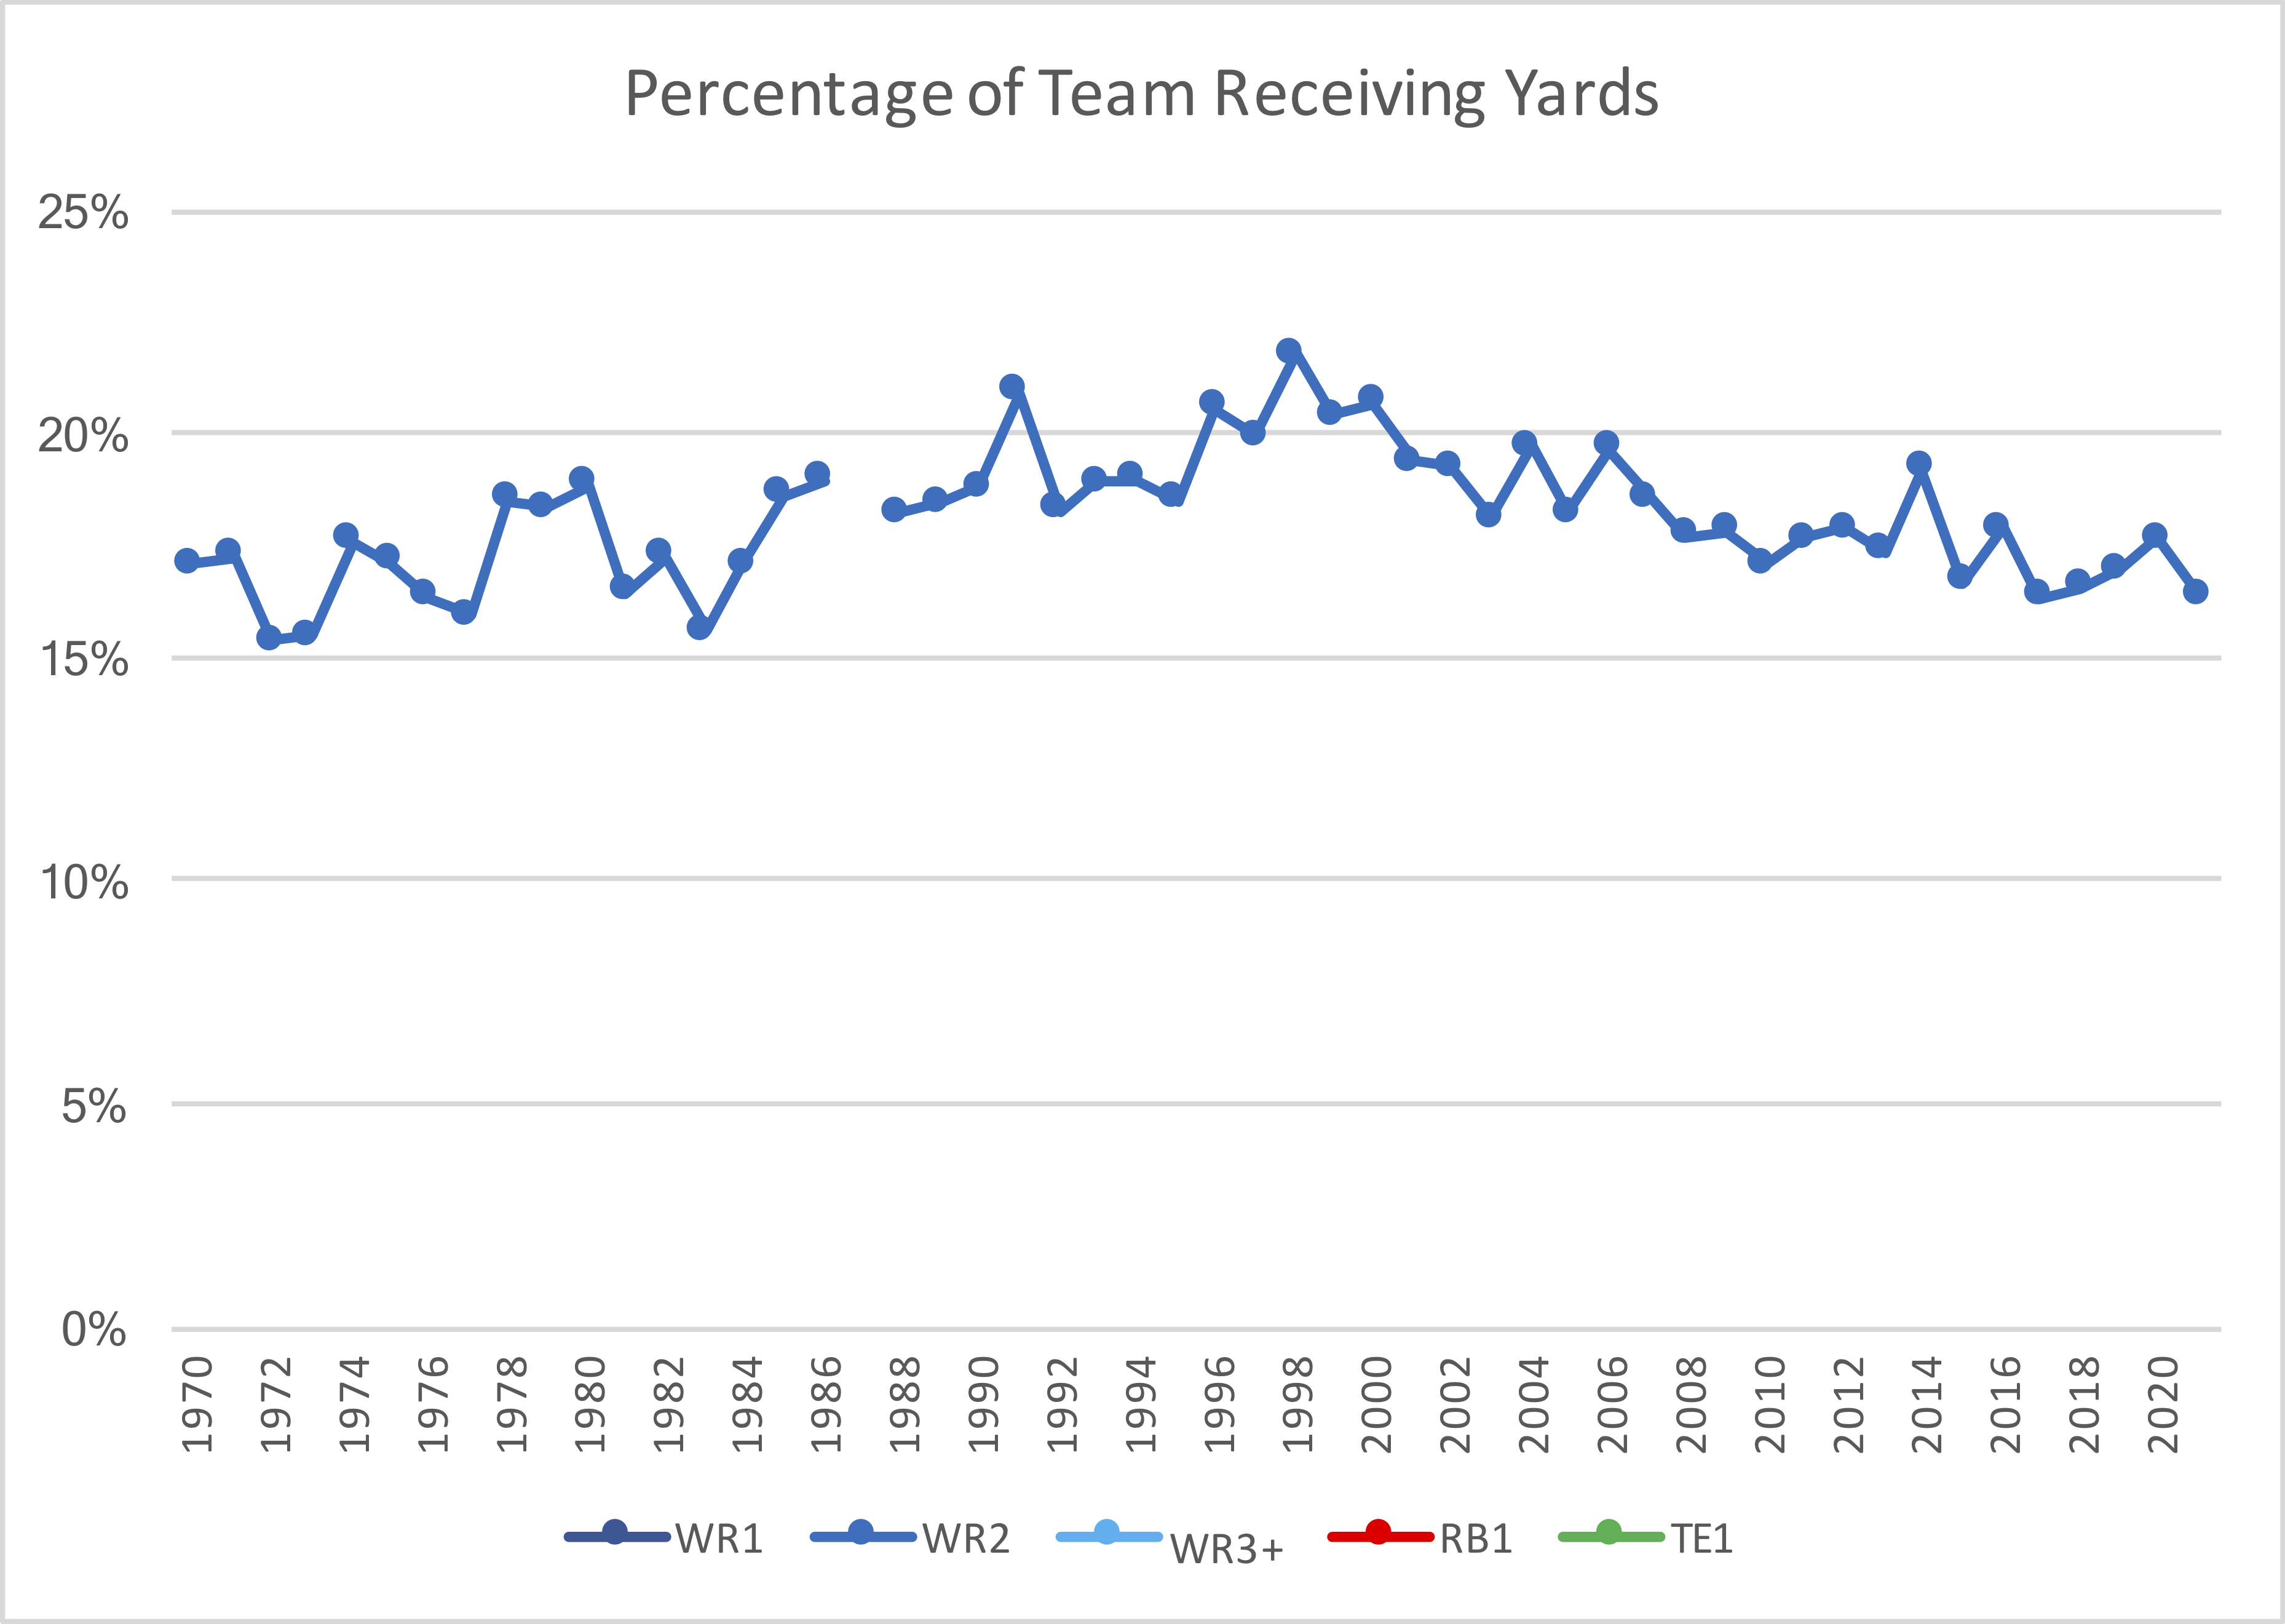
Wide Receiver 2
A team’s second wide receiver can be expected to produce about 18% of the team’s total receiving yards, a mark that has been somewhat steady over the past five decades. When we get to the TE graph, you’ll see that there is a strong negative correlation between the two groups. Together, a team’s WR2 and TE1 have produced just under 1/3 of the team’s receiving game, but in the ’90s, , teams leaned more on the WR2 than the TE1. As the TE1 becomes a better target, it’s natural to expect the WR2 to be one of the sources to give up targets. It’s reasonable to conclude that the small spike in the WR2 line in the late ’90s is strongly related to the similar decline for TE1 production over those same years.
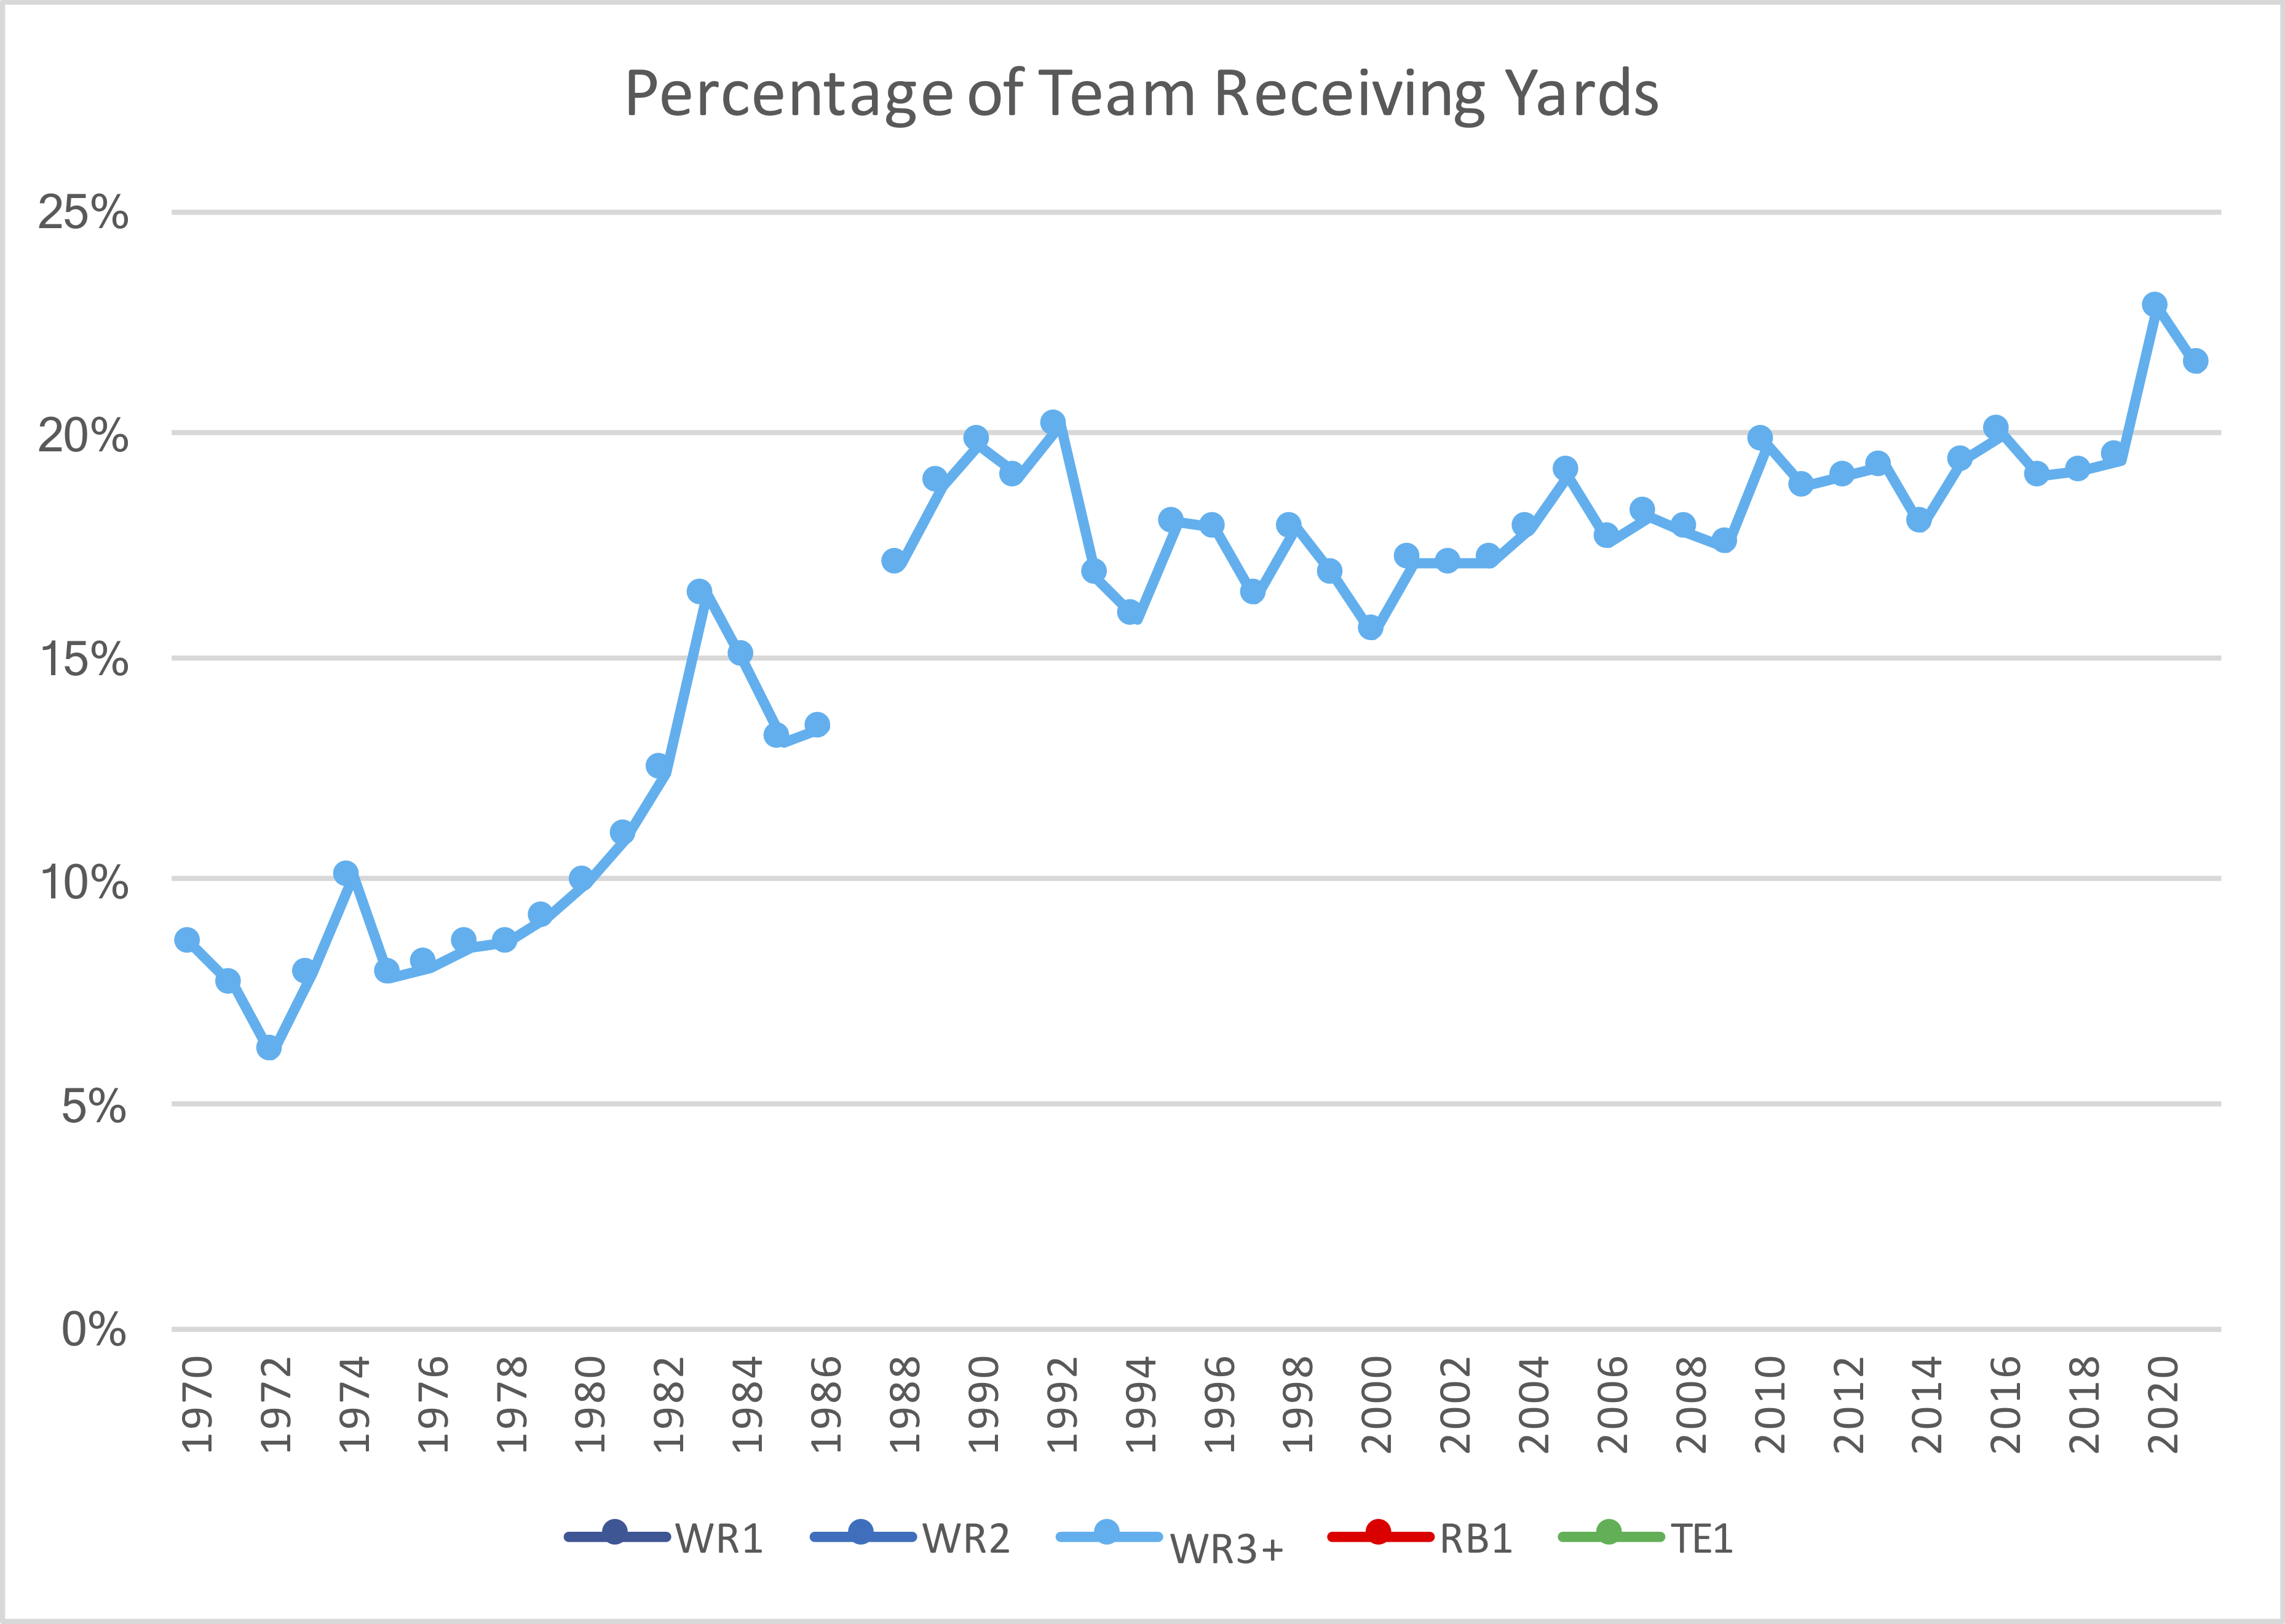
Wide Receivers 3 (and all other wide receivers)
Unsurprisingly, this chart shows the most dramatic shift. In the 1970s, wide receivers other than a team’s top two wide receivers consistently had under 10% of the team’s passing game; usually around eight percent. The last two years it was 22 and 23%! Players that used to be backups — when the fullback was still a starter — now produce over 1/5th of the passing game.
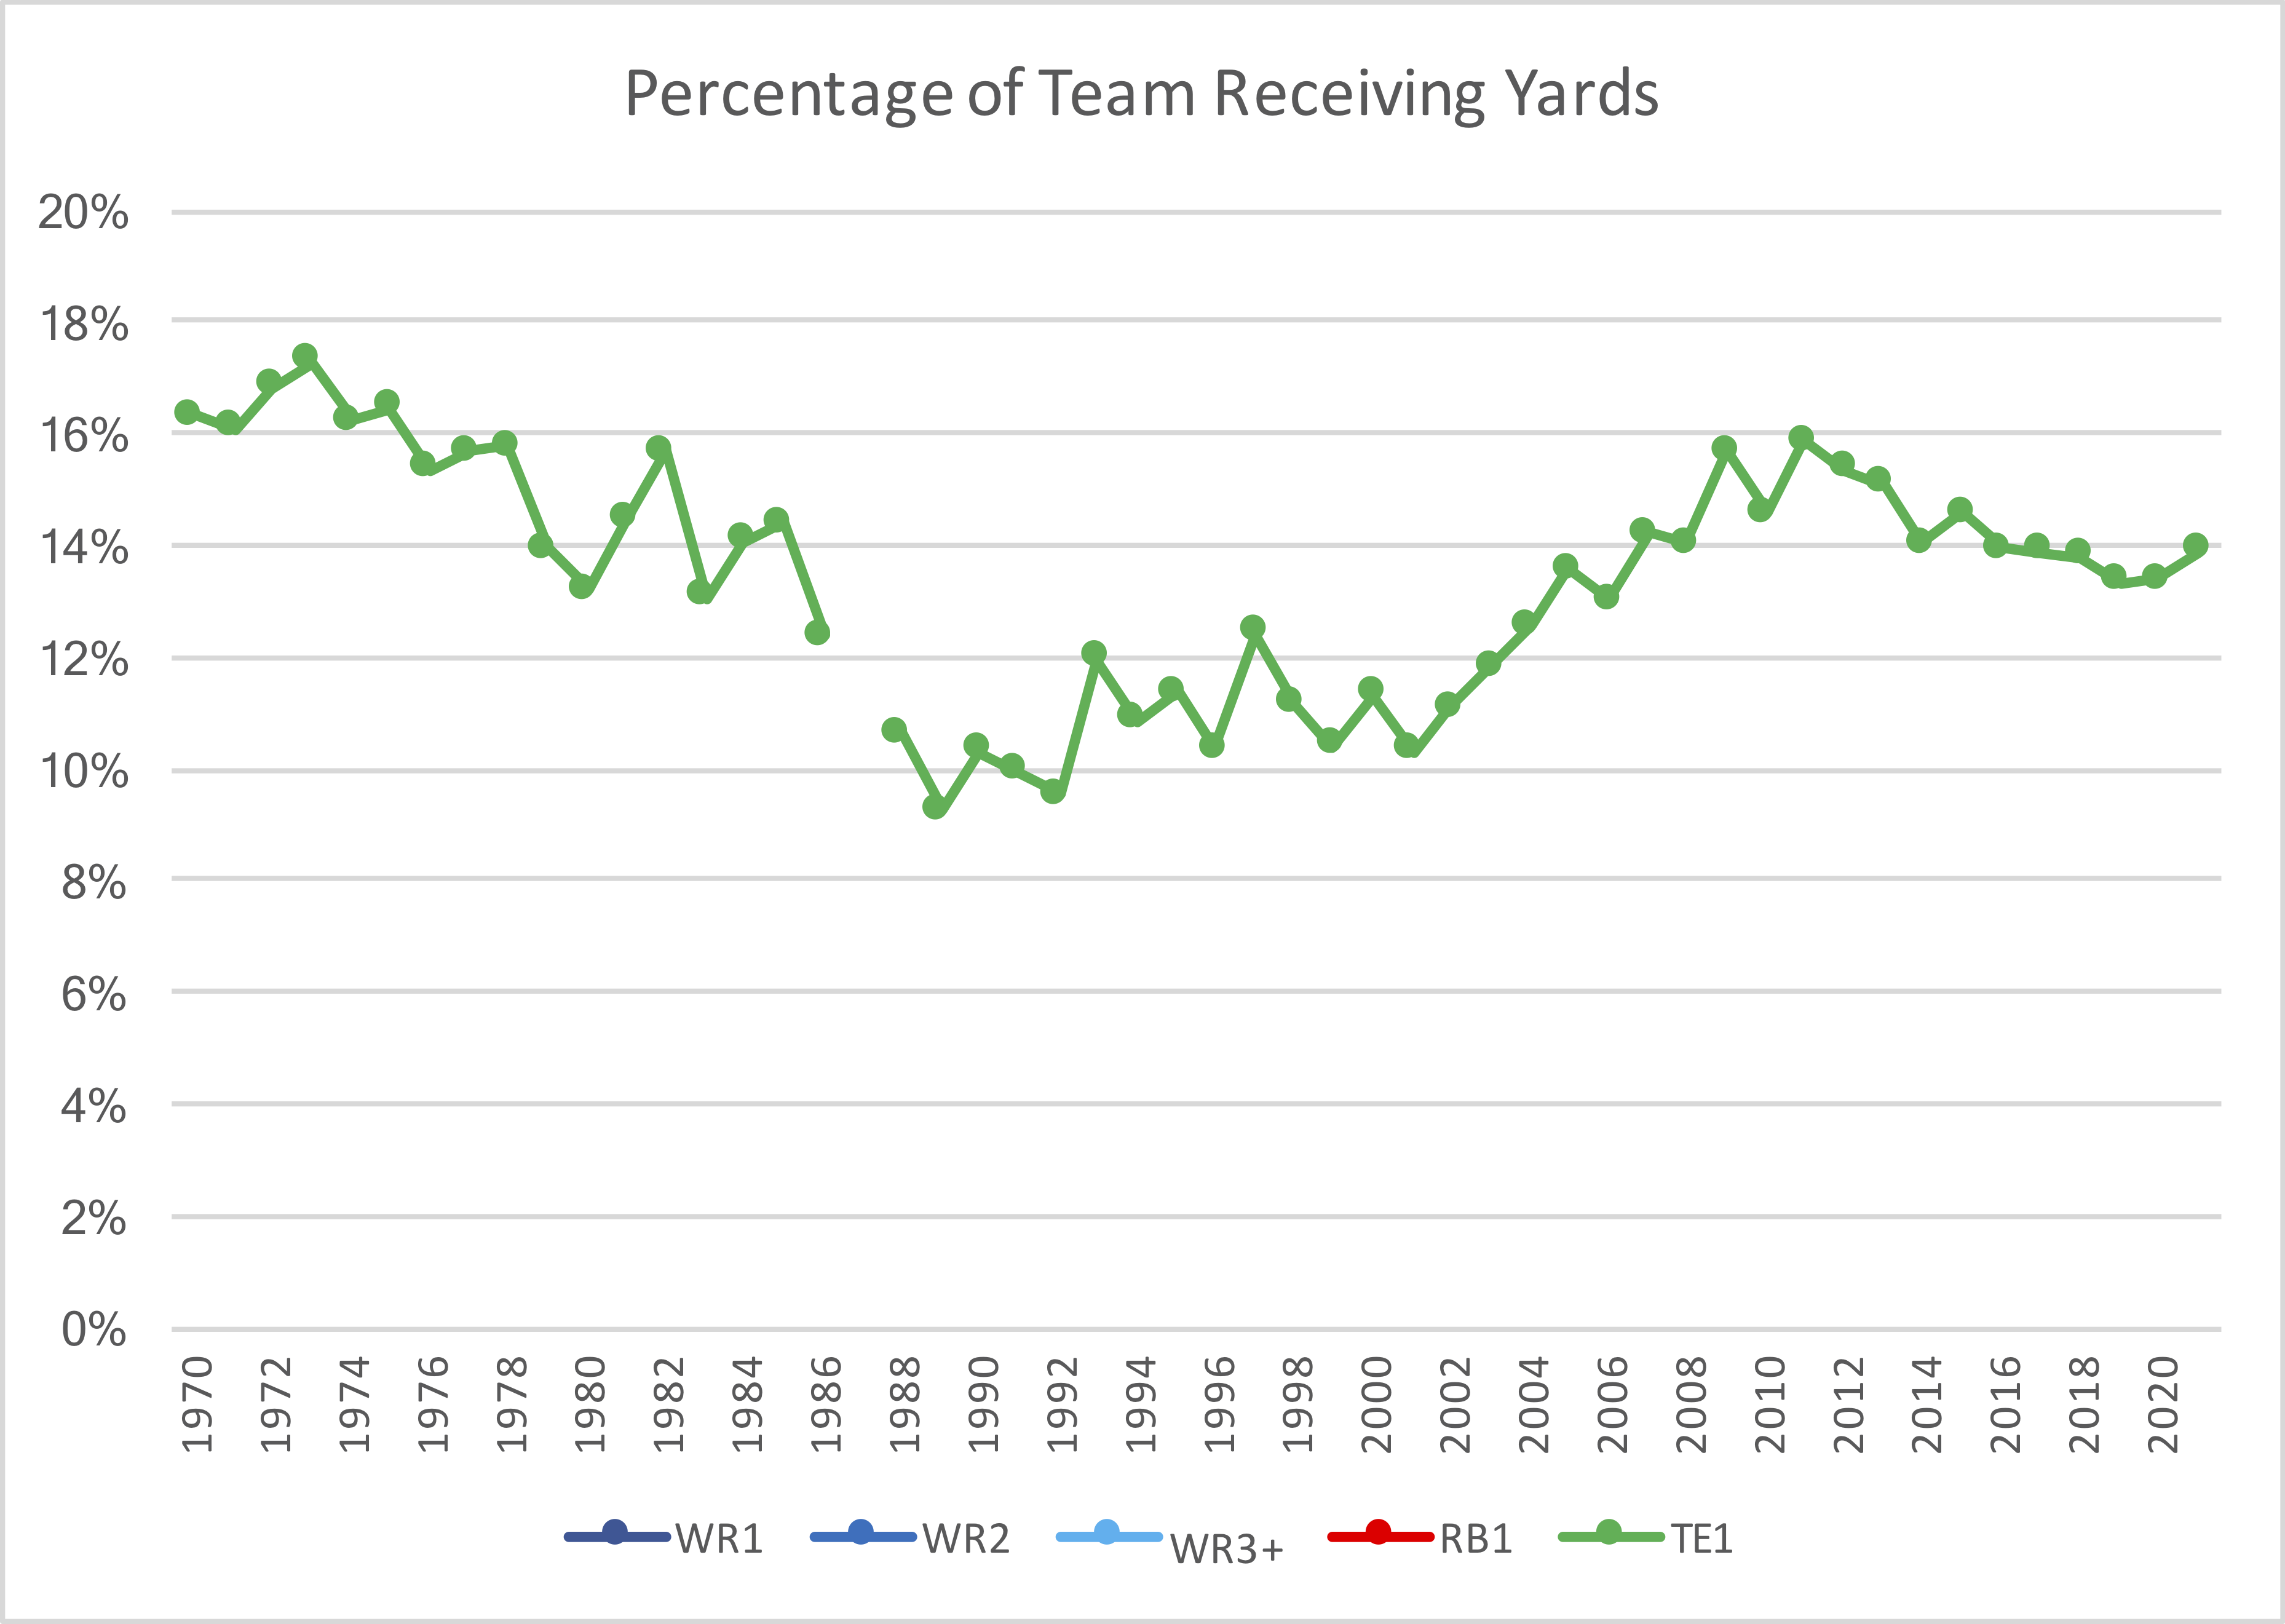
Tight End 1
This graph looks at just the top tight end on each team. In the early ’70s, this was a big part of the passing game as most teams did not use a slot receiver. In the 1990s, teams did use more wide receivers — the Run-N-Shoot offense was around and teams generally relied on a third receiver more frequently. This resulted in a reduced role for tight ends while the fullback position was still in existence. Now, the tight end is a big part of the modern game, and way up from where things were in the 1990s. But on a relative basis, the tight end is still a less meaningful part of the passing game than it was in the 1970s.
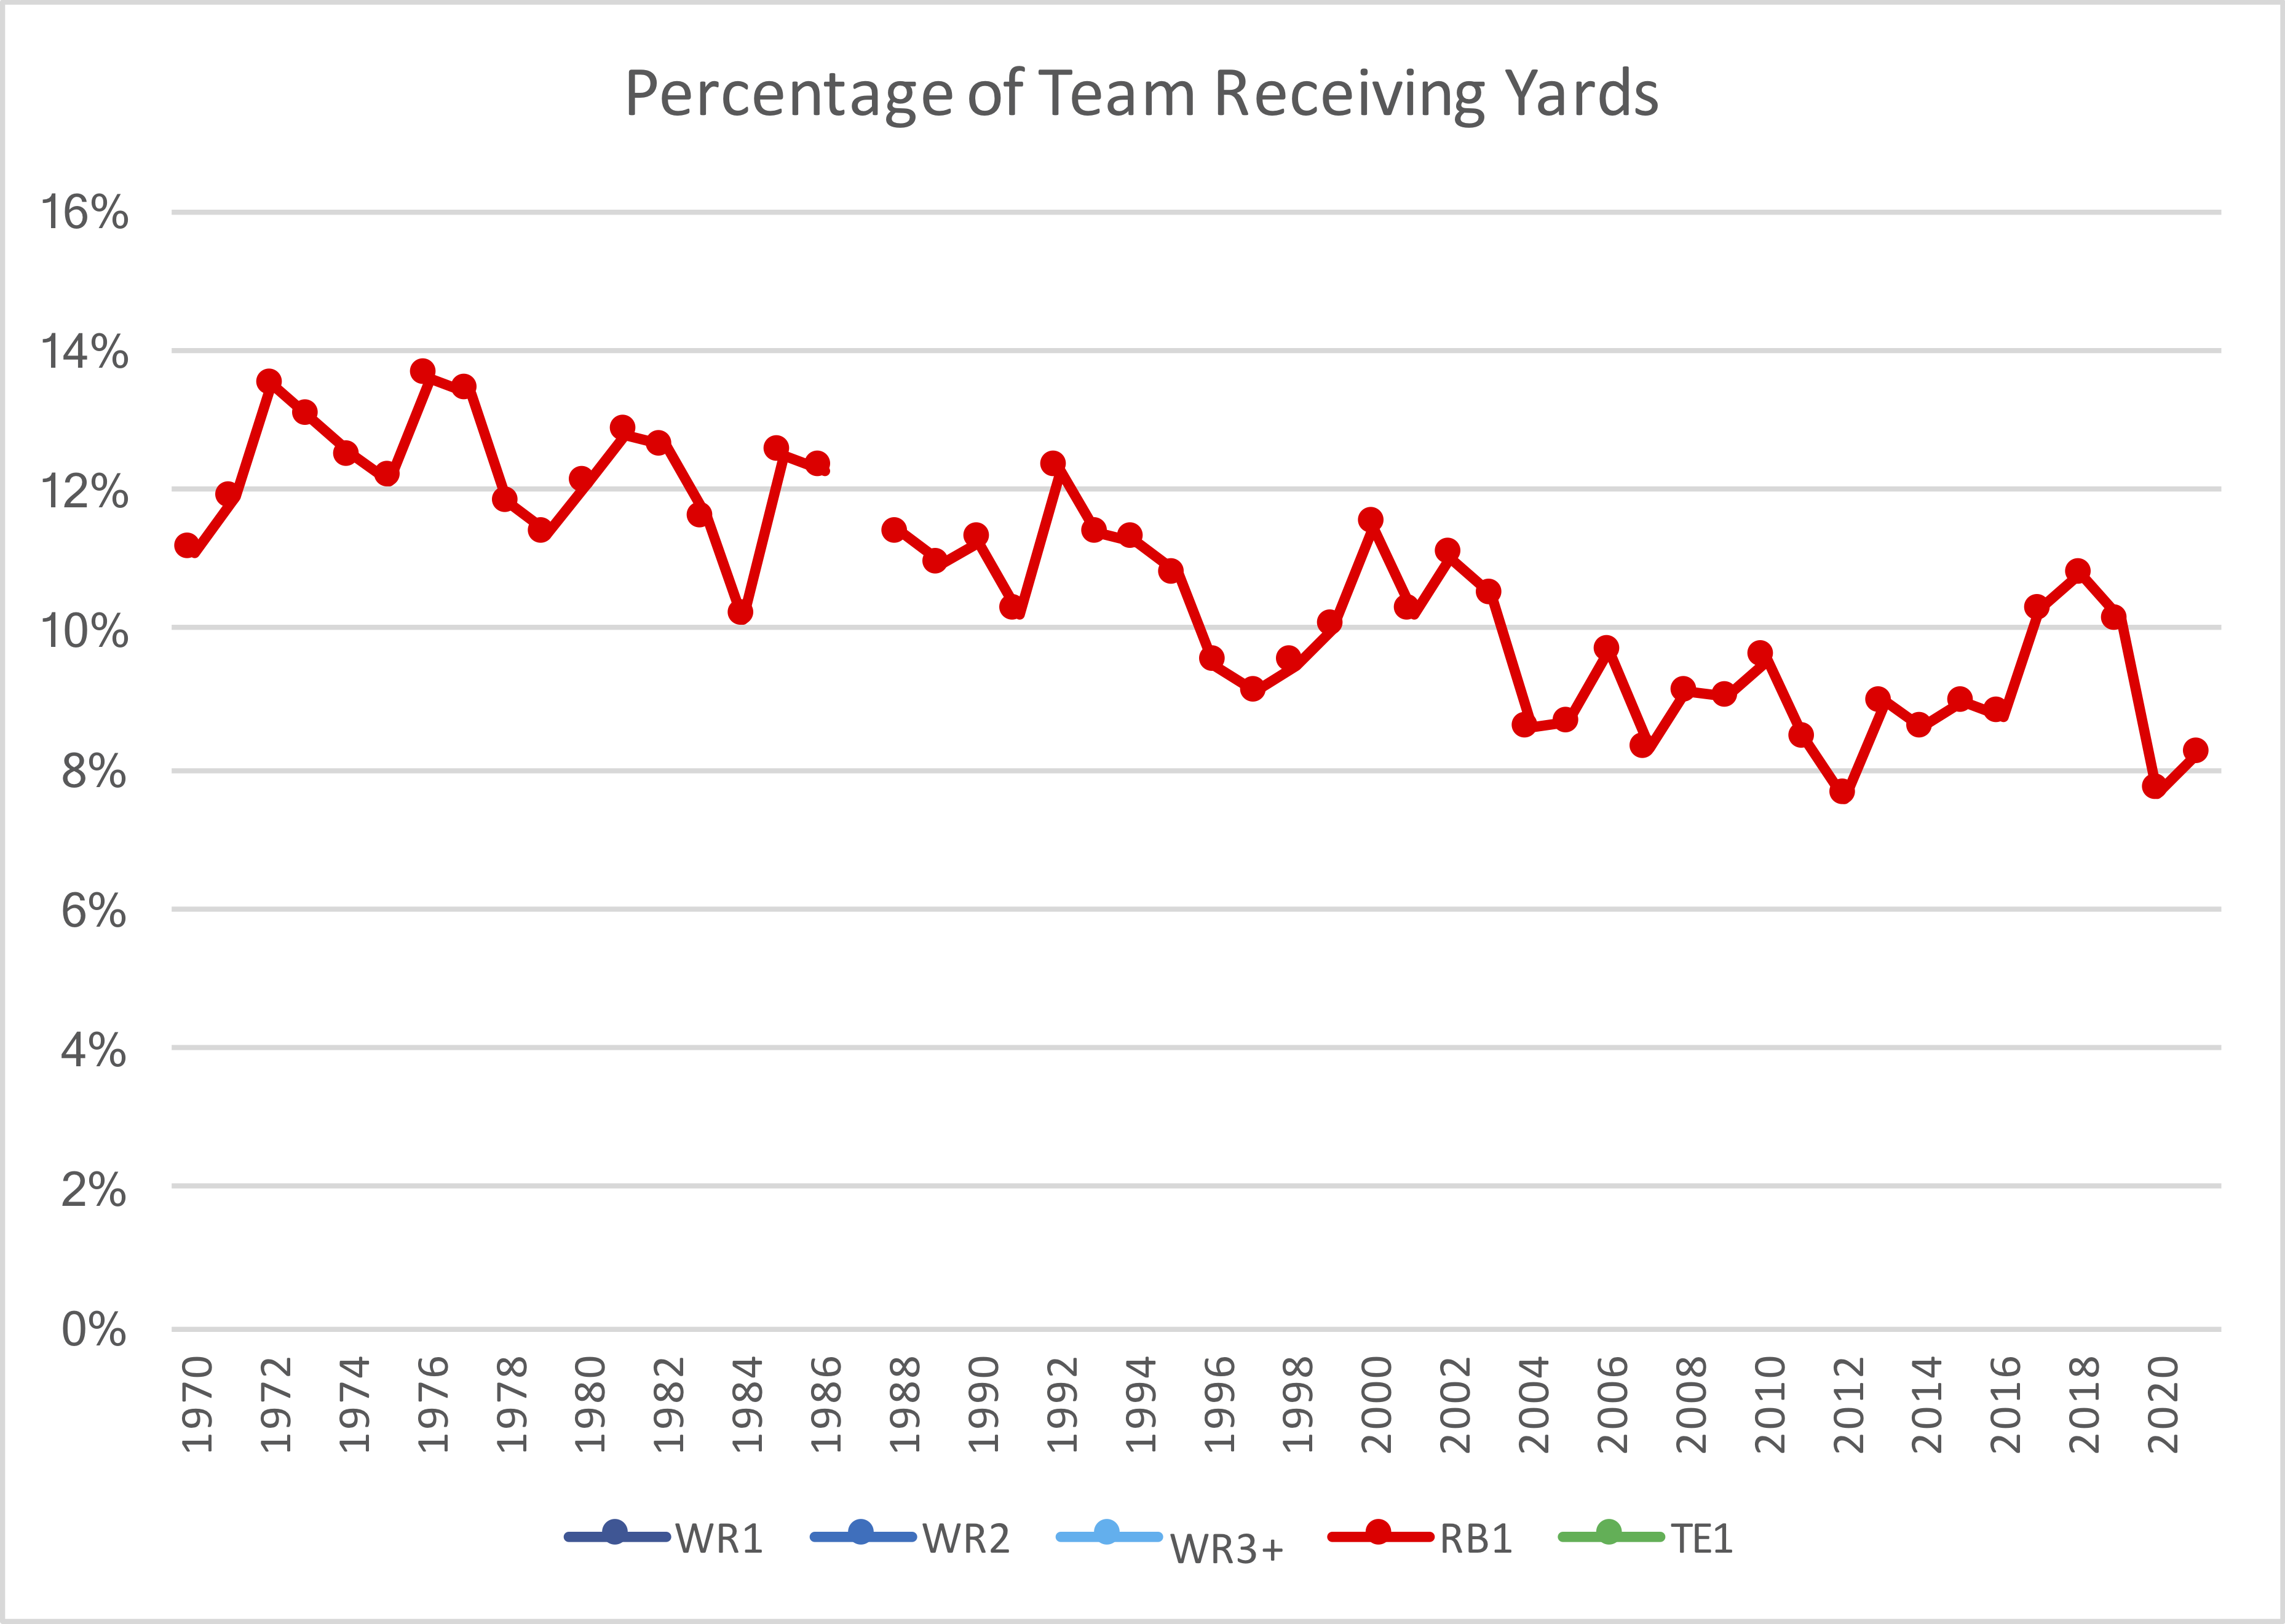
Running Back 1
This graph looks at the top receiving running back for each team, averaged across the league in each season. Sometimes that RB1 was a fullback, but those players have been replaced by slot receivers. And while this chart looks at yards and not receptions, consider that the ’77 Colts had two running backs (Lydell Mitchell and Don McCauley) lead the team in receptions. Two running backs simply aren’t on the field at the same time very often in today’s game. As for why RB1 production has been declining, I believe it’s part of the same general trend where teams are spreading it around more frequently. There is a hugely negative correlation between the WR3+ lines and the RB1 line.
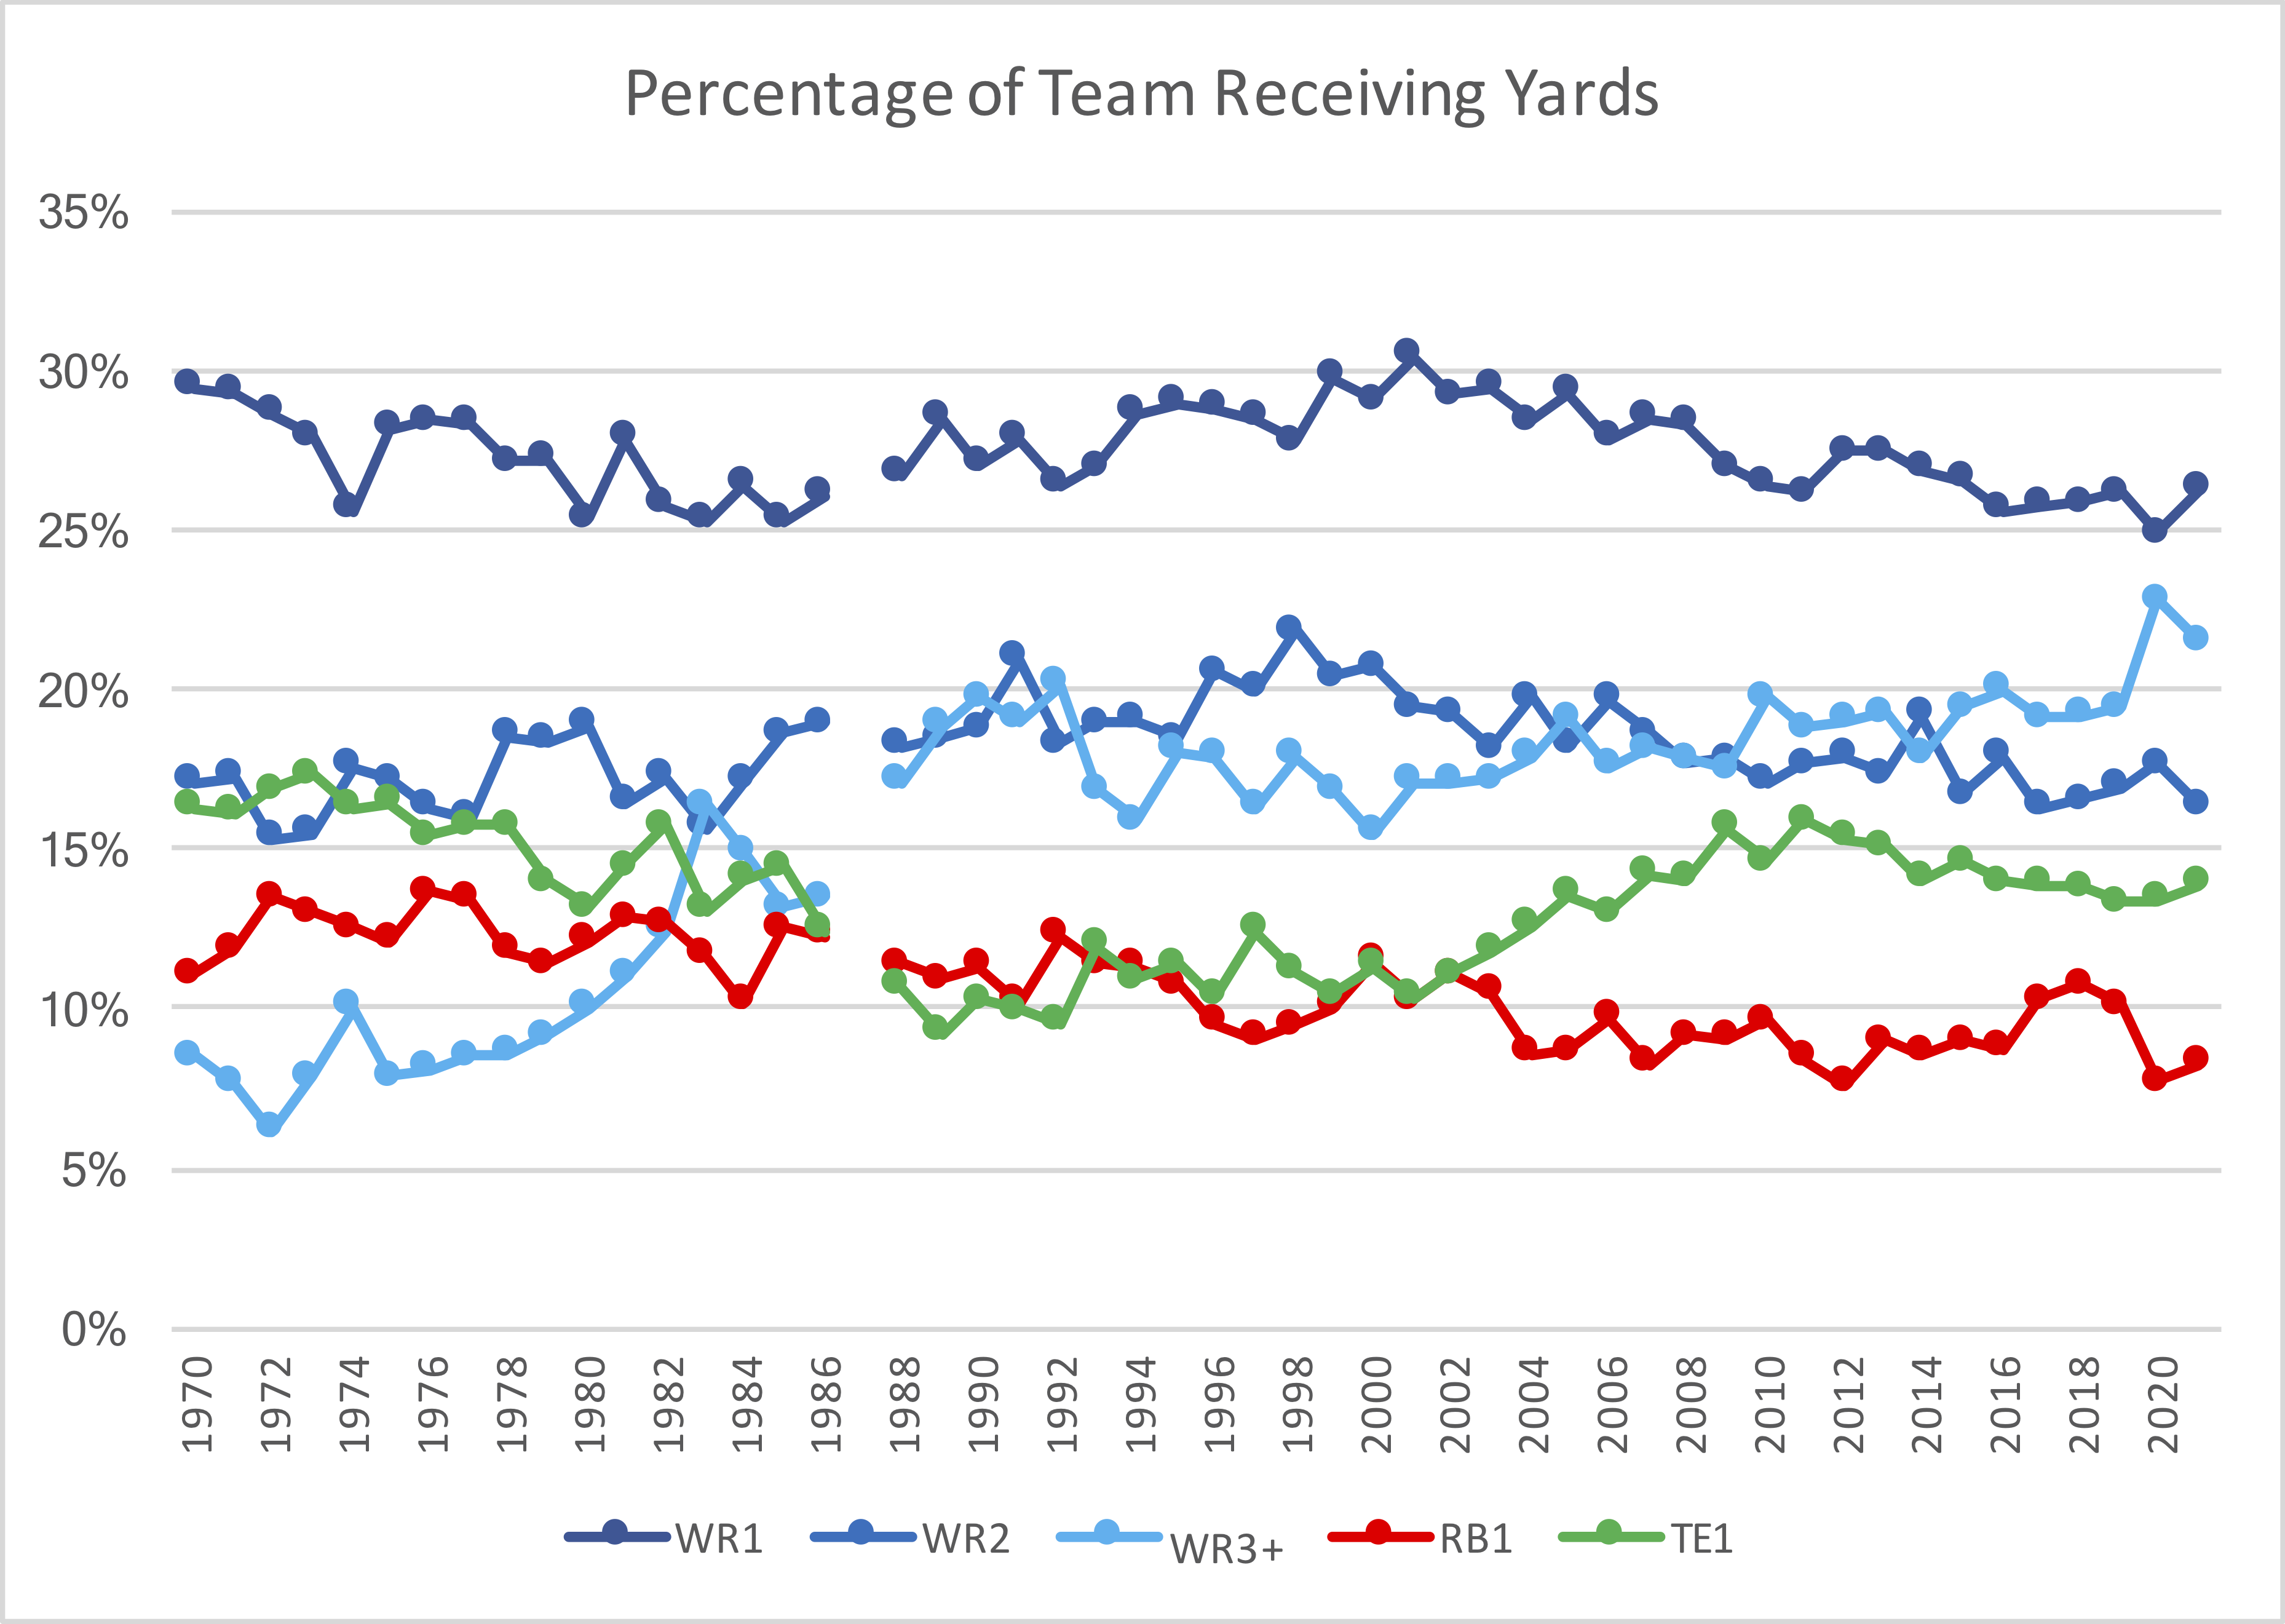
All In One Chart
Finally, here are all five lines in one chart.
As always, please leave your thoughts in the comments.
References
| ↑1 | It is not lost on me that NFL history is not linear, and in many ways, the 1960s is more similar to the 1980s than the 1970s. That said, out of laziness, I only went back to 1970. |
|---|---|
| ↑2 | Some caveats: Obviously many players straddle the line across multiple positions. There are some judgment calls involved with H-Backs, tight ends turned wide receivers, running backs turned tight ends, etc. I did my best to make the appropriate call in each case. Note also that for this article, I’ve eliminated all players who ended the season with negative receiving yards, and am only looking at receiving yards by running backs (which includes fullbacks), receivers and tight ends. |