
Ed Feng of The Power Rank has contributed today’s post. As always, we thank our guest contributors for their hard work.
Before Super Bowl XXV, Bill Belichick had a plan. The Giants defensive coordinator wanted his defense to let Bills running back Thurman Thomas rush for 100 yards.
The Giants defense was appalled. They prided themselves on a tough, physical brand of defense.
Nevertheless, the short, stout coach looked up into the eyes of Lawrence Taylor and Pepper Johnson and said, “You guys have to believe me. If Thomas rushes for a hundred yards, we win this game.”
In case his defense didn’t listen, Belichick took it upon himself to make sure Thomas got his yards. He took out a lineman and linebacker for two extra defensive backs, playing a 2-3-6 defense.
Did Belichick go insane? I thought so when I first read this story in David Halberstam’s book Education of a Coach.
However, Belichick’s strategy has analytics on its side. Let me explain. [Editor’s note: See also this article by Chase about Super Bowl XXV.]
Passing versus rushing in the NFL
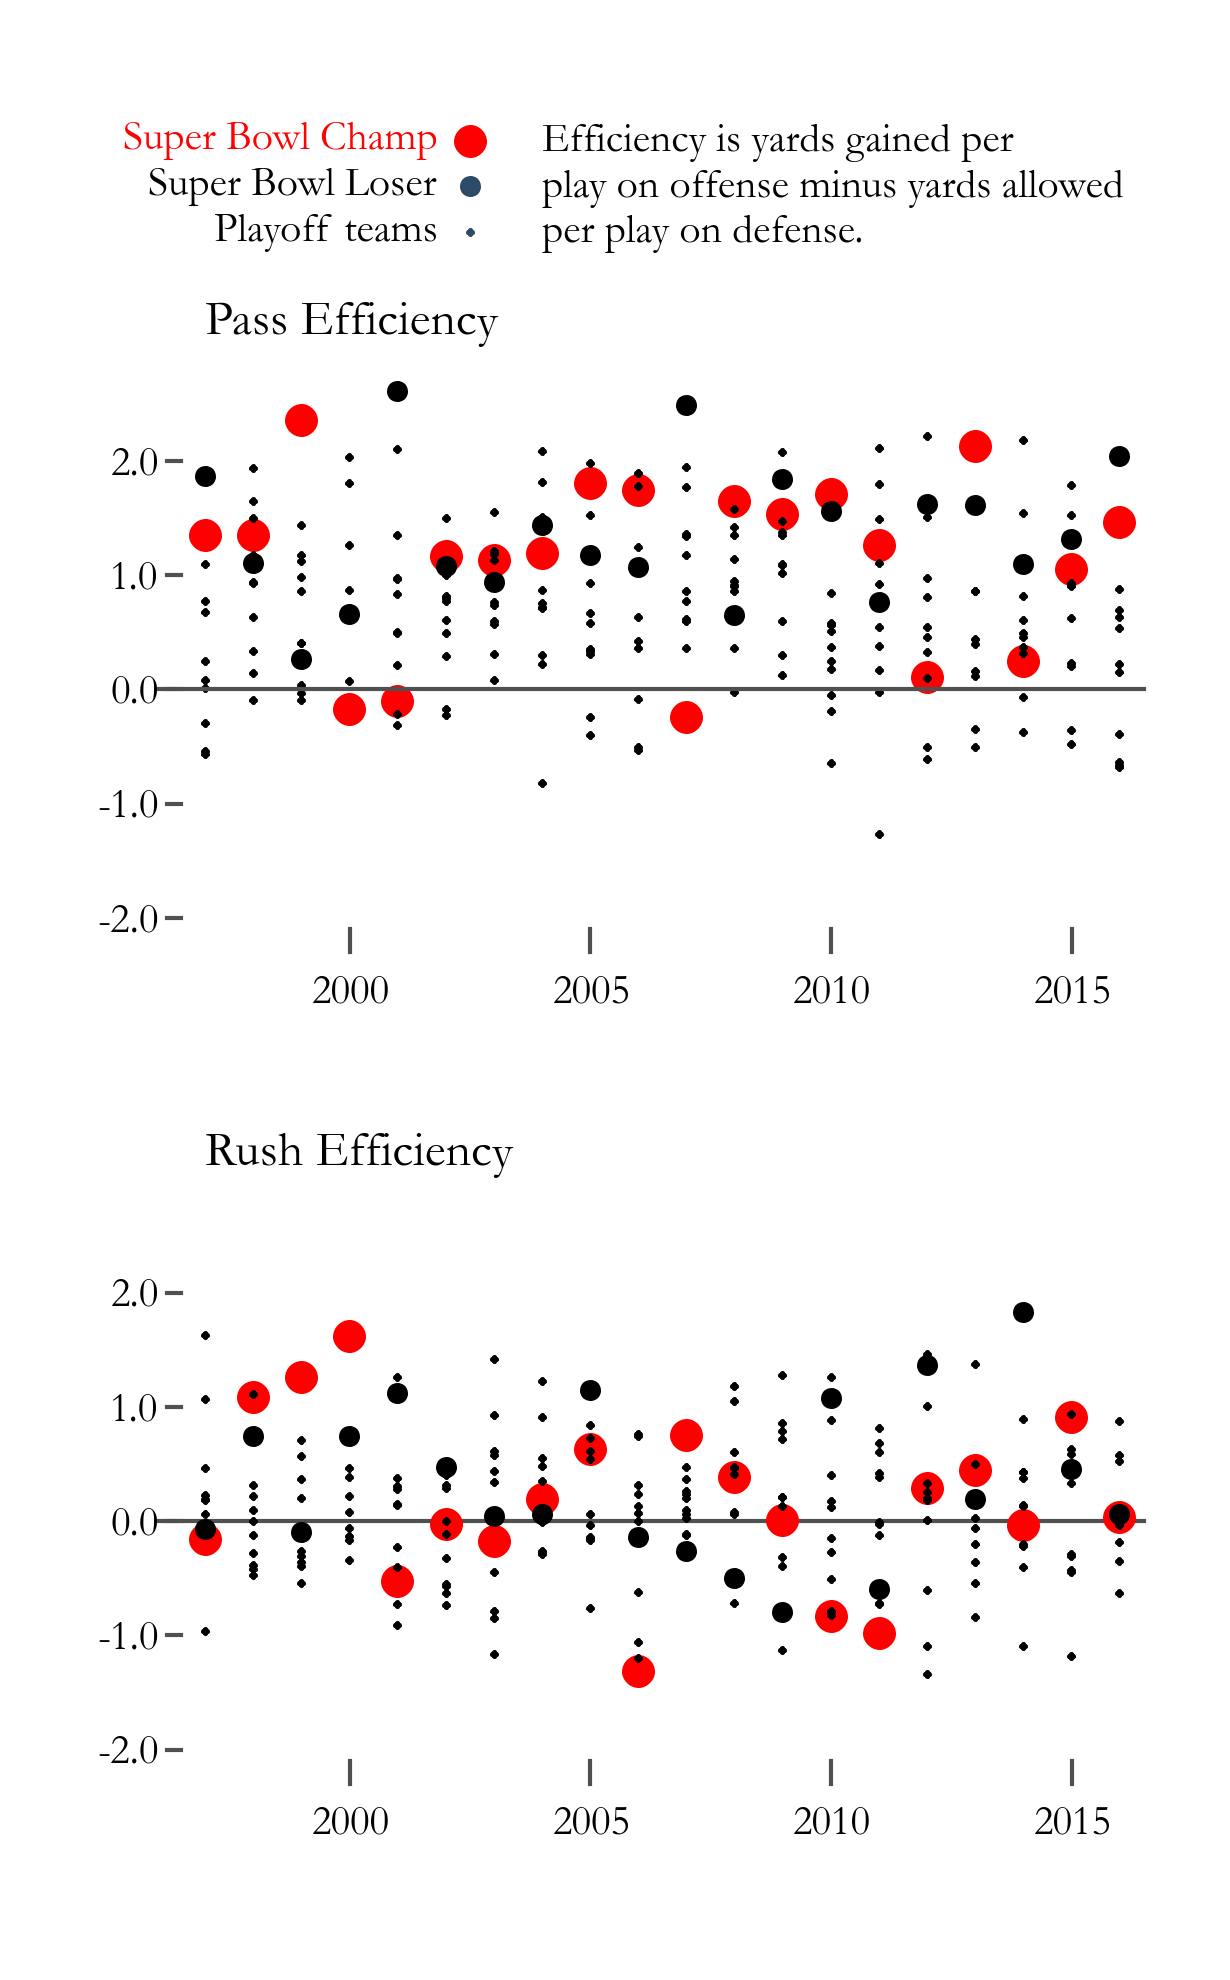
To break down Belichick’s strategy, we’ll look a team efficiency by yards per play. Teams that excel at running the ball will gain more yards per carry on offense than they allow on defense.
Hence, team rush efficiency is defined as yards per carry gained on offense minus yards per carry allowed on defense. Teams with good rush efficiency will have large, positive values. Teams that struggle in the run game will have negative values.
From 1997 through 2016, 57% of playoff teams (138 of 240) had a positive team rush efficiency. The bottom panel of the visual below shows playoff teams as a random scatter of positive and negative points.
Let’s compare this with passing. We’ll define team pass efficiency as the difference in yards per pass attempt on offense minus defense. These plays include sacks.
Over the same twenty year period, 84.6% of playoff teams (203 of 240) had a positive team pass efficiency, a much higher rate than for rushing.
The data suggests the insignificance of rushing in the NFL compared to passing. [Editor’s note: Or, at least, the insignificance of yards per carry to measure the value of running.]
Yards per play isn’t the perfect statistic to measure rush efficiency. Teams that excel in pass efficiency will tend to have leads late in games. In these late game situations, they will run the ball to take time off the clock. The defense expects the run, which should lower their rush efficiency.
From 2012 through 2016, teams up 7 or more points in the 4th quarter rushed for 3.29 yards per carry, below the NFL average of 4.18 (data from Pro Football Reference). While this hurts the rush efficiency of good teams, these carries only make up 12% of all carries during this period.
Excluding these late game carries would not change the main claim about the insignificance of rushing compared to passing in the NFL.
Let’s look at passing and rushing efficiency for playoff teams in 2017.
The 2017 season
Of the 12 playoff teams, 7 had a positive team rush efficiency during the regular season. This 58% rate matches the historical trend over the previous 20 years.
Of these 12 playoff teams, New England (26th) and Pittsburgh (29th) had the two worst team rush efficiencies. Many considered these two teams the primary Super Bowl contenders when the playoffs started.
In addition, Cleveland had the best team rush efficiency by a wide margin over Philadelphia in 2017. The Browns didn’t win a game.
How about passing? 11 of 12 playoff teams had a positive team pass efficiency for a rate of 91.7%. Only Buffalo, a team that gutted its roster over the last year and hadn’t made the playoffs since the 1999 season, allowed more yards per pass attempt than they gained.
Let’s dig further into this season’s rushing numbers. These rankings show the 12 playoff teams in terms of yards gained per carry on offense (data includes playoff games).
1. Kansas City, 4.68
3. New Orleans, 4.47
6. Los Angeles Rams, 4.40
7. Philadelphia, 4.34
8. Tennessee, 4.29
9. Carolina, 4.28
10. Jacksonville, 4.27
12. Atlanta, 4.21
14. Buffalo, 4.14
15. New England, 4.12
23. Minnesota, 3.87
25. Pittsburgh, 3.85
Despite the difficulty in running the ball while up late in the game, 10 of 12 playoff teams were better than NFL average.
However, playoff teams really struggled to defend the run this season. In terms of yards per carry, here are the ranks of the 12 playoff teams.
4. Tennessee, 3.60
5. Minnesota, 3.65
7. Philadelphia, 3.79
9. Carolina, 3.87
21. Atlanta, 4.17
23. Jacksonville, 4.26
25. Buffalo, 4.30
26. New Orleans, 4.31
27. Kansas City, 4.41
28. Pittsburgh, 4.42
30. Los Angeles Rams, 4.56
31. New England, 4.57
8 of 12 playoff teams were 21st or worse in rush defense by yards per carry. New England, who will face Philadelphia in the Super Bowl, is the worst of these playoff teams.
How Belichick will defend Philadelphia
In Super Bowl XXV, Thurman Thomas got his yards. The Bills running back rushed for 135 yards on 15 carries for an amazing 9 yards per carry.
However, the Giants won the game 20-19 when a last minute field goal attempt sailed wide. Belichick opted to let Thomas get his yards instead of allowing Jim Kelly to throw the ball. Despite a 31 yard touchdown run from Thomas, he knew focusing on pass defense gave the Giants the best chance of winning.
Belichick has used a 2-3-6 type defense more recently. Against Peyton Manning in 2013, he put extra defensive backs on the field. Manning checked down to run plays, and Denver ran for 5.83 yards per carry compared to 3.47 yards per pass attempt. New England made a furious comeback to win 34-31 in overtime.
However, I doubt we’ll see this in the Super Bowl. While Nick Foles has played well in the playoffs, he doesn’t demand the same respect as Peyton Manning.
Ed Feng is the founder of The Power Rank. To get a free booklet with his full manifesto on passing and rushing in the NFL, click here.