
In week 1, records were set for the most passing touchdowns (63) and team passing yards (8143) thrown in a single week in league history. Is this a sign that 2013 will represent the next stage in the evolution in the passing game, or are offenses typically ahead of defenses early on?
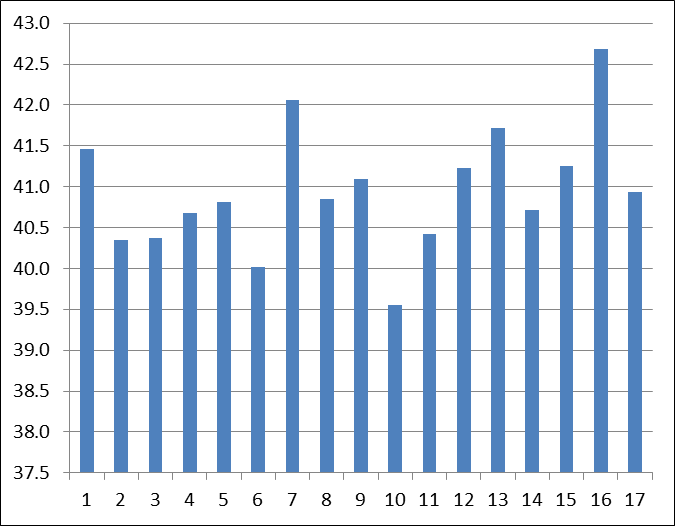
To compare week 1 of this season to other weeks in NFL history, we need to examine all statistics on a per team game basis to account for bye weeks and number of teams. But after calculating the per team game numbers, I multiplied the result by 32 to make the numbers easier to digest. The first graph shows the average number of passing touchdowns in week N of each season since 1970. As you can see, week 1 doesn’t stand out as typically being passer-friendly. On average, there were roughly 41.5 touchdowns per team game (after multiplying by 32) in week 1 of each season from 1970 to 2012, which is nearly identical to the average (40.9) the rest of the year:
Here’s the same information for passing yards:

Week 1 does look low here (6,231 vs. 6,340 in the other weeks) but that’s a product of era: the expanding league schedule has come as passing yards have exploded. To control for this, I then compared “Week 1” production to “Rest of Year” production for each statistic. That’s a bit difficult to put on one graph, but I did my best. Here is the one for passing touchdowns, with “Week 1” TDs in red and “Rest of Year” touchdowns in blue.

Sometimes, week 1 sees more touchdowns than normal, but just as often the opposite is true. What about passing yards?

Again, I don’t see any evidence to indicate that “Week 1 passing numbers” are typically high. In other words, having a bunch of 350-yard passers may be the new normal.
But don’t crown week 1, 2013, as the best passing week of all time. Because on a per-team game basis, week 10, 2010, is still the winner. Four teams were on bye that week, but the other 28 teams threw 56 touchdowns and 7,735 yards, numbers that prorate to 64/8840 on a per-32 team game basis. Here’s a list of every passer from that week:
| Passing | ||||||||||||||||||||
|---|---|---|---|---|---|---|---|---|---|---|---|---|---|---|---|---|---|---|---|---|
| Rk | Player | Age | Date | Lg | Tm | Opp | Result | G# | W# | Day | Cmp | Att | Yds | TD | Int | |||||
| 1 | Matt Cassel | 28-181 | 2010-11-14 | NFL | KAN | @ | DEN | L 29-49 | 9 | 10 | Sun | 33 | 53 | 62.26% | 469 | 4 | 0 | 116.0 | 8.85 | 10.36 |
| 2 | Ben Roethlisberger | 28-257 | 2010-11-14 | NFL | PIT | NWE | L 26-39 | 9 | 10 | Sun | 30 | 49 | 61.22% | 387 | 3 | 1 | 97.9 | 7.90 | 8.20 | |
| 3 | Eli Manning | 29-315 | 2010-11-14 | NFL | NYG | DAL | L 20-33 | 9 | 10 | Sun | 33 | 48 | 68.75% | 373 | 2 | 2 | 88.3 | 7.77 | 6.73 | |
| 4 | Troy Smith | 26-117 | 2010-11-14 | NFL | SFO | STL | W 23-20 | 9 | 10 | Sun | 17 | 28 | 60.71% | 356 | 1 | 0 | 116.7 | 12.71 | 13.43 | |
| 5 | Tom Brady | 33-103 | 2010-11-14 | NFL | NWE | @ | PIT | W 39-26 | 9 | 10 | Sun | 30 | 43 | 69.77% | 350 | 3 | 0 | 117.4 | 8.14 | 9.53 |
| 6 | David Garrard | 32-273 | 2010-11-14 | NFL | JAX | HOU | W 31-24 | 9 | 10 | Sun | 24 | 31 | 77.42% | 342 | 2 | 0 | 134.1 | 11.03 | 12.32 | |
| 7 | Michael Vick | 30-142 | 2010-11-15 | NFL | PHI | @ | WAS | W 59-28 | 9 | 10 | Mon | 20 | 28 | 71.43% | 333 | 4 | 0 | 150.7 | 11.89 | 14.75 |
| 8 | Matt Hasselbeck | 35-050 | 2010-11-14 | NFL | SEA | @ | ARI | W 36-18 | 9 | 10 | Sun | 22 | 34 | 64.71% | 333 | 1 | 0 | 106.6 | 9.79 | 10.38 |
| 9 | Jon Kitna | 38-054 | 2010-11-14 | NFL | DAL | @ | NYG | W 33-20 | 9 | 10 | Sun | 13 | 22 | 59.09% | 327 | 3 | 1 | 124.1 | 14.86 | 15.55 |
| 10 | Shaun Hill | 30-309 | 2010-11-14 | NFL | DET | @ | BUF | L 12-14 | 9 | 10 | Sun | 29 | 50 | 58.00% | 323 | 1 | 1 | 75.7 | 6.46 | 5.96 |
| 11 | Derek Anderson | 27-152 | 2010-11-14 | NFL | ARI | SEA | L 18-36 | 9 | 10 | Sun | 23 | 45 | 51.11% | 322 | 1 | 1 | 72.6 | 7.16 | 6.60 | |
| 12 | Matt Ryan | 25-178 | 2010-11-11 | NFL | ATL | BAL | W 26-21 | 9 | 10 | Thu | 32 | 50 | 64.00% | 316 | 3 | 0 | 101.7 | 6.32 | 7.52 | |
| 13 | Matt Schaub | 29-142 | 2010-11-14 | NFL | HOU | @ | JAX | L 24-31 | 9 | 10 | Sun | 22 | 32 | 68.75% | 314 | 2 | 0 | 121.1 | 9.81 | 11.06 |
| 14 | Mark Sanchez | 24-003 | 2010-11-14 | NFL | NYJ | @ | CLE | W 26-20 | 9 | 10 | Sun | 27 | 44 | 61.36% | 299 | 2 | 1 | 87.2 | 6.80 | 6.68 |
| 15 | Kyle Orton | 28-000 | 2010-11-14 | NFL | DEN | KAN | W 49-29 | 9 | 10 | Sun | 22 | 34 | 64.71% | 296 | 4 | 0 | 131.5 | 8.71 | 11.06 | |
| 16 | Donovan McNabb | 33-355 | 2010-11-15 | NFL | WAS | PHI | L 28-59 | 9 | 10 | Mon | 17 | 31 | 54.84% | 295 | 2 | 3 | 69.4 | 9.52 | 6.45 | |
| 17 | Carson Palmer | 30-322 | 2010-11-14 | NFL | CIN | @ | IND | L 17-23 | 9 | 10 | Sun | 31 | 42 | 73.81% | 292 | 2 | 3 | 78.7 | 6.95 | 4.69 |
| 18 | Sam Bradford | 23-006 | 2010-11-14 | NFL | STL | @ | SFO | L 20-23 | 9 | 10 | Sun | 30 | 42 | 71.43% | 251 | 1 | 0 | 94.4 | 5.98 | 6.45 |
| 19 | Josh Freeman | 22-305 | 2010-11-14 | NFL | TAM | CAR | W 31-16 | 9 | 10 | Sun | 18 | 24 | 75.00% | 241 | 2 | 0 | 134.2 | 10.04 | 11.71 | |
| 20 | Chad Henne | 25-135 | 2010-11-14 | NFL | MIA | TEN | W 29-17 | 9 | 10 | Sun | 19 | 28 | 67.86% | 240 | 1 | 1 | 91.4 | 8.57 | 7.68 | |
| 21 | Jay Cutler | 27-199 | 2010-11-14 | NFL | CHI | MIN | W 27-13 | 9 | 10 | Sun | 22 | 35 | 62.86% | 237 | 3 | 2 | 87.4 | 6.77 | 5.91 | |
| 22 | Joe Flacco | 25-299 | 2010-11-11 | NFL | BAL | @ | ATL | L 21-26 | 9 | 10 | Thu | 22 | 34 | 64.71% | 215 | 3 | 1 | 99.5 | 6.32 | 6.76 |
| 23 | Colt McCoy | 23-070 | 2010-11-14 | NFL | CLE | NYJ | L 20-26 | 9 | 10 | Sun | 18 | 31 | 58.06% | 205 | 1 | 0 | 88.8 | 6.61 | 7.26 | |
| 24 | Jimmy Clausen | 23-054 | 2010-11-14 | NFL | CAR | @ | TAM | L 16-31 | 9 | 10 | Sun | 16 | 29 | 55.17% | 191 | 0 | 0 | 75.5 | 6.59 | 6.59 |
| 25 | Peyton Manning | 34-235 | 2010-11-14 | NFL | IND | CIN | W 23-17 | 9 | 10 | Sun | 20 | 36 | 55.56% | 185 | 0 | 0 | 69.8 | 5.14 | 5.14 | |
| 26 | Brett Favre | 41-035 | 2010-11-14 | NFL | MIN | @ | CHI | L 13-27 | 9 | 10 | Sun | 18 | 31 | 58.06% | 170 | 1 | 3 | 44.5 | 5.48 | 1.77 |
| 27 | Ryan Fitzpatrick | 27-355 | 2010-11-14 | NFL | BUF | DET | W 14-12 | 9 | 10 | Sun | 12 | 24 | 50.00% | 146 | 1 | 0 | 83.0 | 6.08 | 6.92 | |
| 28 | Vince Young | 27-180 | 2010-11-14 | NFL | TEN | @ | MIA | L 17-29 | 9 | 10 | Sun | 9 | 18 | 50.00% | 92 | 1 | 1 | 60.4 | 5.11 | 3.72 |
| 29 | Tyler Thigpen | 26-214 | 2010-11-14 | NFL | MIA | TEN | W 29-17 | 9 | 10 | Sun | 4 | 6 | 66.67% | 64 | 1 | 0 | 141.7 | 10.67 | 14.00 | |
| 30 | Charlie Whitehurst | 28-100 | 2010-11-14 | NFL | SEA | @ | ARI | W 36-18 | 9 | 10 | Sun | 4 | 6 | 66.67% | 53 | 0 | 1 | 54.9 | 8.83 | 1.33 |
| 31 | Kerry Collins | 37-319 | 2010-11-14 | NFL | TEN | @ | MIA | L 17-29 | 9 | 10 | Sun | 9 | 20 | 45.00% | 51 | 0 | 0 | 52.1 | 2.55 | 2.55 |
| 32 | Chad Pennington | 34-141 | 2010-11-14 | NFL | MIA | TEN | W 29-17 | 9 | 10 | Sun | 1 | 2 | 50.00% | 19 | 0 | 0 | 83.3 | 9.50 | 9.50 | |
| 33 | Tim Tebow | 23-092 | 2010-11-14 | NFL | DEN | KAN | W 49-29 | 9 | 10 | Sun | 1 | 1 | 100.00% | 3 | 1 | 0 | 118.7 | 3.00 | 23.00 | |