
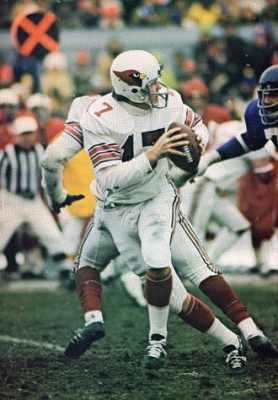
Hart had a great career, but was still developing in ’68
Teams that are below-average at passing and stopping the pass are usually not very good. In the Super Bowl era, each additional yard of ANY/A (on either offense or defense) relative to league average increases a team’s winning percentage by about nine percent. The Cardinals, at -0.5 Relative ANY/A on offense and -1.7 RANY/A on defense, would therefore be expected to win about 30% of their games. Instead, the Cards won 68% of games, going 9-4-1.
The table below shows the 100 teams of the Super Bowl era that have most exceeded expectations based on Offensive and Defensive RANY/A. In general, using ANY/A and RANY/A will get you most of the way there with a team’s record, but not for these teams. The Cardinals had an Off RANY/A of -0.52, a Def RANY/A of -1.72, and therefore, an expected winning percentage of 0.296. By having an actual winning percentage of 0.679, the Cardinals exceeded expectations by 6.1 wins per 16 games.
| Rk | Team | Year | Off RANY/A | Def RANY/A | Exp Win % | Win % | Diff |
|---|---|---|---|---|---|---|---|
| 1 | St. Louis Cardinals | 1968 | -0.52 | -1.72 | 0.296 | 0.679 | 6.1 |
| 2 | Buffalo Bills | 1973 | -2.05 | -0.43 | 0.276 | 0.643 | 5.9 |
| 3 | Chicago Bears | 1968 | -1.91 | -2.03 | 0.141 | 0.500 | 5.7 |
| 4 | Philadelphia Eagles | 1966 | -1.41 | -0.37 | 0.340 | 0.643 | 4.8 |
| 5 | Cleveland Browns | 1973 | -1.98 | -0.56 | 0.271 | 0.571 | 4.8 |
| 6 | New York Giants | 1986 | 0.03 | 0.79 | 0.578 | 0.875 | 4.8 |
| 7 | Los Angeles Raiders | 1982 | 0.35 | 0.65 | 0.593 | 0.889 | 4.7 |
| 8 | Chicago Bears | 2001 | -0.36 | 0.57 | 0.522 | 0.813 | 4.7 |
| 9 | Tennessee Titans | 1999 | 0.91 | -0.54 | 0.534 | 0.813 | 4.5 |
| 10 | Miami Dolphins | 1981 | -0.14 | -0.45 | 0.447 | 0.719 | 4.3 |
| 11 | Atlanta Falcons | 2004 | -1.16 | 0.23 | 0.419 | 0.688 | 4.3 |
| 12 | Indianapolis Colts | 2012 | -0.29 | -0.61 | 0.420 | 0.688 | 4.3 |
| 13 | Houston Oilers | 1967 | -1.97 | 0.98 | 0.414 | 0.679 | 4.2 |
| 14 | Los Angeles Raiders | 1985 | -0.37 | 0.22 | 0.489 | 0.750 | 4.2 |
| 15 | Cleveland Browns | 1972 | -0.65 | 0.17 | 0.458 | 0.714 | 4.1 |
| 16 | Dallas Cowboys | 1972 | -0.19 | -0.26 | 0.460 | 0.714 | 4.1 |
| 17 | Denver Broncos | 1984 | -0.04 | 0.72 | 0.565 | 0.813 | 4.0 |
| 18 | Kansas City Chiefs | 1997 | 0.25 | 0.50 | 0.571 | 0.813 | 3.9 |
| 19 | Chicago Bears | 1987 | -0.47 | 0.37 | 0.493 | 0.733 | 3.8 |
| 20 | Pittsburgh Steelers | 2004 | 0.80 | 1.33 | 0.697 | 0.938 | 3.8 |
| 21 | Detroit Lions | 1991 | -0.20 | 0.31 | 0.512 | 0.750 | 3.8 |
| 22 | Miami Dolphins | 1970 | 0.03 | -0.25 | 0.481 | 0.714 | 3.7 |
| 23 | Baltimore Colts | 1978 | -1.59 | -2.99 | 0.081 | 0.313 | 3.7 |
| 24 | Atlanta Falcons | 1998 | 1.55 | 0.02 | 0.644 | 0.875 | 3.7 |
| 25 | Baltimore Colts | 1969 | 0.05 | -1.38 | 0.379 | 0.607 | 3.7 |
| 26 | Minnesota Vikings | 2012 | -0.94 | -0.19 | 0.399 | 0.625 | 3.6 |
| 27 | Minnesota Vikings | 2015 | -0.65 | 0.21 | 0.463 | 0.688 | 3.6 |
| 28 | New York Jets | 1986 | 0.61 | -1.68 | 0.402 | 0.625 | 3.6 |
| 29 | Atlanta Falcons | 2010 | 0.47 | 0.50 | 0.590 | 0.813 | 3.6 |
| 30 | New England Patriots | 1976 | -0.39 | 1.05 | 0.564 | 0.786 | 3.6 |
| 31 | Oakland Raiders | 1977 | 0.61 | 0.08 | 0.565 | 0.786 | 3.5 |
| 32 | Chicago Bears | 1986 | -0.69 | 2.33 | 0.655 | 0.875 | 3.5 |
| 33 | Jacksonville Jaguars | 1999 | 0.63 | 1.04 | 0.655 | 0.875 | 3.5 |
| 34 | Washington Redskins | 1982 | 1.25 | 0.59 | 0.670 | 0.889 | 3.5 |
| 35 | Indianapolis Colts | 1999 | 1.64 | -0.59 | 0.596 | 0.813 | 3.5 |
| 36 | Dallas Cowboys | 1983 | 0.65 | -0.29 | 0.534 | 0.750 | 3.5 |
| 37 | Kansas City Chiefs | 1995 | 0.00 | 1.02 | 0.597 | 0.813 | 3.4 |
| 38 | Los Angeles Rams | 1984 | -0.65 | -0.35 | 0.410 | 0.625 | 3.4 |
| 39 | Denver Broncos | 1977 | 0.92 | 0.64 | 0.645 | 0.857 | 3.4 |
| 40 | St. Louis Cardinals | 1982 | -0.41 | -1.30 | 0.344 | 0.556 | 3.4 |
| 41 | Philadelphia Eagles | 2003 | 0.23 | 0.19 | 0.541 | 0.750 | 3.3 |
| 42 | Jacksonville Jaguars | 2010 | -0.53 | -1.75 | 0.293 | 0.500 | 3.3 |
| 43 | Denver Broncos | 1998 | 1.73 | 0.09 | 0.668 | 0.875 | 3.3 |
| 44 | Houston Oilers | 1975 | -0.34 | 0.39 | 0.507 | 0.714 | 3.3 |
| 45 | Denver Broncos | 2015 | -1.12 | 1.56 | 0.544 | 0.750 | 3.3 |
| 46 | Oakland Raiders | 1976 | 3.02 | -0.57 | 0.723 | 0.929 | 3.3 |
| 47 | Pittsburgh Steelers | 1987 | -1.97 | 0.04 | 0.327 | 0.533 | 3.3 |
| 48 | Baltimore Ravens | 2000 | -0.89 | 1.33 | 0.544 | 0.750 | 3.3 |
| 49 | Miami Dolphins | 1974 | 1.29 | -0.41 | 0.581 | 0.786 | 3.3 |
| 50 | New England Patriots | 2008 | 0.30 | -0.50 | 0.483 | 0.688 | 3.3 |
| 51 | Detroit Lions | 1969 | -1.89 | 1.59 | 0.478 | 0.679 | 3.2 |
| 52 | San Francisco 49ers | 1990 | 1.19 | 0.71 | 0.676 | 0.875 | 3.2 |
| 53 | New York Jets | 1975 | -1.68 | -3.62 | 0.015 | 0.214 | 3.2 |
| 54 | New England Patriots | 2013 | 0.25 | 0.29 | 0.551 | 0.750 | 3.2 |
| 55 | Houston Oilers | 1993 | -0.24 | 0.77 | 0.552 | 0.750 | 3.2 |
| 56 | Buffalo Bills | 1983 | -1.01 | -1.18 | 0.302 | 0.500 | 3.2 |
| 57 | Boston Patriots | 1966 | 0.35 | -0.93 | 0.447 | 0.643 | 3.1 |
| 58 | Indianapolis Colts | 1988 | -0.60 | -0.86 | 0.368 | 0.563 | 3.1 |
| 59 | San Diego Chargers | 2006 | 1.38 | 0.58 | 0.681 | 0.875 | 3.1 |
| 60 | San Francisco 49ers | 2011 | 0.29 | 0.97 | 0.618 | 0.813 | 3.1 |
| 61 | Washington Redskins | 1986 | 0.87 | -0.25 | 0.557 | 0.750 | 3.1 |
| 62 | New York Jets | 2010 | -0.29 | 0.22 | 0.496 | 0.688 | 3.1 |
| 63 | Chicago Bears | 2006 | -0.24 | 1.52 | 0.621 | 0.813 | 3.1 |
| 64 | Minnesota Vikings | 1971 | -1.10 | 2.10 | 0.597 | 0.786 | 3.0 |
| 65 | New England Patriots | 2004 | 1.29 | 0.73 | 0.686 | 0.875 | 3.0 |
| 66 | Oakland Raiders | 1971 | -0.22 | -0.30 | 0.454 | 0.643 | 3.0 |
| 67 | New England Patriots | 1972 | -1.94 | -3.24 | 0.027 | 0.214 | 3.0 |
| 68 | New England Patriots | 1978 | 0.74 | -0.74 | 0.501 | 0.688 | 3.0 |
| 69 | Carolina Panthers | 2015 | 0.91 | 1.81 | 0.752 | 0.938 | 3.0 |
| 70 | Philadelphia Eagles | 2014 | -0.09 | -0.58 | 0.441 | 0.625 | 3.0 |
| 71 | New York Giants | 2007 | -0.77 | 0.10 | 0.441 | 0.625 | 2.9 |
| 72 | New England Patriots | 1988 | -2.22 | 0.84 | 0.379 | 0.563 | 2.9 |
| 73 | Houston Texans | 2012 | 0.40 | 0.31 | 0.566 | 0.750 | 2.9 |
| 74 | Dallas Cowboys | 1991 | 0.71 | -0.67 | 0.504 | 0.688 | 2.9 |
| 75 | Arizona Cardinals | 2014 | 0.05 | -0.02 | 0.504 | 0.688 | 2.9 |
| 76 | Cleveland Browns | 1967 | -0.15 | -0.31 | 0.460 | 0.643 | 2.9 |
| 77 | Atlanta Falcons | 2012 | 1.09 | 0.32 | 0.630 | 0.813 | 2.9 |
| 78 | Buffalo Bills | 1993 | 0.39 | 0.34 | 0.568 | 0.750 | 2.9 |
| 79 | Indianapolis Colts | 2009 | 1.42 | 0.68 | 0.694 | 0.875 | 2.9 |
| 80 | New York Jets | 2013 | -1.69 | -0.32 | 0.319 | 0.500 | 2.9 |
| 81 | Denver Broncos | 1996 | 0.48 | 0.94 | 0.632 | 0.813 | 2.9 |
| 82 | Denver Broncos | 1980 | -1.08 | -0.89 | 0.321 | 0.500 | 2.9 |
| 83 | Cleveland Browns | 1969 | 0.80 | -0.03 | 0.572 | 0.750 | 2.8 |
| 84 | New York Jets | 1979 | -0.14 | -1.79 | 0.323 | 0.500 | 2.8 |
| 85 | Indianapolis Colts | 2013 | 0.21 | -0.11 | 0.511 | 0.688 | 2.8 |
| 86 | Dallas Cowboys | 1980 | 0.51 | 0.28 | 0.574 | 0.750 | 2.8 |
| 87 | Oakland Raiders | 1981 | -1.62 | -1.01 | 0.262 | 0.438 | 2.8 |
| 88 | Pittsburgh Steelers | 2001 | 0.77 | 0.71 | 0.637 | 0.813 | 2.8 |
| 89 | Chicago Bears | 2005 | -1.90 | 1.97 | 0.513 | 0.688 | 2.8 |
| 90 | Chicago Bears | 2010 | -0.89 | 0.99 | 0.513 | 0.688 | 2.8 |
| 91 | Tampa Bay Buccaneers | 2005 | -0.42 | 0.53 | 0.513 | 0.688 | 2.8 |
| 92 | Los Angeles Raiders | 1983 | 0.34 | 0.47 | 0.577 | 0.750 | 2.8 |
| 93 | New York Giants | 1977 | -2.10 | -1.38 | 0.184 | 0.357 | 2.8 |
| 94 | New York Giants | 1989 | 0.26 | 0.57 | 0.577 | 0.750 | 2.8 |
| 95 | Miami Dolphins | 1985 | 1.50 | -0.65 | 0.578 | 0.750 | 2.8 |
| 96 | Seattle Seahawks | 2006 | -0.77 | -0.45 | 0.390 | 0.563 | 2.8 |
| 97 | St. Louis Rams | 2003 | 0.06 | 0.76 | 0.578 | 0.750 | 2.8 |
| 98 | Denver Broncos | 1992 | -1.18 | -0.71 | 0.329 | 0.500 | 2.7 |
| 99 | Tampa Bay Buccaneers | 1995 | -1.58 | -0.96 | 0.270 | 0.438 | 2.7 |
| 100 | Houston Oilers | 1980 | -0.69 | 0.87 | 0.520 | 0.688 | 2.7 |
The obvious question to ask, then, is why? Why were these Cardinals so successful despite struggling to pass and stop the pass? The Cards were good in one-score games — 4-0-1 — but St. Louis still had a points differential of +2.6 points per game. This wasn’t just a bad team that got lucky. There are a few reasons.
- The Cardinals were 4th in rushing yards, 4th in rushing first downs, 5th in yards per carry, and tied for 1st in rushing touchdowns. Fullback Willis Crenshaw led the way, but the Cardinals also benefited from TE Jackie Smith (12/163) and wide receiver Dave Williams (3/47) gaining 210 yards on just 15 carries. St. Louis had a great offensive line with Bob Reynolds, Irv Goode, Bob DeMarco, Ken Gray, and Ernie McMillan all making the Pro Bowl in either ’67 or ’68.
- On defense, St. Louis ranked between 4th and 6th in rushing yards, yards per carry, rushing touchdowns, and rushing first downs.
- The Cardinals also had great special teams. Chuck Latourette led the NFL in both punt return yards and kickoff return yards, while also leading the NFL in punt return average and ranking second in kickoff return average. Latourette added 135 yards of value as a punt returner and 251 yards of value as a kickoff returner.
- Opposing kickers against St. Louis hit just 15 of 33 attempts; that 45.5% rate was ten percent below the league average. Meanwhile, Jim Bakken made 15 of 24 attempts.
Passing is more than half of the game, but the running game and special teams can tilt things in a close game. The Cardinals went 9-4-1 in ’68, but the script flipped the following year: St. Louis went 4-9-1.