
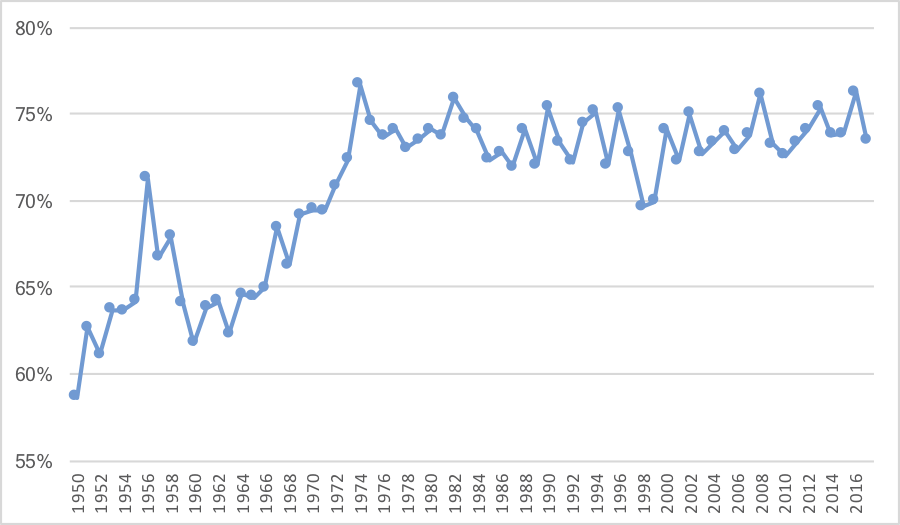
On Sunday, I noted that roughly 2/3s of all touchdown passes now come from inside of the red zone. That number is, of course, even higher when we look at all offensive touchdowns. The graph below shows the percentage of passing and rushing touchdowns that came from within the red zone in every year since 1950. Prior to 1970, less than 70% of all touchdowns came from within the red zone; since then, it’s been at about 75%. What’s interesting is that while there is an obvious increase over the course of pro football history, the rate has been relatively steady over the last five decades:
So over the last 20 years, it may be that shorter passing touchdowns are just replacing shorter rushing touchdowns, which would explain why the percentage of red zone touchdowns (relative to all offensive touchdowns) has been constant while the percentage of red zone passing touchdowns (relative to all passing touchdowns) has been rising. Relative to the pre-merger period, this means that there are fewer long touchdowns.
The higher the percentage of red zone touchdowns to overall offensive touchdowns, the more important red zone performance becomes. In an extreme NFL world, imagine one where teams never scored long touchdowns, but only methodically marched down the field. In that world, red zone performance would be highly important to determining who wins and loses games. So I wondered: how much does red zone performance correlate with winning percentage?
From 2002 to 2017, teams scored a touchdown on 53% of all red zone trips. Last year, the Patriots were the best team in the red zone. New England had 70 red zone trips and scored on 42 of them, for a 60% rate. Given the expected 53% rate, this means the Patriots would have been expected to score 37.2 touchdowns; therefore, New England scored 4.8 more touchdowns than expected. Defensively, the Patriots faced 48 red zone chances and allowed just 21 touchdowns (44%); that means New England allowed 4.5 fewer red zone touchdowns than expected. Altogether, this means the Patriots were 9.3 red zone touchdowns above expectation overall, the highest rate in the league. And, of course, New England went 13-3, for a 0.813 winning percentage. On the other side, the Browns went 19 for 39 (49%, -1.7) on offense and allowed 31 touchdowns on 46 red zone trips (67%, -6.6) on defense, making Cleveland -8.3 for the year. That was the second-worst in the league ahead of only the Broncos (-8.7), and the Browns of course went 0-16.
The graph below shows each team since 2002. On the Y-Axis is each team’s winning percentage; on the X-Axis is each team’s net red zone performance, as described above.
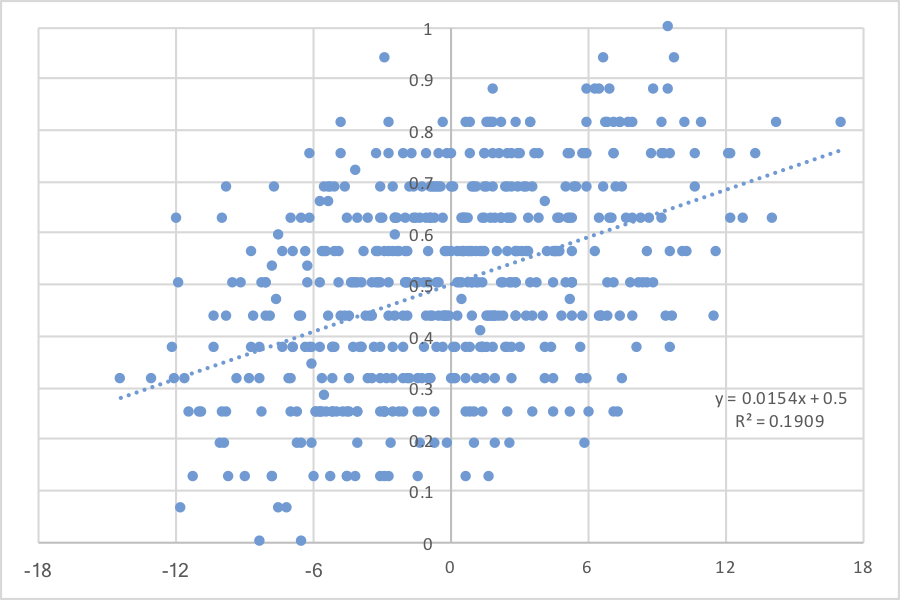
The R^2, or correlation coefficient squared, is 19%, which means (broadly speaking) that 19% of a team’s winning percentage is explained by its red zone performance.
What do you think?