
The Giants have 306 rushing yards this year, and quarterback Daniel Jones has 137 of them, leaving just 169 for the rest of the team.
In the passing game, Jones has thrown every pass for New York through four weeks in 2020. He has picked up 889 passing yards and also lost 83 yards due to sacks. If we look at his advanced splits, we see that 541 of his passing yards have come through the air, with 348 yards coming via yards after the catch. A quarterback is not fully responsible for his air yards, and a quarterback also plays a role in how much YAC his receivers gain. That said, I thought it would be fun to engage in a bit of fiction and treat all air yards as belonging to the quarterback, and all YAC as belonging to the receivers.
In that case, Jones has gained 137 rushing yards, thrown for 541 yards, and lost 83 yards due to sacks, for a total of 595 yards. That is not very much, but consider: all other Giants have gained just 169 yards on the ground and 348 after the catch, for a pitiful total of just 517 yards. So Jones has been responsible for 53.5% of all Giants yards in 2020, which is actually the largest percentage of any player in the league.
To go to the opposite extreme, let’s go visit newly benched quarterback Dwayne Haskins in Washington. The Football Team has rushed for 369 yards, with Haskins only adding 30 yards on the ground. And while the 2018 first round pick has thrown for 939 yards this year, most of them have come after the catch: Haskins has just 362 air yards, compared to 577 yards added after the catch by his receivers (Washington running backs Antonio Gibson and J.D. McKissic have combined for 21 receptions and 176 yards, but 190 of those yards came after the catch; in addition, wide receiver Terry McLaurin leads all wideouts through four weeks in YAC with 198 yards.) Haskins has also lost 101 yards on sacks so far this season: add it up, and Haskins is responsible for adding only 291 yards of offense (30+362-101) by this methodology, while his teammates have picked up 916 yards of offense (339 rushing yards and 577 of YAC). That puts Haskins as the main man for just 24.1% of the yards that Washington’s offense has gained this year.
I used this methodology for every team in the league. Only two quarterbacks, Jones and Ryan Fitzpatrick in Miami, are responsible for over half of their team’s offense. Among teams that have winning records, Lamar Jackson and Josh Allen stand out as two quarterbacks who have gained over 48% of their team’s offenses. After them, Ryan Tannehill, Russell Wilson, and Tom Brady stand out (all over 45%) as no other quarterback is on a team with 3+ wins and has even 40% of his offense.
The full list is below. I also included what percentage of the team’s pass attempts each quarterback has taken, to help you identify quarterbacks who have missed some time. Here’s how to read the Lamar Jackson line. This year he has thrown for 516 air yards compared to having just 253 yards of YAC; he also has rushed for 235 yards. Jackson has lost 70 yards due to sacks, giving him a total of 681 responsible yards. As a team, Baltimore has 1,366 yards of offense, which means Lamar Jackson has been responsible for 49.9% of the team’s yards. Jackson has also taken 97% of the Ravens team pass attempts this year, and has a 3-1 record.
| Quarterback | Team | Air Yards | YAC | QB Rush Yd | Sack Yds | QB Yards | Team Yards | QB Perc | % of TPA | Record |
|---|---|---|---|---|---|---|---|---|---|---|
| Daniel Jones | NYG | 541 | 348 | 137 | 83 | 595 | 1112 | 53.5% | 100% | 0-4-0 |
| Ryan Fitzpatrick | MIA | 624 | 370 | 115 | 33 | 706 | 1388 | 50.9% | 100% | 1-3-0 |
| Lamar Jackson | BAL | 516 | 253 | 235 | 70 | 681 | 1366 | 49.9% | 97% | 3-1-0 |
| Deshaun Watson | HOU | 670 | 422 | 58 | 76 | 652 | 1310 | 49.8% | 100% | 0-4-0 |
| Kyler Murray | ARI | 486 | 433 | 265 | 16 | 735 | 1481 | 49.6% | 100% | 2-2-0 |
| Matt Ryan | ATL | 826 | 420 | 24 | 69 | 781 | 1584 | 49.3% | 99.4% | 0-4-0 |
| Josh Allen | BUF | 774 | 552 | 83 | 61 | 796 | 1638 | 48.6% | 100% | 4-0-0 |
| Dak Prescott | DAL | 943 | 747 | 86 | 59 | 970 | 2038 | 47.6% | 99% | 1-3-0 |
| Ryan Tannehill | TEN | 539 | 270 | 35 | 21 | 553 | 1175 | 47.1% | 100% | 3-0-0 |
| Russell Wilson | SEA | 760 | 525 | 95 | 73 | 782 | 1665 | 47% | 100% | 4-0-0 |
| Tom Brady | TAM | 712 | 410 | 6 | 27 | 691 | 1486 | 46.5% | 100% | 3-1-0 |
| Joe Burrow | CIN | 666 | 455 | 75 | 107 | 634 | 1457 | 43.5% | 100% | 1-2-1 |
| Gardner Minshew II | JAX | 618 | 520 | 69 | 87 | 600 | 1468 | 40.9% | 100% | 1-3-0 |
| Kirk Cousins | MIN | 569 | 314 | 53 | 54 | 568 | 1431 | 39.7% | 100% | 1-3-0 |
| Carson Wentz | PHI | 494 | 436 | 111 | 100 | 505 | 1276 | 39.6% | 100% | 1-2-1 |
| Patrick Mahomes | KAN | 529 | 605 | 108 | 28 | 609 | 1623 | 37.5% | 100% | 4-0-0 |
| Sam Darnold | NYJ | 387 | 405 | 117 | 90 | 414 | 1112 | 37.2% | 98.6% | 0-4-0 |
| Teddy Bridgewater | CAR | 552 | 595 | 70 | 51 | 571 | 1561 | 36.6% | 100% | 2-2-0 |
| Matthew Stafford | DET | 524 | 493 | 45 | 88 | 481 | 1336 | 36% | 100% | 1-3-0 |
| Derek Carr | LVR | 537 | 558 | 33 | 49 | 521 | 1507 | 34.6% | 100% | 2-2-0 |
| Philip Rivers | IND | 500 | 484 | 2 | 15 | 487 | 1441 | 33.8% | 96.8% | 3-1-0 |
| Aaron Rodgers | GNB | 597 | 617 | 31 | 35 | 593 | 1782 | 33.3% | 100% | 4-0-0 |
| Baker Mayfield | CLE | 517 | 212 | 15 | 36 | 496 | 1548 | 32% | 99.1% | 3-1-0 |
| Cam Newton | NWE | 374 | 340 | 149 | 21 | 502 | 1584 | 31.7% | 71.1% | 2-1-0 |
| Jared Goff | LAR | 494 | 569 | 29 | 43 | 480 | 1589 | 30.2% | 100% | 3-1-0 |
| Mitchell Trubisky | CHI | 354 | 206 | 87 | 58 | 383 | 1373 | 27.9% | 54.8% | 3-0-0 |
| Ben Roethlisberger | PIT | 364 | 413 | 4 | 50 | 318 | 1146 | 27.7% | 100% | 3-0-0 |
| Drew Brees | NOR | 441 | 565 | -3 | 40 | 398 | 1484 | 26.8% | 99.2% | 2-2-0 |
| Justin Herbert | LAC | 399 | 532 | 47 | 38 | 408 | 1601 | 25.5% | 78.1% | 0-3-0 |
| Dwayne Haskins | WAS | 362 | 577 | 30 | 101 | 291 | 1207 | 24.1% | 100% | 1-3-0 |
| Nick Foles | CHI | 271 | 166 | -4 | 8 | 259 | 1373 | 18.9% | 45.2% | 0-1-0 |
| Jeff Driskel | DEN | 301 | 131 | 28 | 98 | 231 | 1227 | 18.8% | 45.1% | 0-1-0 |
| Brett Rypien | DEN | 213 | 82 | -5 | 0 | 208 | 1227 | 17% | 28.2% | 1-0-0 |
| Nick Mullens | SFO | 292 | 322 | -2 | 61 | 229 | 1562 | 14.7% | 51.8% | 1-1-0 |
| Tyrod Taylor | LAC | 128 | 80 | 7 | 1 | 134 | 1601 | 8.4% | 21.9% | 1-0-0 |
| Jimmy Garoppolo | SFO | 145 | 245 | 9 | 24 | 130 | 1562 | 8.3% | 34.8% | 1-1-0 |
| Drew Lock | DEN | 103 | 133 | 5 | 8 | 100 | 1227 | 8.1% | 26.8% | 0-2-0 |
| C.J. Beathard | SFO | 88 | 50 | 0 | 9 | 79 | 1562 | 5.1% | 13.5% | |
| Brian Hoyer | NWE | 74 | 56 | 8 | 18 | 64 | 1584 | 4% | 18.8% | 0-1-0 |
| Jarrett Stidham | NWE | 29 | 31 | 3 | 0 | 32 | 1584 | 2% | 10.2% | |
| Joe Flacco | NYJ | 8 | 8 | 0 | 0 | 8 | 1112 | 0.7% | 1.4% | |
| Robert Griffin III | BAL | 5 | 4 | 2 | 0 | 7 | 1366 | 0.5% | 2% | |
| Andy Dalton | DAL | 0 | 0 | 0 | 0 | 0 | 2038 | 0% | 0.5% | |
| Jacoby Brissett | IND | -1 | 18 | 0 | 6 | -7 | 1441 | -0.5% | 3.2% |
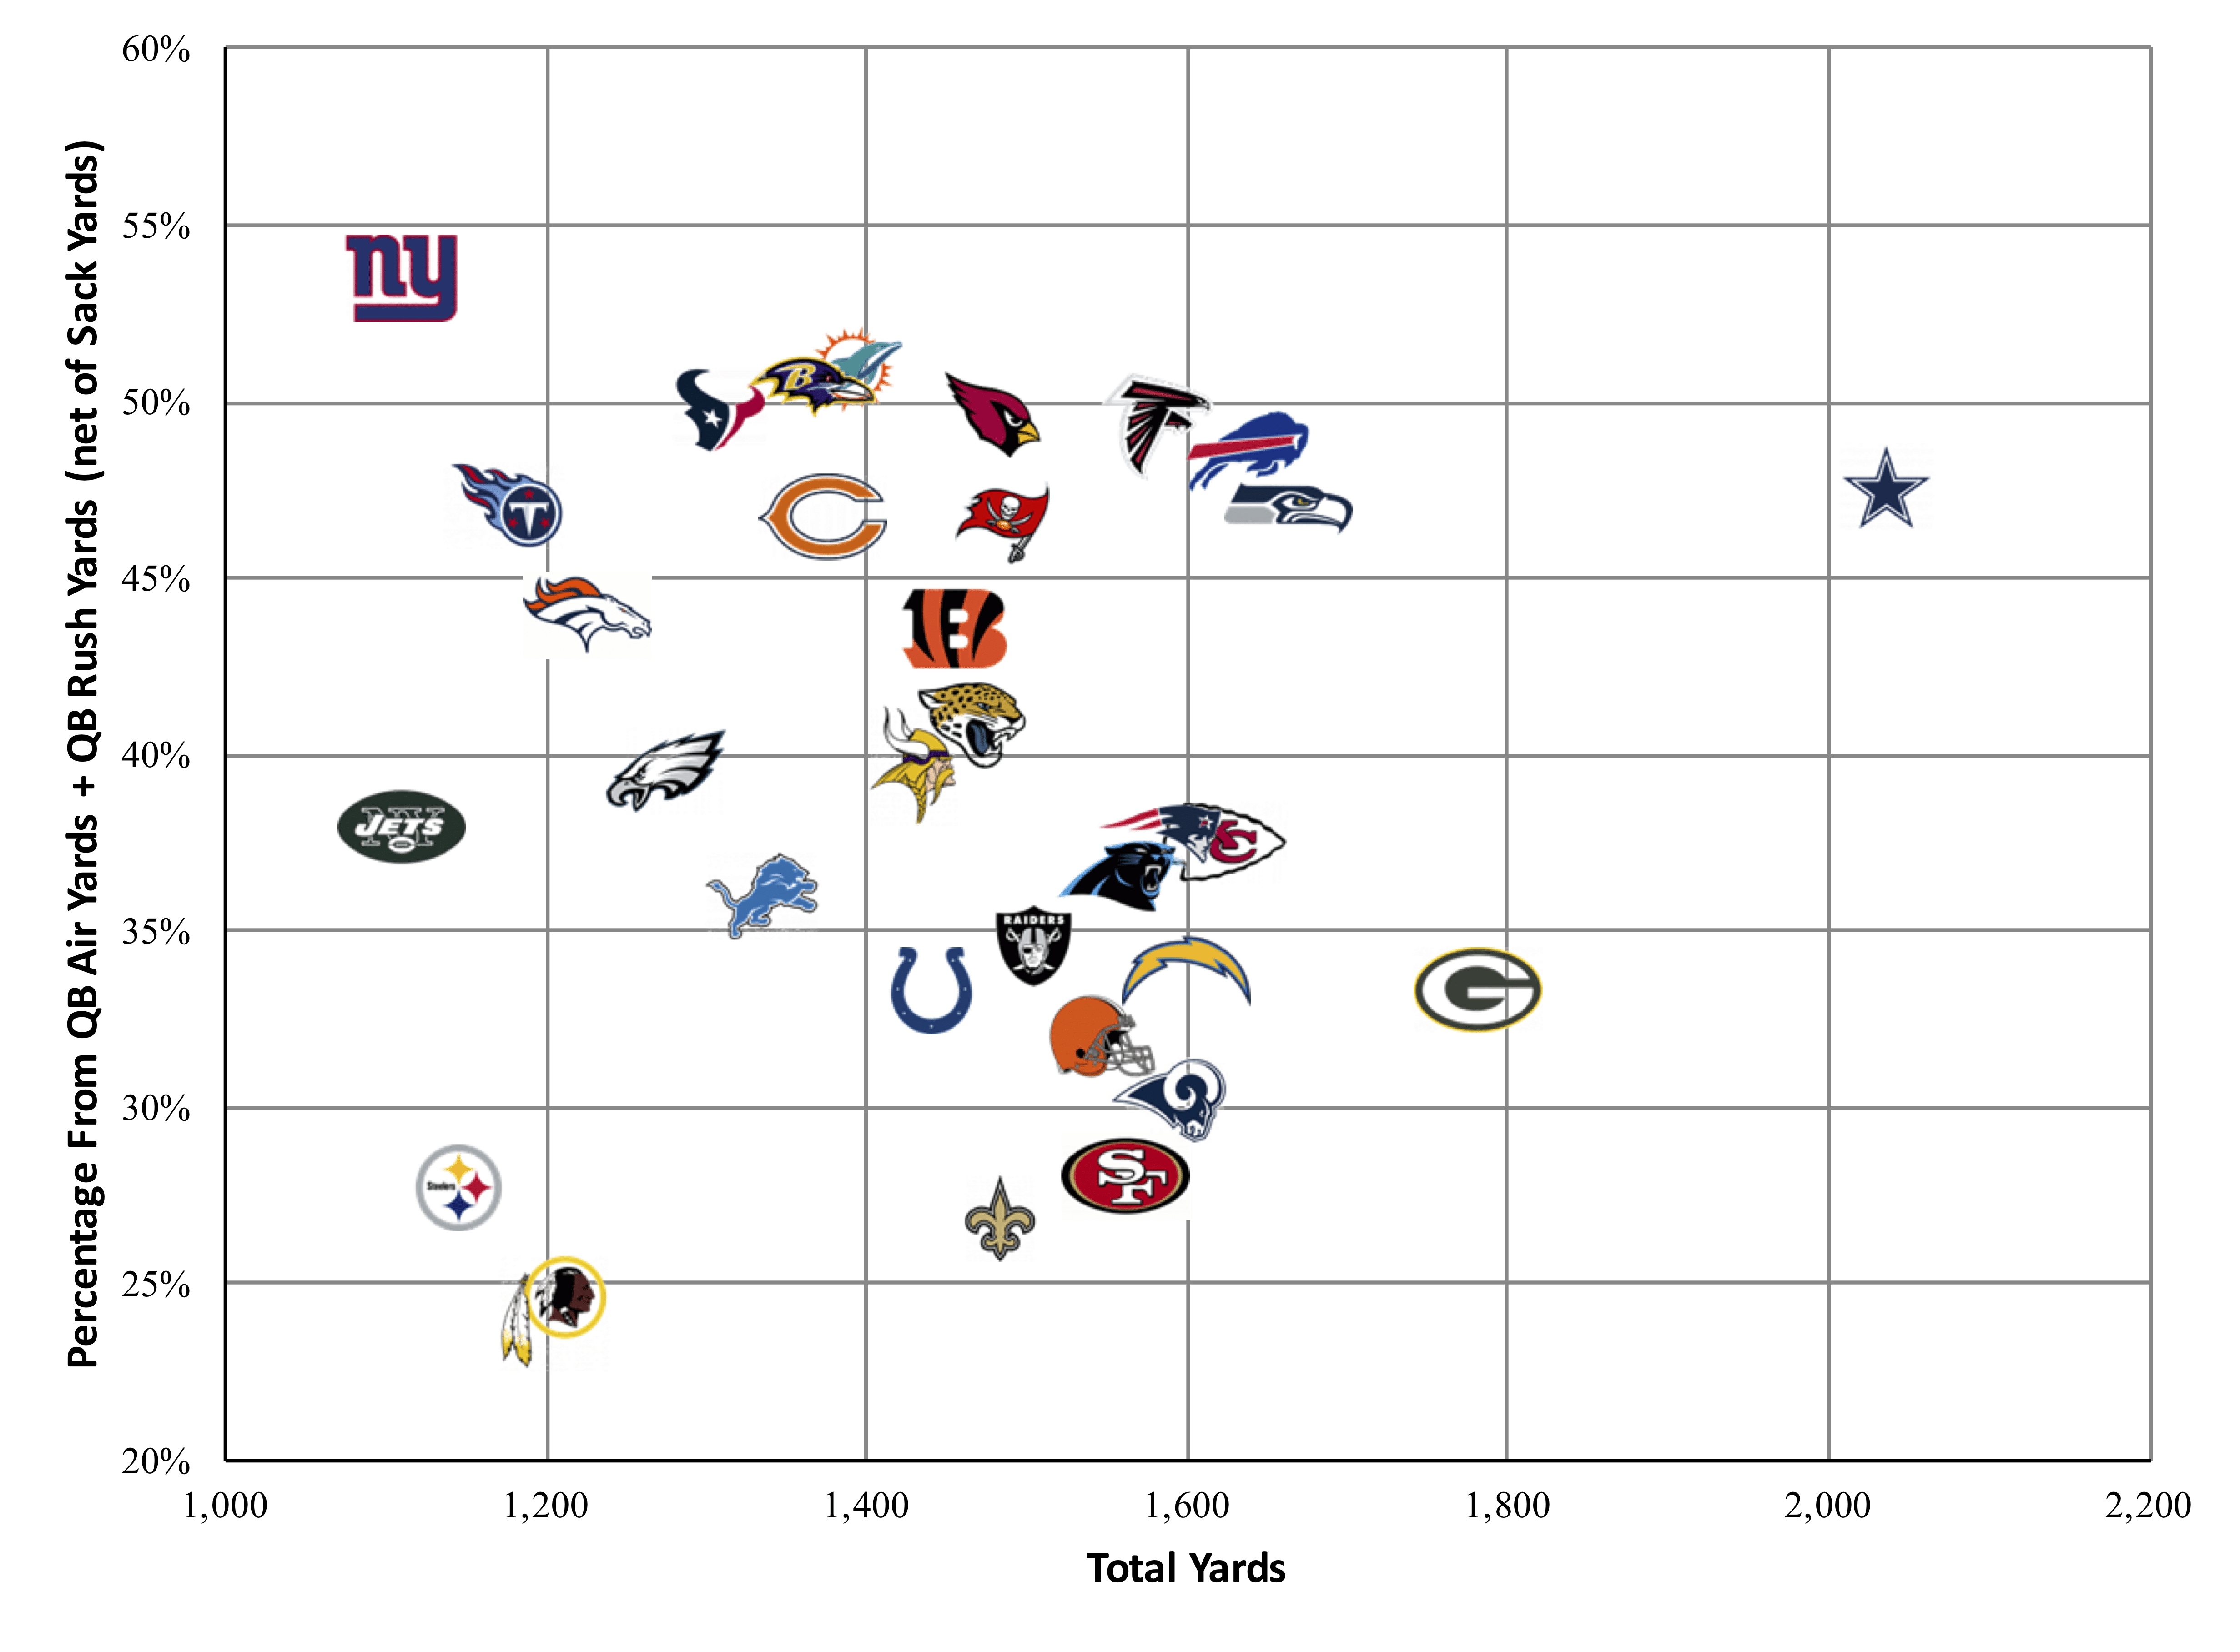
Here’s a graph showing the above data but at the team level. The X-Axis is total yards of offense; the Y-Axis is the percentage of team yards attributable to the QB, based on the methodology in this post. As you can see, Jones and the Giants are at the top of the chart, but also at the far left: along with the Jets, they have gained the fewest yards in football this season. Note that the Steelers and Titans have played just three games, so they would look a lot different on a per-game basis. But if you are looking for reasons to celebrate Allen or Wilson this year, this chart does a nice job of that.
What do you think?