≡ Menu

Postseason Rushing Leaders, By Year

Do you know who the leader in rushing yards in a single postseason?

Click Show for Answer Show


What about the rushing leader among players who played in only three postseason games?

Click Show for Answer Show


What about the rushing leader in the last 10 years in a postseason?

Click Show for Answer Show

[continue reading…]

{ 3 comments }

There were three teams last season that overwhelmingly relied on one running back, and all three made the playoffs: the Chiefs with Kareem Hunt, the Steelers with Le’Veon Bell, and the Rams with Todd Gurley. Given the success the Jaguars had after drafting Leonard Fournette on the heels of the Cowboys revival after drafting Ezekiel Elliott, you might think that — combined with the sentence above — relying on one running back is trendy again.

But that’s the difference between anecdotes and data. The Bears were the fourth most “rely on one RB” team, and Chicago went 5-11. The Browns went 0-16 and were very Isaiah Crowell-heavy. And the Colts were the same with Frank Gore and it brought them a 4-12 record.

On the other side, both the Eagles and Patriots had three running backs finish with between 60 and 180 carries, and those teams met in the Super Bowl. The Seahawks didn’t exactly have a rushing game that you would envy, but no Seattle running back had even 70 carries and the team had a winning record.

Last year, I discussed the idea of rushing concentration indices. Let’s use Hunt as an example. He rushed for 1,327 yards, and all Chiefs running backs rushed for 1,462 yards. So Hunt rushed for 91% of all rushing yards produced by Kansas City running backs. To get the Chiefs RB rushing concentration index, we have to square that number, perform the same calculus for all Chiefs running backs, and sum the totals. For Hunt, squaring his percentage gets you 82%, and the tiny amount for all other Kansas City rushers brings us up to 83%.

On the other hand, we have Philadelphia. LeGarrette Blount had 43% of all Eagles rushing yards (square of that is 18%), Jay Ajayi had 23% (5%), Corey Clement had 18% (3%), Wendell Smallwood had 10% (1%), and Darren Sproles and Kenjon Barner each had three percent (0%). That gave the Eagles a RB rushing concentration index of 28%. That was the second lowest rate in the league. [continue reading…]

{ 8 comments }

Frank Gore is already #5 on the career rushing list, while Adrian Peterson is currently in 12th place (but two years younger). In recent months, I’ve compared Gore and Peterson, as their careers which have been both very similar and very different.  Both had severe knee injuries and might be the two best running backs to ever recover from ACL surgery, and both players are going to wind up very high on the career rushing list. Gore is now the favorite — surprisingly — to finish with more career rushing yards.  On the other hand, Gore is much more of a compiler and Peterson a shining star.  Gore ranks 34th in career rushing yards per game, while Peterson ranks 4th in that category.

So who do you prefer? The guy who ranks 5th in career rushing yards or 4th in career rushing yards per game?  Or, if you like, there’s LeSean McCoy. Gore and Peterson already have crossed the 12,000-yard mark, and McCoy is likely to do so as well; either way, they are the three active players with the most rushing yards, making them a natural source of comparison. And assuming McCoy gets there, they will also be the only three players from this era (not including Tomlinson or younger players) to hit the 12,000-yard mark.

McCoy’s highs weren’t as high as Peterson, but they were a little higher (two first-team All-Pro seasons, a third season as a top-three fantasy running back, six Pro Bowls in the last seven years) than Gore.  And his career volume probably won’t match Gore, but it will probably be higher than Peterson.  McCoy is currently 29th in career rushing yards and 22nd in career rushing yards per game.

Let’s compare the three players year-by-year, starting at age 21. [continue reading…]

{ 9 comments }

Matt Forte, Bilal Powell, and Special Teams Yards

Matt Forte retired yesterday, but we will leave those thoughts for another post. Today, I want to look at what I’ve referred to before as special teams yards. What are those?

All yards gained on special teams are done outside of the context of the series (down and distance) environment that defines most games. A kickoff return from to the 30 or to the 40 represents a difference of 10 yards, but those 10 yards are not as valuable as the difference between a gain of 5 yards and 15 yards on 3rd-and-10. The former are, quite literally, special teams yards. They don’t provide any value in gaining any additional first downs, or keeping a drive alive.

Special teams yards, while obviously valuable, are — just as obviously — the least valuable yards possible.

On a 3rd-and-10, a 15-yard pass provides a significant amount of value by providing a first down. But let’s get a bit more precise: the first 10 of those yards were really valuable. The last 5? Well, those were special teams yards. The difference between gaining 10 yards and gaining 15 yards on 3rd-and-10 isn’t that significant: well, it’s about as significant as returning a kickoff for 30 yards or 35 yards. Those last 5 yards don’t help a team move the chains.

So all yards gained by a player after already picking up a first down are what I’m referring to as special teams yards. And you know what other yards are less meaningful? All yards on third down or fourth down (special teams yards can come on any down) that don’t pick up a first down. A 9-yard run on 3rd-and-15 are just like special teams yards, too.

So let’s call all yards gained after gaining a first down “Post-1D Yards” and all yards on 3rd or 4th down that don’t go for a first down “3D Fail Yards.” To be clear, I’m not saying that Post-1D Yards or 3D Fail Yards are meaningless, but they are akin to special teams yards because they don’t help move the chains. They are yards gained outside of the context of the goal of acquiring a new set of downs.

Now, let’s talk about Forte, who rushed 103 times for 381 yards last year, which equates to 3.70 YPC. His backfield teammate, Bilal Powell, rushed 139 times for 754 yards, a 4.34 YPC average. But Forte had almost no “special teams” yards: he had just 35 yards picked up after gaining a first down, and only 4 yards gained on failed third/fourth down rushes. If you eliminate those, his “net” yards per carry was 3.32.

As for Powell? He had runs of 41, 51, 57, and 75 yards, along with five other runs of at least 20 yards. Those contributed to the 267 Post-1D Yards that Powell had, which comprised a whopping 40% of his total rushing yards. That was the third highest percentage in the NFL (minimum 100 carries) behind only Kenyan Drake (41%) and Cam Newton (43%). Meanwhile, Forte had just 9% of his rushing yards come as Post-1D Yards, the lowest in the league (Jamaal Williams was second at 12%, followed by Doug Martin at 15%). And in addition, Powell had 4% of his yards come as 3D Fail Yards, compared to just 1% for Forte.

Add it up, and Powell’s “net” yards per carry after removing “special teams” yards was just 2.44, quite a bit behind Forte. The table below shows the full data set for all rushers with 100 carries in 2017:

RkPlayerTeamRshRshYdYPCYPC RkPost-1D YdsP1D Y/CP1DY / RYd3D Fail Yd3DF Y/CNet YPCDiff
1Alvin KamaraNOR1207286.0712572.1435.3%50.043.883.48
2Alfred MorrisDAL1165494.7371311.1323.9%10.013.593.19
3Dion LewisNWE1808964.9832521.4028.1%40.023.563.15
4Wayne GallmanNYG1114764.2917820.7417.2%40.043.513.11
5Matt BreidaSFO1054654.4310910.8719.6%140.133.433.03
6Matt ForteNYJ1033813.7036350.349.2%40.043.322.92
7Kareem HuntKAN27213284.8854421.6333.3%40.013.242.84
8Giovani BernardCIN1064594.3315950.9020.7%270.253.182.78
9Ezekiel ElliottDAL2429834.06222140.8821.8%80.033.142.74
10Le'Veon bellPIT32112904.02252720.8521.1%110.033.142.74
11Todd GurleyRAM27913034.6783921.4130.1%360.133.142.74
12Jamaal WilliamsGNB1535563.6339680.4412.2%120.083.112.71
13Christian McCaffreyCAR1174363.7334700.6016.1%50.043.092.68
14Alex CollinsRAV2129734.5993091.4631.8%100.053.082.68
15Lamar MillerHTX2398893.72351560.6517.5%40.023.052.65
16Marshawn LynchRAI2078904.30162561.2428.8%60.033.032.63
17C.J. AndersonDEN24510074.11212521.0325%130.053.032.63
18Peyton BarberTAM1084233.9227960.8922.7%00.003.032.63
19Devonta FreemanATL1968634.40122521.2929.2%180.093.032.62
20Mark IngramNOR23011244.8944041.7635.9%250.113.022.62
21Frank GoreCLT2499153.67381560.6317%70.033.022.62
22LeGarrette BlountPHI1737654.42112321.3430.3%130.083.012.60
23Mike GillisleeNWE1043833.6837690.6618%60.062.962.56
24Orleans DarkwaNYG1717514.39132441.4332.5%10.012.962.56
25Isaiah CrowellCLE2068534.14202361.1527.7%80.042.962.56
26Kerwynn WilliamsCRD1204263.5541720.6016.9%00.002.952.55
27Cam NewtonCAR1397545.4223222.3242.7%310.222.882.48
28Kenyan DrakeMIA1336484.8762672.0141.2%50.042.832.43
29Jay Ajayi2TM2088724.19192671.2830.6%170.082.832.43
30Leonard FournetteJAX26810413.88312851.0627.4%100.042.782.38
31Samaje PerineWAS1756043.45431140.6518.9%30.022.782.38
32Latavius MurrayMIN2168423.90282441.1329%50.022.752.34
33Joe MixonCIN1776243.53421310.7421%80.052.742.34
34Melvin GordonSDG28411053.89293121.1028.2%160.062.742.33
35Jordan HowardCHI27611204.06233541.2831.6%110.042.742.33
36Adrian Peterson2TM1565293.39451050.6719.8%00.002.722.32
37Carlos HydeSFO2399293.89302541.0627.3%280.122.712.31
38Javorius AllenRAV1545923.84321350.8822.8%410.272.702.30
39DeMarco MurrayOTI1846593.58401560.8523.7%90.052.682.28
40Derrick HenryOTI1767444.23182691.5336.2%30.022.682.28
41Jerick McKinnonMIN1515703.77331330.8823.3%370.252.652.25
42Tevin ColemanATL1566304.04242081.3333%130.082.622.22
43Jonathan StewartCAR1986803.43441620.8223.8%70.042.582.18
44Chris IvoryJAX1143823.3546730.6419.1%180.162.552.15
45LeSean McCoyBUF28711393.97263981.3934.9%210.072.512.11
46Doug MartinTAM1384062.9448600.4314.8%00.002.512.11
47Bilal PowellNYJ1787724.34143071.7239.8%310.172.442.04
48Ameer AbdullahDET1655523.35471580.9628.6%50.032.361.96

What stands out to you?

Two notes. The correlation coefficient between Net YPC and actual YPC is 0.61, which is pretty low considering about one-third of actual YPC comes from the elements we leave out of Net YPC (i.e., Post-1D Yds and 3D Fail Yards make up about 33% of total rushing yards). The correlation coefficient between yards per carry and Post-1st Down Yards is 0.66, which is a good reason why, in my opinion, yards per carry isn’t all that helpful in understanding team success.

{ 32 comments }

Rushing Yards over 50: 2017 Editon

A few years ago, I looked at the career leaders in rushing yards over 50 yards in a game. I like doing this because it helps remove less material games and places more of an emphasis on dominance. A player with 16 games of 70 rushing yards has 1,120 rushing yards but only 320 rushing yards over 50 yards per game. On the other hand, a player with 8 games of 25 rushing yards and 8 games of 95 rushing yards maybe was a backup for half the season; he would have only 960 rushing yards but 360 rushing yards over 50 yards per game.

One player who excels in this metric is Ezekiel Elliott, who obviously missed six games due to suspension and therefore ranked only 10th in rushing yards. But Elliott hit 80 or more yards in 9 of 10 games — in fact, he’s rushed for at least 80 yards in a remarkable 23 of 25 career games (and also did it in his sole playoff game) — which means he fares very well in this formulation. In fact, he ranks 4th by this metric, and was the only rusher in 2016 to have over half of his rushing yards come after already rushing for 50 yards in a game.

On the other side of things, you have players like Lamar Miller and Frank Gore. Miller ranked 16th in rushing yards with a respectable 888-yard season, but his season high was just 75 yards. He was a consistent player — in 11 of 16 games he rushed for between 50 and 65 yards — but in no way was he a dominant one. Gore had 961 rushing yards, good enough for 12th place, but he ranked only 23rd in rushing yards over 50. Gore had two big games in December to boost his numbers: but in the first 12 games of the season, Gore finished with between 34 and 62 rushing yards in 11 games. A very consistent runner, yes, but a dominant runner? No.

The full results below: [continue reading…]

{ 1 comment }

Today’s guest post comes from Miles Wray, a long-time reader of the site. He’s written an interesting post on special teams today, but you may know him as the host of the daily NBA podcast The 82 Review. You can also find him on Twitter @mileswray. What follows are Miles’ words: as always, we thank our guest writers for their contributions.


As Chase noted in December, the Seahawks’ Russell Wilson had an opportunity to be just the fifth quarterback to lead his NFL team in rushing yards — an accomplishment that even Michael Vick can’t claim. In the final weeks of the season, Wilson absolutely coasted home with this dubious title belt: he racked up 586 rushing yards, the second-highest total in his career.

That historically rare achievement may mask the historically unprecedented scenario in Seattle’s running backs room. Since the NFL schedule expanded to 16 games in 1978, there had only been six previous times when, at the end of the regular season, a team’s leading running back or fullback finished with less than 350 total yards. [1]Excluding strike-shortened seasons. But in all six of those other cases, that leading rusher still managed to top 300 yards on the season. Well, nobody in Seattle got past 250 this year:

[continue reading…]

References

References
1 Excluding strike-shortened seasons.
{ 5 comments }

Comparing Frank Gore And Emmitt Smith

Is Emmitt Smith’s career rushing mark unbreakable? Before the start of the 2013 season, I wrote about whether Adrian Peterson — at the peak of his career following his AP MVP season — had a realistic chance to break Emmitt Smith’s career rushing record. My conclusion:

As incredible as Smith was through age 27, his production after turning 28 is arguably more impressive. Considering that Peterson is already over 1,000 yards behind Smith, his odds of capturing the record are really, really low. That’s not a knock on Peterson, who is clearly the game’s best running back today. Instead, this post should serve as a reminder of how impressive Smith’s totals truly are.

Peterson is now behind Frank Gore, after briefly holding a career edge over the older player.  Gore is now one of the all-time great “back half of career” running backs in NFL history.  In fact, Gore ranks 2nd all-time in career rushing yards after turning 27 years old. Gore isn’t yet retired, and he’s just under 1,000 yards away from finishing 1st in that category. The leader, of course, is Smith, who remains underrated by many NFL analysts because of his great production later in his career.

How great was it? Well, Gore has pretty much been good from the word go, but he’s always been behind Smith in career rushing yards and he never quite narrowed the gap. If you think Gore’s consistency has been amazing, well, it still pales in comparison to Smith. The graph below shows how many career rushing yards both players had through age X. Smith entered the NFL one year earlier than Gore (side note: both players were born in mid-May), but has almost always increased his lead: [continue reading…]

{ 17 comments }

Bell leads the NFL in rushing yards and rushing attempts.

Steelers running back Le’Veon Bell is having another sensational season. Since 2014, Bell is averaging 91.3 rushing yards and 46.5 receiving yards per game. Bell actually leads all players in yards from scrimmage since 2014 despite missing 14 games! He’s averaging 137.8 yards from scrimmage per game since 2014; Ezekiel Elliott is second at 129.9, but he only played in 23 games. If you exclude Elliott, the next two players are wide receivers (Antonio Brown and Julio Jones) at 106.3 and 104.3, respectively. In fact, excluding Elliot, no other running back has averaged even 100 yards from scrimmage per game; LeSean McCoy is second to Bell at 99.9 yards per game.

Bell is not just a yards from scrimmage star, however. As of yesterday, he was also leading the NFL in rushing yards, Bell is at 1,105 rushing yards, ahead of Kareem Hunt (1,046), Todd Gurley (1,035), Jordan Howard (1,032), and McCoy (1,007). Last night, Hunt rushed for 155 yards in a win over the Chargers, so he is now ahead of Bell (the Steelers play the Patriots today). Elliott is at 97.9 rushing yards per game, a bit ahead of Bell (85.0), but Elliott has missed five (soon to be six) games due to suspension.

Assuming Bell does go on to win the rushing crown, he may in fact join a pretty rare group: leading the NFL in rushing yards despite averaging fewer than 4.0 yards per carry. Right now, Bell is at 3.90 yards per carry, and there’s a good chance his YPC either improves or if it doesn’t, he doesn’t wind up winning the rushing crown. But if he does win the rushing title, Bell would have the lowest yards per carry average of any rushing champion since Football Perspective favorite Eddie Price back in 1951.

The table below shows the rushing yards leader in each season in the NFL, AFL, and AAFC since 1932.

Running BackYearTeamLgRushYardsYPC
Whizzer White1940DETNFL1465143.52
Doug Russell1935CRDNFL1404993.56
Eddie Price1951NYGNFL2719713.58
Whizzer White1938PITNFL1525673.73
Bill Paschal1944NYGNFL1967373.76
Bill Paschal1943NYGNFL1475723.89
Cliff Battles1932BOSNFL1485763.89
Floyd Little1971DENNFL28411333.99
Christian Okoye1989KANNFL37014804.00
Tuffy Leemans1936NYGNFL2068304.03
Cliff Battles1937WASNFL2168744.05
Bill Dudley1946PITNFL1466044.14
Edgerrin James1999INDNFL36915534.21
Charles White1987RAMNFL32413744.24
Cookie Gilchrist1964BUFAFL2309814.27
Eric Dickerson1988INDNFL38816594.28
Emmitt Smith1991DALNFL36515634.28
O.J. Simpson1972BUFNFL29212514.28
Bill Dudley1942PITNFL1626964.30
Paul Robinson1968CINAFL23810234.30
Steve Van Buren1949PHINFL26311464.36
Gale Sayers1969CHINFL23610324.37
Pug Manders1941BKNNFL1114864.38
Edgerrin James2000INDNFL38717094.42
George Rogers1981NORNFL37816744.43
Eric Dickerson1986RAMNFL40418214.51
Alan Ameche1955BALNFL2139614.51
Jim Nance1967BOSAFL26912164.52
Adrian Peterson2015MINNFL32714854.54
Curtis Martin2004NYJNFL37116974.57
Jim Brown1959CLENFL29013294.58
Emmitt Smith1992DALNFL37317134.59
Earl Campbell1979HOUNFL36816974.61
Jim Brown1961CLENFL30514084.62
Marcus Allen1985RAINFL38017594.63
Eric Dickerson1983RAMNFL39018084.64
Steve Van Buren1947PHINFL21710084.65
Jim Brown1957CLENFL2029424.66
Jim Musick1933BOSNFL1738094.68
LaDainian Tomlinson2007SDGNFL31514744.68
Maurice Jones-Drew2011JAXNFL34316064.68
Steve Van Buren1948PHINFL2019454.70
Emmitt Smith1995DALNFL37717734.70
DeMarco Murray2014DALNFL39218454.71
Billy Cannon1961HOUAFL2009484.74
Larry Brown1970WASNFL23711254.75
Priest Holmes2001KANNFL32715554.76
Dickie Post1969SDGAFL1828734.80
Earl Campbell1978HOUNFL30214504.80
Rick Casares1956CHINFL23411264.81
Ricky Williams2002MIANFL38318534.84
Adrian Peterson2008MINNFL36317604.85
Jim Nance1966BOSAFL29914584.88
Arian Foster2010HOUNFL32716164.94
Leroy Kelly1968CLENFL24812395.00
Paul Lowe1965SDGAFL22211215.05
Barry Sanders1996DETNFL30715535.06
Spec Sanders1946NYYAAFC1407095.06
Ezekiel Elliott2016DALNFL32216315.07
Shaun Alexander2005SEANFL37018805.08
Clem Daniels1963OAKAFL21510995.11
Barry Sanders1990DETNFL25513045.11
LeSean McCoy2013PHINFL31416075.12
Cookie Gilchrist1962BUFAFL21410965.12
Terrell Davis1998DENNFL39220085.12
Leroy Kelly1967CLENFL23512055.13
Jim Brown1964CLENFL28014465.16
O.J. Simpson1976BUFNFL29015035.18
Earl Campbell1980HOUNFL37319345.18
Freeman McNeil1982NYJNFL1517865.21
LaDainian Tomlinson2006SDGNFL34818155.22
Emmitt Smith1993DALNFL28314865.25
Joe Perry1953SFONFL19210185.30
Jamal Lewis2003BALNFL38720665.34
Jim Brown1965CLENFL28915445.34
Otis Armstrong1974DENNFL26314075.35
Gale Sayers1966CHINFL22912315.38
Jim Taylor1962GNBNFL27214745.42
Walter Payton1977CHINFL33918525.46
O.J. Simpson1975BUFNFL32918175.52
Eric Dickerson1984RAMNFL37921055.55
Chris Johnson2009TENNFL35820065.60
Abner Haynes1960DTXAFL1568755.61
Barry Sanders1994DETNFL33118835.69
Dan Towler1952RAMNFL1568945.73
Bill Osmanski1939CHINFL1216995.78
Marion Motley1950CLENFL1408105.79
Steve Van Buren1945PHINFL1438325.82
Jim Brown1960CLENFL21512575.85
Jim Brown1958CLENFL25715275.94
Adrian Peterson2012MINNFL34820976.03
O.J. Simpson1973BUFNFL33220036.03
Joe Perry1954SFONFL17310496.06
Barry Sanders1997DETNFL33520536.13
Marion Motley1948CLEAAFC1579646.14
Spec Sanders1947NYYAAFC23114326.20
Jim Brown1963CLENFL29118636.40
Joe Perry1949SFOAAFC1157836.81
Beattie Feathers1934CHINFL11910048.44

In the last 20 years, Edgerrin James has the two lowest YPC averages of any rushing leader.  Before James, the lowest YPC average belongs to Christian Okoye, who averaged exactly 4.00 yards per carry in 1989.  Okoye narrowly avoided being one of just two running backs since the AFL-NFL merger to lead the NFL in rushing with a sub-4.00 YPC average. That lone honor therefore belongs to Floyd Little, who averaged 3.99 YPC in 1971.

{ 3 comments }

Regular readers know that I am not a big fan of yards per carry to measure a running game, on either the team or the individual level. That also goes for team defense. If you look at this year’s standings, though, and compare a team’s record to its yards per carry allowed, you will in fact notice a correlation.

And a moderately strong one at that. The correlation coefficient between a team’s winning percentage in 2017 and that team’s yards per carry allowed is 0.37. That indicates a positive correlation between the two stats, but… well, there isn’t supposed to be a positive correlation. This means that allowing more yards per rush is correlated with winning more games. See for yourself: [continue reading…]

{ 15 comments }

Carolina is #1… in percentage of rushing yards not by running backs

The Carolina Panthers have rushed for 982 yards this year, an average of 109.1 per game.  That ranks 15th in the NFL, and just a hair above the league average rate of 108.1 rushing yards/game.  But the Panthers don’t have anything resembling a traditional ground game: of those 982 yards, starting running back Jonathan Stewart has just 350 of them, while quarterback Cam Newton has 341 rushing yards, the most of any quarterback in the NFL in 2017.

In addition, wide receivers Curtis Samuel, Damiere Byrd, and Russell Shepard have combined for 87 yards; that’s the third-most rushing yards in the league for any team behind the Rams (Tavon Austin) and Raiders (Cordarrelle Patterson) among non-QB/non-RBs. In fact, Panthers running backs are averaging just 61.6 rushing yards per game, the fewest in the NFL.

This is hardly shocking, of course: Newton has been an incredible rushing threat since he arrived in the NFL in 2011. But it’s still interesting to see the numbers and understand that the Panthers are an above average team in total rushing, but dead last in rushing by running backs. The table below shows each team’s rushing yards in 2017 through nine weeks, both by running backs only and overall. Here’s how to read the table below. The Jacksonville Jaguars rank 1st in running back rushing yards, with 145.1 per game. The Jaguars also rank 1st in total rushing yards per game, at 166.5. For Jacksonville, 87.2% of their rushing yards have come from running backs. The Panthers rank last in both running back rushing yards per game and percentage of rushing yards by their running backs. [continue reading…]

{ 7 comments }

Young Running Backs Are Taking Over The NFL

Kareem Hunt has dominated the NFL so far

Kareem Hunt, Leonard Fournette, and Dalvin Cook (who is now on IR after tearing his ACL in week four) were all drafted in 2017.

Jordan Howard, Ezekiel Elliott, Alex Collins, and Derrick Henry were all drafted in 2016.

Todd Gurley, Jay Ajayi, Melvin Gordon, and Ameer Abdullah were each drafted in 2015.

Those 11 running backs are all ranked in the top 20 in rushing yards. Last year, 11 of the top 20 rushing leaders were also were 1st, 2nd, or 3rd year players, but that is pretty unusual. The table below look at every NFL season since 1970, and shows the number of players in the top 20 in rushing that were in their first, second, or third years, and the total number of players in their first three years. [continue reading…]

{ 0 comments }

Let’s travel back in time to December 7th, 2013.

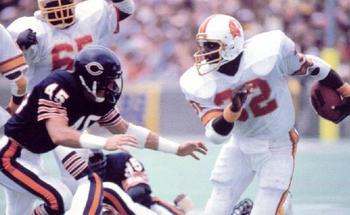
Adrian Peterson was 28 years and 255 days old, and had just rushed for 211 yards in a win against the Bears. Peterson, who had rushed for 2,097 yards in 2012, was looking to repeat as rushing champion: he had just cracked the 1,200-yard rushing mark in 2013, while no other running back had yet hit 1,100 yards.

Frank Gore was 30 years and 201 days old, and had just had another mediocre week.  Against the Rams, he rushed 15 times for only 42 yards, his second poor game in a row and his sixth straight game with fewer than 100 rushing yards. He ranked 10th in the NFL in rushing.

Gore, by virtue of being two years older and having entered the NFL two years earlier than Peterson, had just finished his 128th game; Peterson had just completed his 101st.  But despite the two-year head start, Peterson had edged in front of Gore on the career rushing list.  In fact, his stellar effort against Chicago extended Peterson’s career edge to 397 yards: the Vikings star had 10,057 rushing yards, while the 49ers star had 9,660.

Peterson, at 28 years old, had a career average of 100 rushing yards per game; Gore, at 30, was at 75 rushing yards per game for his career.  At the time, it would have been laughable to wonder who would finish with more career rushing yards: Peterson was better, younger, and was already in the lead!

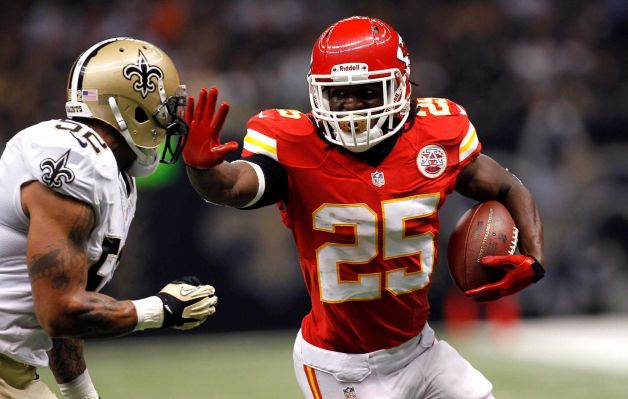
But the next week, Peterson injured his foot against the Ravens, and he dealt with foot and groin injuries for the rest of 2013.  In 2014, he missed nearly the entire season due to a suspension after being indicted on charges of reckless or negligent injury to his son.  In 2015, he had another great season and led the NFL in rushing, but in 2016, a knee injury limited him to just 72 yards in three games, his second season in three years with under 100 rushing yards. And this year? He’s now with the Saints, but has only 27 carries for 81 yards through four games: he ranks 3rd on New Orleans in rushing and 8th in yards from scrimmage.   Since December 7, 2013, he’s rushed for only 1,771 yards.

As for Gore? Well, he’s just kept chugging along, rushing for about 65 yards seemingly every week. He’s basically doubled Peterson since then, with 3,486 yards since that poor game against the Rams in his age 30 season.  So despite being older, a less effective player, and behind in the standings, Gore has now jumped out to a 1,428 yard career edge on Peterson.  That’s the largest his lead has been since 2008, when Peterson was in his second year with the Vikings.

The best way to understand Gore and Peterson’s career, though, is with a visual. In the graph below, I’ve plotted Gore’s (in Niners red) and Peterson’s (in Vikings purple) career rushing yards through each week of the NFL since 2005.  Their totals are marked against the Left Y-Axis. Gore had a lead of over 2,000 yards by the time Peterson entered the league, but you can see that Peterson’s line — once it starts — is much steeper. Eventually, he overtook Gore, and that lead hit its peak in early December 2013. Since then, he’s flattened out other than his strong 2015 season, and while Peterson is just shy of 12,000 rushing yards, Gore has already topped 13,000.

Plotted against the Right Y-Axis is the amount of Gore’s lead: some weeks he would beat Peterson, of course, but in general, that lead kept declining until that Peterson injury in 2013 and his suspension in 2013.  His lead went back down again during 2015, but Gore’s advantage is again on the rise: [continue reading…]

{ 17 comments }

Bell had a lot of valuable yards last year.

All yards gained on special teams are done outside of the context of the series (down and distance) environment that defines most games. A kickoff return from to the 30 or to the 40 represents a difference of 10 yards, but those 10 yards are not as valuable as the difference between a gain of 5 yards and 15 yards on 3rd-and-10. The former are, quite literally, special teams yards. They don’t provide any value in gaining any additional first downs, or keeping a drive alive. This is why we don’t spend a lot of time thinking about all-purpose yardage leaders, or the difference between a kickoff returner who averages 28.0 yards per return or 24.0. Special teams yards, while obviously valuable, are — just as obviously — the least valuable yards possible.

On a 3rd-and-10, a 15-yard pass provides a significant amount of value by providing a first down. But let’s get a bit more precise: the first 10 of those yards were really valuable. The last 5? Well, those were special teams yards. The difference between gaining 10 yards and gaining 15 yards on 3rd-and-10 isn’t that significant: well, it’s about as significant as returning a kickoff for 30 yards or 35 yards. Those last 5 yards don’t help a team move the chains. [continue reading…]

{ 21 comments }

Two years ago, I wrote this post titled “Take Away His X Best Carries and He’s Average.” The idea was simple: Suppose you sort each running back’s carries in descending order by yards gained. How many carries would we need to take away from him to drop his production to at or below average?

Browns running back Isaiah Crowell ranked 9th in yards per carry last year, with an impressive 4.81 average gain. But that number may be a bit misleading, to the extent it made you think that Crowell was consistently churning out big gains. Crowell was responsible for the longest run of the season last year, an 85-yard run in week 2 against the Ravens. And, for what it’s worth, it was one of the easiest long runs you’ll ever see:

In the last game of the year, Crowell had a more impressive 67-yard run against the Steelers. But here’s the thing: outside of those two runs, Crowell averaged just 4.08 yards per carry on his other 196 carries.

There were 42 running backs last year who had at least 100 rush attempts; those players averaged 4.19 yards per carry last year. So if you remove Crowell’s two best carries, he falls below that average.

An impressive Powell movement

On the other hand, Steelers running back Le’Veon Bell averaged 4.86 yards per carry last year, and his six best runs went for 44, 38, 33, 26, 25, and 24 yards. Remove those, and Bell still averaged 4.23 yards per carry, which means you need to remove his seven best runs to drop him below average.

Jets running back Bilal Powell was the star of this metric.  He averaged 5.51 yards per carry last year, but he was a consistent producer of big gains.  He had 12 runs of 13+ yards, and you need to remove all 12 to bring Powell below average.  Remove those 12 carries and his average finally dips to 4.16 yards per carry.

Below are the 19 running backs to exceed that 4.19 yards per carry average last year, and the fewest number of carries you would need to remove to bring their production below average: [continue reading…]

{ 15 comments }

Yards per Carry: RB1 vs. RB2

Regular readers know that I’m not a huge fan of yards per carry as a metric to evaluate running backs, or even rushing attacks. Given the limited numbers of metrics available, sometimes it is a useful measure, but we also much caution ourselves against relying on it too often. Today’s post is another example of that.

I looked at all rushing attacks since 2002, and calculated the yards per carry gained by each team’s top running back and second running back (excluding pure fullbacks and situations where the second running back had fewer than 50 carries), as measured by carries. If yards per carry was the best way to evaluate running backs, and coaches wanted to play their best players most frequently (and, of course, coaches were able to identify their best players), then RB1s should be better at RB2s at yards per carry.

Last year, Bears rookie Jordan Howard averaged 5.2 yards per carry on 252 carries, while backup Jeremy Langford (who actually opened the season as the starter) gained just 3.2 yards per carry on 62 carries.  That’s a piece of evidence that YPC is useful: Howard was much better than Langford at YPC, and he gained way more carries.  But that +2.0 discrepancy was the largest in football last year: this is an outlier, not a typical example.

How about an outlier in the other direction? The Jets top running back last year was Matt Forte, who started 13 games and handled 218 carries; he averaged 3.7 yards per rush. Meanwhile, backup Bilal Powell averaged 5.5 yards per carry on 131 carries.  This might mean that Powell is better than Forte, but at least last year, the Jets didn’t seem to think so — or maybe thought so too late.

These are two interesting examples because they show some of the drawbacks to actually trying to properly analyze the issue.  Howard was the backup, but because he was so much better than Langford, he gets graded as Chicago’s top running back.  This biases the study in favor of RB1s: if a running back is producing at a high rate, even if he’s the backup, he may wind up leading his team in rushes that year (thanks to earning more carries in the second half of the season), which means RB1s in generally will appear to have higher yards per carry than RB2s.  In that way, it becomes a self-fulfilling prophecy.

On the other hand, look at the Jets example.  I think we would all agree that Powell was the Jets best running back last season. He actually finished with more yards from scrimmage than Forte (thanks to playing in two more games), and nearly outrushed him, too. Forte was the (moderately) high priced veteran free agent signing, while Powell was intended to be the backup. By the end of the year, it was clear Powell was the Jets best running back (if not best player), but he didn’t have enough carries to overtake Forte for RB1 status. So in some ways, this study may not properly identify a team’s true top running back and backup running back, if we only classify those players by carries.

So there is some issues with this on a case-by-case basis.  That’s why the best thing to do is to aggregate the data.  The graph below shows the average yards per rush gained by the average team’s RB1 and average team’s RB2 in each year since 2002: [continue reading…]

{ 15 comments }

RBBC, Rushing Concentration, and Outliers

In 1984, James Wilder had 407 carries for Tampa Bay at a time when the league was only beginning to shift away from running back by committee. In fact, by the end of the ’84 season, three of the highest single-season carry totals in NFL history had taken place that year, with Walter Payton and Eric Dickerson joining Wilder as true workhorses. The ’84 Bucs had the most concentrated rushing attack of any team in an era of increasingly concentrated rushing attacks.

Take a look: in ’84, Wilder had 1,544 rushing yards, which represented 86.94% of all Bucs rushing yards. The square of that is 75.58%; sum the squares of all players who gained rushing yards for Tampa Bay last year, and you get a concentration index of 75.87%.

PlayerRushYdsPercSqrd
James Wilder407154486.94%75.58%
Steve DeBerg28593.32%0.11%
Mel Carver11442.48%0.06%
Jack Thompson5351.97%0.04%
Adger Armstrong10341.91%0.04%
Michael Morton16271.52%0.02%
Gerald Carter1160.9%0.01%
Scott Dierking3140.79%0.01%
George Peoples120.11%0.00%
James Owens110.06%0.00%
Total4831776100%75.87%

James Wilder was a one man offense

That was a truly remarkable number in the historical context of 1984. It crushed an NFL record set just one year earlier: the ’83 Rams, with a rookie Dickerson, had a rushing concentration index of 65.95%. Only one other team – the ’81 Oilers — had a concentration index of over 60% when the Bucs hit 76% in 1984.

The average team had a rushing concentration index of 35.5%, and the standard deviation among the teams in 1984 was 13.7%. As a result, Tampa Bay’s rushing concentration index was 2.96 standard deviations above average, known as the Z-Score. That was the 2nd most concentrated score from 1946 to 1984, snugly fit in between the 1966 Patriots (2.93) and 1967 Patriots (2.97).

In 1966, the Patriots led the AFL in rushing attempts and featured a two-back offense with Jim Nance (299 carries) and Larry Garron (101 carries). But since Nance averaged 4.9 yards per carry and Garron just 3.2, Nance wound up rushing for about 74% of the Patriots rushing yards that season. In ’67, New England ran less often, but Nance took a larger share of the load. He had 269 carries to Garron’s 46, and had 76% of all Patriots rushing yards in a very RBBC-centric era. From ’66 to ’67, Nance wasn’t just the top RB in the AFL but in all of pro football. Thanks to his heavy workload, he easily outrushed two HOF RBs in the primes of their career during those seasons.

The table below shows each team that had a Z-Score of at least 1.25 in rushing concentration. Here’s how to read it. In 1991, the Cowboys behind Emmitt Smith had 1,726 rushing yards. [1]This excludes any player who finished the season with negative rushing yards. The squared result of each player’s percentage — i.e., the concentration index — was 82.3%. The standard deviation among all teams that year was 13.9%, and the league average was just 33.9%, giving the ’91 Cowboys a Z-Score of 3.48. In other words, the ’91 Cowboys’ rushing attack was so concentrated for that season that it was 3.48 standard deviations above average. That’s why it ranks 1st in this metric. [continue reading…]

References

References
1 This excludes any player who finished the season with negative rushing yards.
{ 6 comments }

Three years ago, I looked at the single-season leaders in percentage of team rushing yards. Then and now, the top two seasons belonged to Edgerrin James: he had 94% and 92% of the Colts rushing yards in his first two seasons in the league. There were only three other seasons where a running back had at least 90% of his team’s rushing yards: Emmitt Smith in 1991, Barry Sanders in 1994, and … Travis Henry in 2002. In that post, I calculated for each team the percentage of his team rushing yards gained by that team’s top rusher. Then I calculated the league average percentage gained by each team’s top rusher, and plotted how that varied over time. This was intended to measure how running back back committee centric the league was in each year.

For a less rigorous method to measure RBBC-ness, you can see this post, which looked at games with more than 15 carries.

Both methods show RBBC being heavy in the ’70s, and the stud RB era peaking about 10 years ago.  But if you want to measure rushing concentration, a better method is probably to use the formula described yesterday. So for each team, I calculated the percentage of team rushing yards gained by every player on the team, squared that result, and then summed those numbers for each player on the team. You can read yesterday’s post for more info on the methodology, but here were the results for 2016: [continue reading…]

{ 9 comments }

Isaiah Crowell had a funny year. If you were paying attention in the beginning of the season — or maybe just the end of the season — you probably thought he did really well. Crowell rushed for 394 yards  in Cleveland’s first four games, the second-most among all players through their team’s first four games.  He also rushed for 347 yards in the Browns last four games, the fifth-most among all players in their team’s final four games.  And he averaged about 6.5 yards per carry during each of those quarter-season stretches, too.

The middle of the year? Well, that was a very different story.  Crowell ranked 48th among all players in rushing yards in their team’s middle 8 games of the season, with just 211 yards and an anemic 2.51 yards per carry average.  Given that Crowell was the Browns main running back, Cleveland as a team experienced similar results.  Absent a week game in week 7 when backup quarterback Kevin Hogan entered the game and wound up rushing for 104 yards himself, the Browns rushing split was dramatic: in all 8 games in the first/final quarter of the season, Cleveland rushed for at least 107 yards; in the 7 games in the middle of the season, the Browns rushed for fewer than 70 yards in every game.  Take a look:

Browns Rushing By Game


Another team that had a weird rushing split was the Miami Dolphins.  This was closely tied to the success of Jay Ajayi, who had three games with over 200 yards, one other game with over 100 yards, and failed to hit 80 yards in Miami’s other 12 games.

Dolphins Rushing By Game

I didn’t pick Miami and Cleveland at random: those two teams had the largest variation in rushing performance in 2016, at least when measured as a percentage of average output. Miami rushed for 114 yards per game, with a standard deviation of 69.8 rushing yards, or 61.8% of the team’s average performance. Cleveland was at 107.0 and 64.8, respectively, or 60.6%. The table below shows the standard deviation in rushing for each team in 2016: [continue reading…]

{ 6 comments }

The most efficient runner in NFL history? That depends.

Jamaal Charles is now a Denver Bronco, making him the second superstar running back in two weeks to join a new team at the tail end of his career. In his prime, Charles was a very good receiver and a player that could be the centerpiece of an offense. However, he will likely be remembered for a singular skill: rushing efficiency.

Charles has a career YPC average of 5.45, easily the best in history among running backs in the NFL. That number is at least a little misleading. While rushing efficiency has not soared the way passing efficiency has, we are currently in a high-YPC environment. Two years ago, I calculated era-adjusted yards per carry: at the time, Charles was at 5.49, while the league average was 4.21. For reference, the league average during the careers of Jim Brown, Gale Sayers, and Barry Sanders was 4.08, 3.95, and 3.93, respectively.

I am not a big fan of yards per carry as a statistic, but hey, it’s still interesting trivia. It’s a little silly and mostly an academic exercise, but let’s pretend that we replaced every Charles rush attempt with a league average rush attempt. How much worse off would Kansas City have been? Well, a whole lot. Let’s use his 2010 season as an example. He had 230 carries for 1,467 yards, producing an incredible 6.38 YPC average. The league average that season was 4.21, meaning he was 2.17 YPC above-average. Given his 230 carries, we would have expected him to rush for just 968 yards, meaning he produced 499 rushing yards above average. And for his career? Charles is at +1657. [continue reading…]

{ 8 comments }

Peterson with a rare cameo by a good quarterback.

After a ten-year career with the Vikings, Adrian Peterson is now headed to New Orleans where he will get to play with Drew Brees.  It will be the second time Peterson has played with a Hall of Fame quarterback, after Brett Favre’s stint with the team beginning in 2009.

In ’09, the Vikings had a Relative ANY/A of +2.05, easily the best passing game the franchise has produced in the last decade.  In fact, the only other time in the last ten years that Minnesota had an above-average ANY/A was last year, when Peterson rushed for just 72 yards in three games.

Most of his time in Minnesota, though, the team’s passing attack has been below-average — or outright bad.  For example, in 2012, Peterson rushed for 2,097 yards.  That represented 17.9% of his career total, and it came when the Vikings had a Relative ANY/A of -0.94.  Overall Peterson has a weighted average RANY/A — i.e., the Vikings RANY/A in each season of Peterson’s career, weighted by the number of rushing yards Peterson had — for his career of -0.52.  Take a look. [continue reading…]

{ 6 comments }

Last year, Tyrod Taylor led all quarterbacks with 580 rushing yards. Colin Kaepernick, in 12 games, ranked 2nd with 468 rushing yards, and no other quarterback had even 400 rushing yards. But Aaron Rodgers, Blake Bortles, Cam Newton, Marcus Mariota, and Andrew Luck all had at least 300 rushing yards, so 7 out of 32 teams had a quarterback with at least that many yards.

How does that compare historically? Two years ago, in one of my favorite posts/methodologies, I looked at how to measure quarterback rushing yards. Here’s what I did.

1) Calculate the percentage of league-wide passing yards by each player in each season. For example, Tyrod Taylor was responsible for 2.3% of all passing yards in 2016.

2) Calculate the weighted average league-wide rushing yards for each season. So we take the result in step 1 and multiply that by each player’s number of rushing yards. For Taylor, this means multiplying 2.3% by 580 for a result of 13.4 rushing yards. Perform this calculation for each player in each season and sum the results to obtain a league-wide total. For 2016, this total was 150.9 rushing yards (obviously Taylor was the biggest contributor among quarterbacks).

3) For non-16 game seasons, pro-rate to 16 games.

Perform this calculation for each season since 1950, and you get the following results: [continue reading…]

{ 6 comments }

Todd Gurley, Jay Ajayi, and Running Back Variation

In yesterday’s post about Frank Gore, I lauded Gore’s remarkable consistency, year after year. But his consistency — for better or worse — is also true game after game. Gore pulled off a tough feat in 2015, rushing for 967 yards while failing to record a single 100-yard game. Last year, he rushed for 1,025 yards and while he topped the century mark twice, he gained just 101 and 106 yards in those games.

How consistent is Gore? Well, not as consistent as Todd Gurley (again, for better or worse: consistency is neither inherently good or bad). I looked at all running backs who averaged at least 50 rushing yards per game and had 700 rushing yards last year. In the graph below, on the X-Axis I have plotted rushing yards per game; on the Y-Axis is each player’s standard deviation in rushing yards across all 2016 regular season games. Gurley, as you can see, is the “lowest” on the graph, although he’s also really far to the left (because his average wasn’t very high). In general, the running backs who gain more yards are less consistent, which is just a residue of how standard deviation works. One interesting counter to that: Ezekiel Elliott. [continue reading…]

{ 8 comments }

538: Buffalo, Washington, Are Making Running Great Again

The Bills are on one of the craziest running streaks in recent history.  Washington? Well, here is what I wrote in my Game Scripts recaps after weeks 1 and 2:

Washington finished with a Game Script of -5.8, but even that doesn’t typically justify a 78% pass ratio. That was the most pass-heavy attack in the week (both without adjusting for Game Script and after adjusting), and is a sign of the lack of faith in the team’s ground game. Matt Jones rushed 7 times for 24 yards, Chris Thompson had 4 for 23, and the team’s only other run was a scramble by Cousins for 8 yards on 4th-and-10.

On the pass-heavy side, Washington was at it again. In a game where Washington led for much of the second half before ultimately losing to Dallas, Kirk Cousins had 48 dropbacks (50, if you include the two scrambles), while the team rushed just 17 times (15, if you exclude the two scrambles). Matt Jones wasn’t bad against Dallas, and Cousins wasn’t very good, so it will be interesting to see if anything changes in week 3 against the Giants.

Since then? Well, both teams have seen significant improvements in both quantity and quality on the ground. And now they are are on four game winning streaks after 0-2 starts.  They were the subject of my 538 recap this week:

But it wasn’t just the 0-2 record on the field; the teams looked ugly off the field, too. After the team’s second loss, Buffalo fired offensive coordinator Greg Roman, a move widely viewed as an attempt by head coach Rex Ryan to make Roman into a scapegoat for the team’s problems. In Washington, rumors swirled that the locker room was holding quarterback Kirk Cousins responsible — and that caused head coach Jay Gruden to issue the dreaded vote of confidence for his starter.

Now? Both teams are riding four-game winning streaks and look like playoff contenders. Before this year, only 18 teams in NFL history1 had started a season 0-2 and then won four straight games. Over the past 20 years, this season’s Buffalo and Washington squads are only the fourth and fifth teams to do so. So how did they do it? Although the NFL continues to shift toward the passing game, both teams have zagged and rebounded thanks to their ground game.

You can read the full article here.

{ 3 comments }

Adrian Peterson Was Declining Before His Injury

Adrian Peterson has a torn meniscus, which is expected to keep him out until at least December. Given Peterson’s age — he’s 31, with his half-birthday coming yesterday — it’s reasonable to start thinking about whether the end is near for Peterson.

In his last 8 games (excluding playoffs), he rushed 150 times for 529 yards (3.52) with 5 TDs, one fumble, and 26 first downs. Prior to this stretch, Peterson had averaged 159 carries, 786 yards (4.95), 6.5 TDs, 2.24 fumbles, and 37 first downs. Given his performance in the one playoff game during that stretch (23 for 45 with one fumble), including that would only make the numbers look worse.

I came up with a relatively simple adjusted rushing yards metric to measure running back performance (note that in the formula below, rushing TDs are actually worth 20 yards because all rushing TDs are also rushing first downs):

(rushing yards + rushing first downs * 9 + rushing TDs * 11 – fumbles *30) minus (rush attempts * 5)

This is basically a mix of rush efficiency and rush quantity: we take rushing yards, add some other information, and then provide a penalty for each attempt used. The graph below shows Peterson’s game-by-game results for his career, along with, in black, a trailing-8-game average: [continue reading…]

{ 15 comments }

Running Back Production By Birth Year

Barry Sanders was born in 1968. Emmitt Smith was born in 1969. The next two years were pretty quiet — Dorsey Levens and Garrison Hearst were born in ’70 and ’71 — but business was about to pick up. Terrell Davis and Jerome Bettis were born in 1972, and Curtis Martin, Eddie George, Marshall Faulk, and Priest Holmes were all born in 1973. That’s a 6-year period that gave us some of the most important running backs in NFL history.

And it came at a really important time. Because the previous five years were not nearly as fruitful.

  • In 1967, there were no notable [1]Okay, this sounds kind of mean, but I mean notable in the sense of having historical importance to the game of football. running backs born.
  • In 1966, Thurman Thomas was born, but other than him, not much else.
  • In 1965, there were no notable running backs born.
  • In 1964, Neal Anderson [2]Note that the notable bar is very low. was born and that’s about it.
  • In 1963, Rueben Mayes was the most notable running back born.

[continue reading…]

References

References
1 Okay, this sounds kind of mean, but I mean notable in the sense of having historical importance to the game of football.
2 Note that the notable bar is very low.
{ 6 comments }

David Johnson, Receiving Superstar

The great Chris Wesseling at NFL.com published an article this week about Cardinals running back David Johnson.  The piece contained lofty praise about Johnson’s receiving ability, so much so that it made me want to re-evaluate his rookie stats.

One place where Johnson’s receiving ability stands out is in his yards per reception. As a rookie last year, he became the first player (rookie or otherwise) in 16 years to average 12 yards per reception while gaining at least 400+ rushing yards and 400+ receiving yards.   And just the third in the last 25 years:

 
Games Rushing Receiving
Rk Player Year Age Draft Tm G GS Att Yds Y/A TD Y/G Rec Yds Y/R TD Y/G
1 David Johnson 2015 24 3-86 ARI 16 5 125 581 4.65 8 36.3 36 457 12.69 4 28.6
2 Marshall Faulk* 1999 26 1-2 STL 16 16 253 1381 5.46 7 86.3 87 1048 12.05 5 65.5
3 Garrison Hearst 1998 27 1-3 SFO 16 16 310 1570 5.06 7 98.1 39 535 13.72 2 33.4
4 Gary Anderson 1990 29 1-20 TAM 16 13 166 646 3.89 3 40.4 38 464 12.21 2 29.0
5 Barry Sanders* 1990 22 1-3 DET 16 16 255 1304 5.11 13 81.5 36 480 13.33 3 30.0
6 Albert Bentley 1987 27 2-35 IND 12 4 142 631 4.44 7 52.6 34 447 13.15 2 37.3
7 James Brooks 1986 28 1-24 CIN 16 16 205 1087 5.30 5 67.9 54 686 12.70 4 42.9
8 Gary Anderson 1985 24 1-20 SDG 12 6 116 429 3.70 4 35.8 35 422 12.06 2 35.2
9 Curtis Dickey 1983 27 1-5 BAL 16 16 254 1122 4.42 4 70.1 24 483 20.13 3 30.2
10 Darrin Nelson 1983 24 1-7 MIN 15 9 154 642 4.17 1 42.8 51 618 12.12 0 41.2
11 Joe Cribbs 1981 23 2-29 BUF 15 15 257 1097 4.27 3 73.1 40 603 15.08 7 40.2
12 Billy Sims 1981 26 1-1 DET 14 14 296 1437 4.85 13 102.6 28 451 16.11 2 32.2
13 Billy Sims 1980 25 1-1 DET 16 16 313 1303 4.16 13 81.4 51 621 12.18 3 38.8
14 Wilbert Montgomery 1979 25 6-154 PHI 16 16 338 1512 4.47 9 94.5 41 494 12.05 5 30.9
15 Greg Pruitt 1977 26 2-30 CLE 14 14 236 1086 4.60 3 77.6 37 471 12.73 1 33.6
16 Sherman Smith 1977 23 2-58 SEA 14 14 163 763 4.68 4 54.5 30 419 13.97 2 29.9
17 O.J. Simpson* 1975 28 1-1 BUF 14 14 329 1817 5.52 16 129.8 28 426 15.21 7 30.4
18 Mike Thomas 1975 22 5-108 WAS 14 10 235 919 3.91 4 65.6 40 483 12.08 3 34.5
19 Mack Herron 1974 26 6-143 NWE 14 14 231 824 3.57 7 58.9 38 474 12.47 5 33.9
20 Larry Brown 1973 26 8-191 WAS 14 14 273 860 3.15 8 61.4 40 482 12.05 6 34.4
21 Larry Brown 1972 25 8-191 WAS 12 12 285 1216 4.27 8 101.3 32 473 14.78 4 39.4
22 Cid Edwards 1972 29 SDG 12 12 157 679 4.32 5 56.6 40 557 13.93 2 46.4
23 Carl Garrett 1972 25 3-58 NWE 10 6 131 488 3.73 5 48.8 30 410 13.67 0 41.0
24 Essex Johnson 1972 26 6-156 CIN 14 11 212 825 3.89 4 58.9 29 420 14.48 2 30.0

And while you may remember Johnsons’s game-clinching, 55-yard touchdown catch against the Saints, it wasn’t just one or two catches boosting up his average gain. Consider: there were 40 running backs last year who had at least 25 receptions.  Of that group, only Johnson (58%) converted at least half of his receptions into first downs. To find a player with a better conversion rate, you’d have to go down to Arian Foster, who converted 13 of his 22 catches (59%) into first downs.))

RkPlayerRec1Dratio
1David Johnson362158.3%
2Danny Woodhead803948.8%
3James White401947.5%
4Dion Lewis361747.2%
5Benny Cunningham261246.2%
6Bilal Powell472144.7%
7Mark Ingram502244%
7Ameer Abdullah251144%
9Charles Sims512243.1%
10T.J. Yeldon361541.7%
11Theo Riddick803240%
11Chris Thompson351440%
11Marcel Reece301240%
14James Starks431739.5%
15Giovani Bernard491938.8%
16Duke Johnson622438.7%
16Dexter McCluster311238.7%
18Matt Forte441738.6%
19C.J. Spiller341338.2%
20Darren Sproles552138.2%
21DeAngelo Williams401537.5%
21LeSean McCoy321237.5%
21Fred Jackson321237.5%
24Shane Vereen592237.3%
25Javorius Allen451533.3%
25Chris Ivory301033.3%
27Frank Gore341132.4%
28Lamar Miller471531.9%
29Jonathan Grimes26830.8%
30Doug Martin331030.3%
31Darren McFadden401230%
31Adrian Peterson30930%
33DeMarco Murray441329.5%
34Devonta Freeman732128.8%
35Rashad Jennings29827.6%
36Shaun Draughn27725.9%
37Melvin Gordon33824.2%
38C.J. Anderson25624%
39Latavius Murray41922%
40Justin Forsett31412.9%

It’s obviously premature to talk about Johnson as an all-time great receiving back, despite the quotes in Wesseling’s article. But this gives us something else to keep an eye on in 2016.

{ 3 comments }

Todd Gurley and Rushing TDs on Bad Offenses

Here’s a good article by Matt Harmon presenting the contrarian case against Todd Gurley as a fantasy player. One of Matt’s arguments against Gurley’s fantasy value is that he’s on a bad offense, and his numbers last year were only strong because he scored such a high percentage of St. Louis offensive touchdowns.

That math checks out: Gurley ran for 10 TDs (with no receiving touchdowns), while the Rams scored 27 total offensive touchdowns. That means that Gurley rushing touchdowns made up 37% of all Rams offensive touchdowns, which was the highest rate in the NFL last year, and the highest rate in the NFL in three years. The only other players in shouting range of that number were Adrian Peterson (11/32, or 34% of all Vikings offensive touchdowns) and Devonta Freeman (11/34, of 32% of Falcons touchdowns). [1]Note that if we included receiving touchdowns, Freeman would vault Gurley, as he accounted for 41% of all Atlanta offensive touchdowns.

Another rookie from the SEC holds the modern record in this category. In 1981, South Carolina’s George Rogers was drafted by the Saints, and he led the NFL in rushing yards as a rookie. He also rushed for 13 touchdowns, despite the Saints finishing last in the league in scoring. Rogers rushed for 13 of the team’s 24 offensive touchdowns, or 54%. The table below shows the top 100 seasons by this metric since 1960: [continue reading…]

References

References
1 Note that if we included receiving touchdowns, Freeman would vault Gurley, as he accounted for 41% of all Atlanta offensive touchdowns.
{ 9 comments }

Thomas Rawls and Great Rookie Seasons

Rawls is one of the best running backs to earn a few hundred grand to play for Pete Carroll.

Rawls is one of the best running backs to earn a few hundred grand to play for Pete Carroll.

Thomas Rawls had an incredible rookie season. He was the only player, rookie or veteran, with two games with at least 160 rushing yards in 2015. His heat map was otherworldly, with the highlight being that an astounding 10% of his runs went for at least 15+ yards. And he led the league in yards per carry, as Rawls averaged 5.65 yards per carry while rushing for 830 yards. Rawls ranked 1st in DYAR, 1st in Success Rate, and 2nd in DVOA according to Football Outsiders.

In the historical context, Rawls also stands out. The table below shows all rookies since 1970 with at least 700 rushing yards and 5.00 yards per carry: there are only 18 of those players, and Rawls has the second highest YPC average in the group: [continue reading…]

{ 14 comments }

Running Back Heat Maps – 2015 Season

Last year, I looked at running back heat maps for the 2014 season; that was a fun article, so let’s update those numbers for 2015.

Last season, Adrian Peterson rushed for positive yards on 78.3% of his carries. Of the 44 running backs with at least 100 carries last season, those running backs, on average, rushed for positive yards on on 79.5% of their carries. That means Peterson was at -1% relative to the average running back at running for at least 1 yard.

In general, Peterson was right around average, plus or minus one percent, at rushing for at least 1 yard, at least 2 yards, at least 3 yards, and so on. Where he stood out was at generating long runs: he had 43 carries of at least 10 yards. And while Peterson also led the league in rushing attempts, he far outpaced all other runners in this category: Doug Martin had 33 such carries, Devonta Freeman had 32, and no other runner had 30+ carries of at least 10 yards.

In the picture below, I’ve listed all running backs with at least 100 carries. I have then shown how they fared at rushing for at least 1 yard, at least 2 yards, at least 3 yards,… at least 10 yards, more than 10 yards, at least 15+ yards, and at least 20+ yards. A blue shading is good: that means a player gained yards at a higher clip than average. A red shading is bad, even though this is a heat map, since I think it makes more sense to associate red with bad (if you don’t like the way my brain works, you can let me know in the comments). [continue reading…]

{ 8 comments }

The 1978 Patriots, Part I

Here’s what I wrote in my first post at Football Perspective:

I’ll be blogging about everything football-related, from Jerry Rice to Bobby Douglass, and from the 1978 Patriots to who is the greatest quarterback of all time.

The New England Patriots rushed for 3,165 yards, an NFL record that still stands. Take a look at the individual players on that team:

Games Rushing
No. Age Pos G GS Att Yds ▾ TD Lng Y/A Y/G A/G Fmb
39 Sam Cunningham* 28 FB 16 14 199 768 8 52 3.9 48.0 12.4 4
23 Horace Ivory 24 rb 15 3 141 693 11 28 4.9 46.2 9.4 5
32 Andy Johnson 26 RB 15 13 147 675 3 52 4.6 45.0 9.8 4
14 Steve Grogan 25 QB 16 16 81 539 5 31 6.7 33.7 5.1 9
44 Don Calhoun 26 rb 14 2 76 391 1 73 5.1 27.9 5.4 1
37 James McAlister 27 16 0 19 77 2 16 4.1 4.8 1.2 3
86 Stanley Morgan 23 PR/WR 16 16 2 11 0 6 5.5 0.7 0.1 6
29 Harold Jackson 32 WR 16 13 1 7 0 7 7.0 0.4 0.1 0
30 Mosi Tatupu 23 16 0 3 6 0 3 2.0 0.4 0.2 0
4 Jerrel Wilson 37 P 14 0 1 0 0 0 0.0 0.0 0.1 1
83 Don Westbrook 25 16 0 1 -2 0 -2 -2.0 -0.1 0.1 0
Team Total 26.2 16 671 3165 30 73 4.7 197.8 41.9 35

[continue reading…]

{ 6 comments }
Next Posts Previous Posts