
Frank Gore has had a remarkable career. He’s averaged at least 60 rushing yards per game in 12 different seasons, second only to Emmitt Smith. But it’s also been somewhat remarkable in how unremarkable each season has been: Gore averaged a nondescript 43.4 rushing yards per game as a rookie and then an eye-popping 105.9 rushing yards per game in his second season; since then, for 11 straight years, Gore has averaged between 60 and 80 rushing yards per game. No other player has more than 7 such seasons in their career, let alone consecutive, with Warrick Dunn, Franco Harris, and Ricky Watters tied for second place on the list.
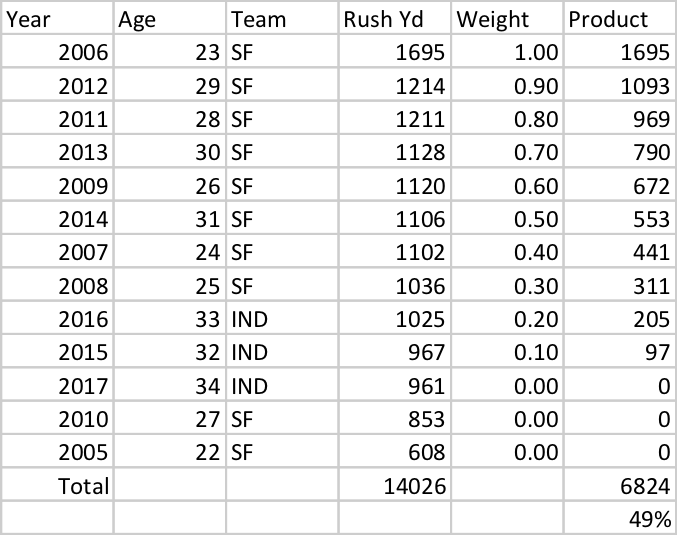
So far, Gore has rushed for 14,026 rushing yards in his career. But I wanted to try to identify similar — and dissimilar — rushers to Gore. So here’s what I did: for each running back, I identified his rushing yards in each season of his career. For seasons where the league had fewer than 16 team games per season, I pro-rated that player’s production as if the league had 16 games. So players in a 14-game season get their rushing yards bumped by 14.3%, regardless of how many games they played. Then, I gave a player 100% credit for their best rushing season, 90% credit for their second best rushing season, 80% credit for their third best rushing season, and so on. Doing this gives Gore just 6,824 rushing yards, just under half of his actual total.
Now why would we do this? So we can compare him to other players. Take a look at Shaun Alexander, who had five seasons with over 80 rushing yards per game but fewer rushing yards than Gore, because he had just one season in his career with between 60 and 80 rushing yards per game.

Gore has more than 5,000 more rushing yards than Alexander, but fewer adjusted rushing yards than him using this metric. So, whether you like or dislike this metric, I think it can be a useful tool to identify players whose careers were short but all prime (like Alexander) and players who were consistent producers over long stretches.
I looked at Hall of Fame running backs, leaders in career rushing yards, and leaders in career rushing yards per game to get a list of over 70 running backs. In that group, Gore’s 49% number — the ratio between his weighted rushing yards and his actual rushing yards — is the third lowest. The only two lower are Smith, who has five seasons over over 900 rushing yards that get reduced to almost nothing, and a 49ers running back who is in the Hall of Fame.
Here’s how to read the table below. Gore ranks 3rd in Ratio (the 49% number), the statistic by which the table is sorted. Gore has 14,026 career rushing yards, which ranks 6th on this list (it ranks 5th on the real list, but Jim Brown — who played in the era of 12- and 14-game seasons — moves ahead of him once we pro-rated for number of team games played). He has 6,824 weighted rushing yards, which ranks 25th, and the final column shows the ratio of his weighted and actual rushing yards.
| Ratio Rk | Rusher | Rush Yd | Rush Yd Rk | Weighted RY | Wtd RY Rk | Ratio |
|---|---|---|---|---|---|---|
| 1 | Emmitt Smith | 18355 | 1 | 8436 | 5 | 46% |
| 2 | Joe Perry | 12641 | 14 | 6068 | 38 | 48% |
| 3 | Frank Gore | 14026 | 6 | 6824 | 25 | 48.7% |
| 4 | Marcus Allen | 12835 | 12 | 6270 | 35 | 48.8% |
| 5 | John Riggins | 12447 | 15 | 6227 | 37 | 50% |
| 6 | Franco Harris | 13489 | 10 | 6836 | 24 | 50.7% |
| 7 | Walter Payton | 17785 | 2 | 9068 | 3 | 51% |
| 8 | Jerome Bettis | 13662 | 8 | 7297 | 13 | 53.4% |
| 9 | Tony Dorsett | 13493 | 9 | 7317 | 12 | 54.2% |
| 10 | Warrick Dunn | 10967 | 23 | 6045 | 40 | 55.1% |
| 11 | Curtis Martin | 14101 | 5 | 7871 | 9 | 55.8% |
| 12 | Marshall Faulk | 12279 | 16 | 6892 | 22 | 56.1% |
| 13 | Thurman Thomas | 12074 | 19 | 6961 | 20 | 57.7% |
| 14 | Earnest Byner | 8290 | 47 | 4830 | 65 | 58.3% |
| 15 | Steven Jackson | 11438 | 21 | 6673 | 29 | 58.3% |
| 16 | Barry Sanders | 15269 | 3 | 9085 | 2 | 59.5% |
| 17 | Fred Taylor | 11695 | 20 | 6970 | 19 | 59.6% |
| 18 | Lenny Moore | 6395 | 65 | 3812 | 74 | 59.6% |
| 19 | Thomas Jones | 10591 | 27 | 6342 | 34 | 59.9% |
| 20 | LaDainian Tomlinson | 13684 | 7 | 8305 | 7 | 60.7% |
| 21 | Larry Csonka | 9071 | 40 | 5537 | 50 | 61% |
| 22 | Matt Forte | 9796 | 36 | 6040 | 41 | 61.7% |
| 23 | Ricky Watters | 10643 | 25 | 6596 | 30 | 62% |
| 24 | Hugh McElhenny | 6852 | 60 | 4260 | 72 | 62.2% |
| 25 | Edgerrin James | 12246 | 18 | 7710 | 10 | 63% |
| 26 | Corey Dillon | 11241 | 22 | 7077 | 16 | 63% |
| 27 | John Henry Johnson | 8311 | 46 | 5239 | 58 | 63% |
| 28 | Freeman McNeil | 8721 | 41 | 5498 | 51 | 63% |
| 29 | Ottis Anderson | 10730 | 24 | 6804 | 27 | 63.4% |
| 30 | Jim Brown | 15034 | 4 | 9694 | 1 | 64.5% |
| 31 | Roger Craig | 8243 | 50 | 5326 | 54 | 64.6% |
| 32 | DeAngelo Williams | 8096 | 53 | 5250 | 56 | 64.8% |
| 33 | Marshawn Lynch | 10003 | 33 | 6510 | 32 | 65.1% |
| 34 | Herschel Walker | 8284 | 49 | 5396 | 52 | 65.1% |
| 35 | Eric Dickerson | 13345 | 11 | 8733 | 4 | 65.4% |
| 36 | Ricky Williams | 10009 | 32 | 6586 | 31 | 65.8% |
| 37 | Willis McGahee | 8474 | 44 | 5587 | 48 | 65.9% |
| 38 | Ollie Matson | 6743 | 62 | 4464 | 70 | 66.2% |
| 39 | Eddie George | 10441 | 29 | 6915 | 21 | 66.2% |
| 40 | LeSean McCoy | 10092 | 31 | 6688 | 28 | 66.3% |
| 41 | O.J. Simpson | 12691 | 13 | 8412 | 6 | 66.3% |
| 42 | Terry Allen | 8614 | 42 | 5721 | 47 | 66.4% |
| 43 | Adrian Peterson | 12276 | 17 | 8201 | 8 | 66.8% |
| 44 | Jim Taylor | 10168 | 30 | 6881 | 23 | 67.7% |
| 45 | Jamal Lewis | 10607 | 26 | 7223 | 15 | 68.1% |
| 46 | Floyd Little | 7226 | 56 | 5052 | 62 | 69.9% |
| 47 | Ahman Green | 9205 | 39 | 6441 | 33 | 70% |
| 48 | Tiki Barber | 10449 | 28 | 7341 | 11 | 70.3% |
| 49 | Chris Johnson | 9651 | 37 | 6814 | 26 | 70.6% |
| 50 | Gerald Riggs | 8479 | 43 | 5987 | 43 | 70.6% |
| 51 | Leroy Kelly | 8313 | 45 | 5881 | 45 | 70.7% |
| 52 | Clinton Portis | 9923 | 34 | 7026 | 17 | 70.8% |
| 53 | Maurice Jones-Drew | 8167 | 52 | 5922 | 44 | 72.5% |
| 54 | Steve Van Buren | 8289 | 48 | 6017 | 42 | 72.6% |
| 55 | Rodney Hampton | 6897 | 59 | 5078 | 61 | 73.6% |
| 56 | Earl Campbell | 9825 | 35 | 7241 | 14 | 73.7% |
| 57 | Priest Holmes | 8172 | 51 | 6050 | 39 | 74% |
| 58 | Shaun Alexander | 9453 | 38 | 7015 | 18 | 74.2% |
| 59 | Marion Motley | 5826 | 69 | 4339 | 71 | 74.5% |
| 60 | George Rogers | 7633 | 54 | 5726 | 46 | 75% |
| 61 | Robert Smith | 6818 | 61 | 5243 | 57 | 76.9% |
| 62 | DeMarco Murray | 7174 | 57 | 5544 | 49 | 77.3% |
| 63 | Curt Warner | 6910 | 58 | 5394 | 53 | 78.1% |
| 64 | Travis Henry | 6086 | 68 | 4850 | 64 | 79.7% |
| 65 | Ray Rice | 6180 | 67 | 4968 | 63 | 80.4% |
| 66 | Arian Foster | 6527 | 63 | 5287 | 55 | 81% |
| 67 | William Andrews | 6432 | 64 | 5219 | 59 | 81.2% |
| 68 | Gale Sayers | 5664 | 70 | 4601 | 67 | 81.2% |
| 69 | Terrell Davis | 7607 | 55 | 6241 | 36 | 82% |
| 70 | Larry Johnson | 6223 | 66 | 5133 | 60 | 82.5% |
| 71 | Billy Sims | 5603 | 71 | 4659 | 66 | 83.1% |
| 72 | Le'Veon Bell | 5336 | 73 | 4473 | 69 | 83.8% |
| 73 | Doug Martin | 4633 | 74 | 3886 | 73 | 83.9% |
| 74 | Willie Parker | 5378 | 72 | 4520 | 68 | 84% |
The table above is fully sortable and searchable. You can see that among players in the top 15 in weighted career rushing yards but who were mostly prime are Tiki Barber (28th and 11th), O.J. Simpson (13th and 6th), and Adrian Peterson (17th and 8th). Peterson, of course, is a contemporary of Gore’s who is going to wind up losing the race for most career rushing yards to Gore in a very tortoise/hare fashion.
What stands out to you?