
Three years ago, I looked at the single-season leaders in percentage of team rushing yards. Then and now, the top two seasons belonged to Edgerrin James: he had 94% and 92% of the Colts rushing yards in his first two seasons in the league. There were only three other seasons where a running back had at least 90% of his team’s rushing yards: Emmitt Smith in 1991, Barry Sanders in 1994, and … Travis Henry in 2002. In that post, I calculated for each team the percentage of his team rushing yards gained by that team’s top rusher. Then I calculated the league average percentage gained by each team’s top rusher, and plotted how that varied over time. This was intended to measure how running back back committee centric the league was in each year.

For a less rigorous method to measure RBBC-ness, you can see this post, which looked at games with more than 15 carries.

Both methods show RBBC being heavy in the ’70s, and the stud RB era peaking about 10 years ago. But if you want to measure rushing concentration, a better method is probably to use the formula described yesterday. So for each team, I calculated the percentage of team rushing yards gained by every player on the team, squared that result, and then summed those numbers for each player on the team. You can read yesterday’s post for more info on the methodology, but here were the results for 2016:
| Rk | Tm | Rush Yds | Sqrd |
|---|---|---|---|
| 1 | CHI | 1737 | 59.06% |
| 2 | PIT | 1779 | 54.76% |
| 3 | ARI | 1735 | 52.71% |
| 4 | LAR | 1253 | 52.43% |
| 5 | MIA | 1825 | 50.86% |
| 6 | DAL | 2398 | 48.95% |
| 7 | SDG | 1514 | 46.23% |
| 8 | NOR | 1742 | 45.88% |
| 9 | IND | 1629 | 45.14% |
| 10 | TEN | 2189 | 42.14% |
| 11 | NWE | 1872 | 41.97% |
| 12 | ATL | 1930 | 39.57% |
| 13 | HOU | 1862 | 39.46% |
| 14 | CLE | 1712 | 36.99% |
| 15 | NYJ | 1806 | 36.88% |
| 16 | BAL | 1492 | 34.42% |
| 17 | KAN | 1758 | 33.29% |
| 18 | BUF | 2634 | 32.96% |
| 19 | MIN | 1205 | 32.03% |
| 20 | SFO | 2019 | 31.53% |
| 21 | CIN | 1777 | 30.82% |
| 22 | NYG | 1421 | 29.81% |
| 23 | WAS | 1698 | 29.48% |
| 24 | OAK | 1933 | 29.17% |
| 25 | CAR | 1814 | 28% |
| 26 | DEN | 1484 | 27.78% |
| 27 | PHI | 1813 | 23.44% |
| 28 | TAM | 1616 | 22.71% |
| 29 | JAX | 1633 | 22.01% |
| 30 | DET | 1310 | 21.2% |
| 31 | SEA | 1591 | 18.56% |
| 32 | GNB | 1703 | 18.44% |
Obviously injuries, rest, and suspension, can significantly impact the data here: Le’Veon Bell missed 4 games last season, or else the Steelers would be number one on this list by a mile. In the 12 games that Bell played in, he was responsible for over 90% of Pittsburgh’s rushing yards. [1]At this point, I should probably note that I zero out all negative rushing yards. Bell had 91.2% of Pittsburgh’s rushing yards during these 12 games, although that drops to 90.3% once you zero … Continue reading Remarkably, the Steelers had a rushing concentration index of 81.95% in the 12 games where Bell was active. And, for what it’s worth, some adjustments for the Bears and Jordan Howard makes sense, too. Howard didn’t play in week 1 and only started the final 13 games of the year. Over those games, he had 80.7% of the Bears rushing yards and Chicago had a rushing concentration index of 66.2%.
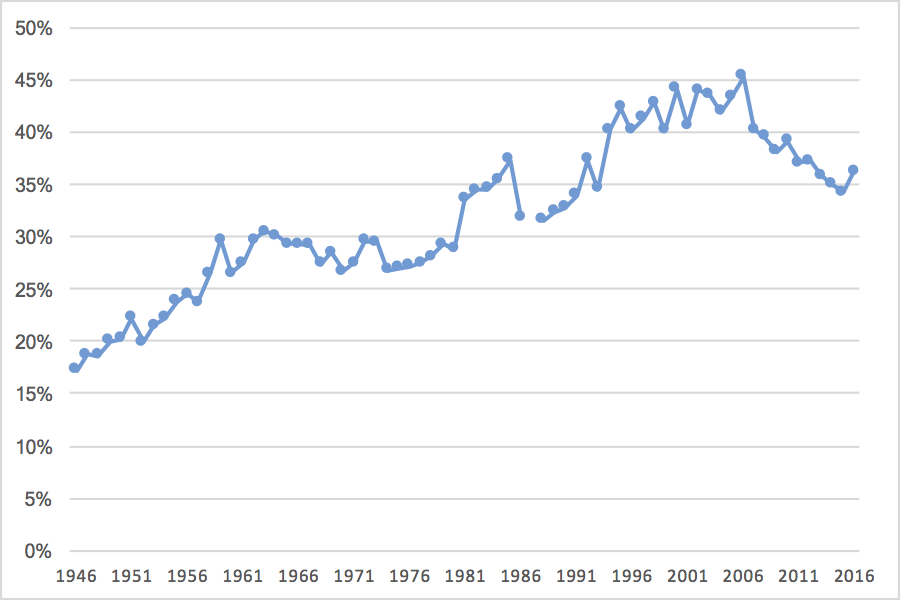
But let’s get to the meat of today’s post: what about the variation in average, league-wide rushing concentration over history? Well, take a look:
Tiki Barber is, by far, the all-time leader in yards from scrimmage for the five year period covering a player’s age 27 through age 31 seasons. But he’s also the all-time leader in rushing yards covering those ages, and by a pretty large margin, too. Tiki was great, and he deserves a lot of credit for staying healthy and enduring such a heavy workload. But it does feel a bit like he put those numbers up in an inflated era: Barber’s age 27-31 seasons came from ’02 to ’06, the height of the stud RB era. But it’s not like Barber was a fraud: he and LaDainian Tomlinson were the top two running backs over that five year period.
As to the bigger point? This methodology indicates that running back by committee was gradually phased out over the course of NFL history, rather than some of the bumpier-looking data from prior graphs. I’m not sure which one is “right” but it’s always interesting to see the results when using different methods. The other thing that’s clear: the stud RB era peaked in ’06, and then declined over the last decade. Last year saw a reversal: we’ll have to wait a few years to see if that was the start of a trend, or just an outlier. [2]Another note: this methodology looks at rushing by all players, including quarterbacks. So that does add another level of complexity to the analysis.
References
| ↑1 | At this point, I should probably note that I zero out all negative rushing yards. Bell had 91.2% of Pittsburgh’s rushing yards during these 12 games, although that drops to 90.3% once you zero out all negative rushing yards. But since you need to square the results and calculate the percentage of team rushing yards, I think it makes sense to eliminate all negative rushing totals. |
|---|---|
| ↑2 | Another note: this methodology looks at rushing by all players, including quarterbacks. So that does add another level of complexity to the analysis. |