by Chase Stuart
on July 26, 2013
Manning's worst statistical performance.
Scott Kacsmar
recently wrote about how
Daunte Culpepper had the worst performance of his career in his biggest game. In his only
NFC Championship Game appearance, Culpepper went 13-of-28 for 78 yards with three interceptions and four sacks. Which made me wonder: how many other great quarterbacks have had their worst game in the playoffs?
I’ll define worst game using the methodology from my Greatest QB of All-Time series This means I will calculate each quarterback’s ANY/A and compare it to league average for that season.
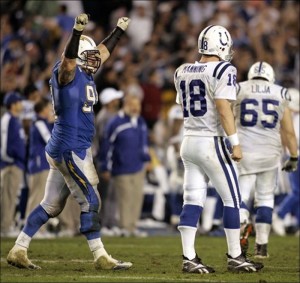
For example, Peyton Manning‘s worst game came in November 2007 against the Chargers. He threw for 328 yards and 2 touchdowns, but that came on 58 dropbacks and with six interceptions. He averaged 1.44 ANY/A that game, in a season where the league average was 5.52 ANY/A. That means Manning was 4.08 ANY/A below average on 58 pass plays, which gave him 239 Adjusted Net Yards below average. The table below shows some of the top quarterbacks in NFL history and which games were their worst. For quarterbacks like Johnny Unitas and Bart Starr, the records are incomplete, as our individual games database only goes back to 1960. The “VALUE” column shows how many Adjusted Net Yards each quarterback was below average.
[continue reading…]
Tagged as:
Craig Morton,
Daunte Culpepper,
Y.A. Tittle
{ }
by Chase Stuart
on June 11, 2013
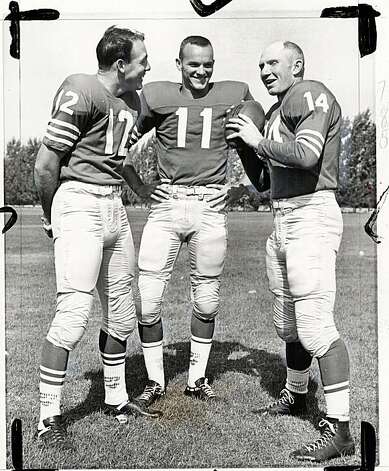
Brodie (left) and Tittle (right) on the 49ers. Photo by Associated Press/1960 Photo: 1960, Associated Press.
Entire
books have been written about the
West Coast Offense. Friend of the program Chris Brown has an
excellent primer on some of the principles of the system. Due to time constraints, this post is
not going to dissect a
voluminous playbook, translate
Spider 3 Y Banana into English, or discuss the role of motions or shifts in the offense. This post will not help you
find the winning edge.
I thought it would be interesting to see if certain statistics could help identify teams that ran a West Coast Offense. My initial thought was that an effective West Coast Offense would manifest itself in three key statistics:
- Completion percentage. The WCO is built around short passes that work as a substitute for running plays. These long handoffs lead to high completion percentages for the quarterback.
- Yards per completion. Short passes imply lower yards per completion. Ideally, we’d analyze yards per completion after removing yards after the catch, but that’s not something the NFL kept records of historically. Still, I think a low yards per completion average can be a good indicator that a team ran a West Coast Offense.
- Passing first downs. In a West Coast Offense, teams are moving the chains through the air. With fewer long gains and a pass-first mentality, one would expect a lot of passing first downs.
Background
If you’re a historian, you can skip this section. The classic story told about the birth of the West Coast Offense takes us back to before the AFL-NFL merger. In 1969, the Bengals had Paul Brown as head coach and Bill Walsh as the assistant coach/offensive coordinator. That year, quarterback Greg Cook had one of the great rookie seasons in history, but injuries to his rotator cuff and biceps ruined his career. The team turned to backup Virgil Carter, a very smart and accurate passer but who was destined to be a backup because of his size and weak arm. Those factors led Walsh and Brown to implement an offense that catered to Carter’s strengths and hid his weaknesses.
Carter wasn’t just smart for football. In 1970, he published a seminal paper that was the precursor to the Expected Points models we see today; in ’71, Carter led the NFL in completion percentage, but ranked third to last among the 21 qualifying quarterbacks in yards per completion. The Bengals ranked 9th in passing first downs, and those statistics seem to jive with the picture we all have in our heads of a West Coast Offense.
[continue reading…]
Tagged as:
49ers,
Bill Walsh,
Frankie Albert,
John Brodie,
West Coast Offense,
Y.A. Tittle
{ }

