≡ Menu

Yesterday, I reviewed how the Jets defense performed in 2012 and previewed the team’s outlook for 2013. Today, the heavy lifting begins, by looking at the offense. If you didn’t feel bad for Tony Sparano before this post, I can guarantee you will by the end of it.

Quarterback

There is no point in ignoring the elephant in the room, so let’s just get it out of the way: Mark Sanchez is a below-average starting quarterback and not the answer for the Jets. After committing 26 turnovers in 2011, Sanchez laughed in the face of regression to the mean and matched that number on fewer plays in 2012. Sanchez also turned the ball over 23 times in his rookie season, leaving 2010 (14 turnovers) as his only season with fewer than 20 turnovers. To be fair, every hand that touched the 2012 Jets passing game deserved criticism, as Sanchez received almost no support from his teammates or coaches.

The past, not the future.

The past, not the future.

Still, the quarterback gets the credit and the blame, and there’s no escaping the fact that Sanchez ranked 30th in Net Yards per Attempt over the last two seasons, a disproportionate performance compared to his bloated salary. [1]Among Jets fans, there is some argument that Sanchez used to be good but now is struggling; that’s not really the case. In 2010, the year the Jets went 11-5 and made it to the AFC Championship … Continue reading There are some creative things the Jets could do to lessen his salary cap hit in 2013, but that just delays the bill to 2014. Currently, Sanchez will count for $12.9M against the cap next season, and would count for $17.2M (yes, that means $4.3M of dead money) if released. While it’s not impossible that the Jets could trade him, I’m going to ignore that option for this post. The other problem? His cap hits are $13.1M and $15.6M in 2014 and 2015. You probably didn’t know that — heck you probably thought he was a free agent after 2013 — because it’s so far out of the realm of possibility that Sanchez would be on the team in 2014 that no one mentions it. But as a technical matter, Sanchez is signed through 2016 at superstar quarterback money, and the most likely scenario is the Jets cut him after 2014 (leaving $4.8M in dead money but still saving $8.3M on the cap).

The fact that his contract runs through 2016 is more important than you might think. Even under the best case possible, pigs flying 2013 scenarios, Sanchez still won’t be worth $29M in 2014 and 2015. Sanchez would have to turn in a season like Aaron Rodgers in 2013 to make the Jets want to keep him at his current contract (which, if he played at such a level, he’d have no incentive to restructure) after this season.
[continue reading…]

References

References
1 Among Jets fans, there is some argument that Sanchez used to be good but now is struggling; that’s not really the case. In 2010, the year the Jets went 11-5 and made it to the AFC Championship Game, Sanchez ranked 29th out of 32 quarterbacks in Net Yards per Attempt and 24th in ANY/A. Now he tied Matt Ryan for the NFL lead with 6 game-winning drives that season — no asterisk there, this actually happened — but that only served to obfuscate the fact that Sanchez struggled on a play-by-play basis. Sanchez actually peaked in NY/A rank as a rookie in 2009, finishing 21st, although he ranked 27th in ANY/A.
{ 14 comments }

The Packers could not stop the Pistol offense.

The Packers could not stop the Pistol offense.

I have not done a good job fulfilling my pledge to point you in the direction of good football articles. But here’s a great interview by Jerry McDonald of the San Jose Mercury News with former Nevada head coach Chris Ault. Ault is the pioneer of the Pistol Offense, and his prized pupil was last seen rushing for 181 yards against the Packers on Saturday night. The whole article is worth a read, but here are some good excerpts:

Q: How similar was the stuff the 49ers were running to what you ran for Kaepernick at Nevada?

Ault: The read plays that they’re running, that’s what we ran. That’s what we did and what we still do. The play-action passes, which I was really excited to see out of the pistol, are things that we did here in Kaep’s senior year. The routes, I can’t tell you the routes are the same, but I thought that was the one thing I had not seen the Niners do, that I saw the Redskins do, was throw the ball with play-action out of the pistol. I thought the play-action passing really helped with the read itself out of the pistol.
[continue reading…]

{ 5 comments }

Outlook for the 2013 Jets: Part I (The defense)

Have you seen my new tattoo?

Have you seen my new tattoo?

In the preseason, I provided an in-depth preview of the 2012 New York Jets. By mid-season, I questioned the track records of Mike Tannenbaum, Rex Ryan, and Mark Sanchez and wondered whether or not they should (and would) be back in 2013. As we now know, after the season Tannenbaum was fired, Ryan was retained, and Sanchez remains on the roster in a salary cap-induced purgatory.

In this post, I’m going to review the Jets defense, analyze how they performed in 2012, and examine the outlook for 2013. Let’s start with one of the strengths of the team:

Defensive Line

I thought the defensive line would be very good in 2013, and they largely met expectations. Muhammad Wilkerson was the best 3-4 defensive end in the league outside of J.J. Watt, and Wilkerson looks to be a perennial Pro Bowler. At the other end spot, the Jets rotated first round pick Quinton Coples with incumbent Mike DeVito. Coples delivered as a pass rusher while DeVito was stout as usual against the run. And while DeVito is an unrestricted free agent and could follow Mike Pettine to Buffalo (although rumor is he wants to stay), Coples has the ability to develop into an every-down player as early as next year. The Jets don’t have anything behind Wilkerson and Coples, but depth can be addressed.
[continue reading…]

{ 4 comments }

It’s Christmas in January. Once the 2012 All-Pro teams were announced (my thoughts here), my buddies Mike Kania and Neil Paine worked through the weekend to provide us with Approximate Values for every player in the NFL this year. For the uninitiated, you can review how AV is calculated here. And if you’re so inclined, give a thanks to Neil or Mike or PFR on twitter.

Here’s a list of the top 100 players. AV is also listed for each player on each team’s roster page on PFR (for Dallas, it’s Tony Romo). You can use the PFR player finder for all sorts of AV-related fun, too. For example, you could see the player with the most AV on your favorite team (for the Jets, it’s Antonio Cromartie), or by position (among inside linebackers, it’s Patrick Willis), or by age (among those 35 or older, it’s Tom Brady, or Tony Gonzalez for non-quarterbacks), or by draft status (Wes Welker had the highest AV in 2012 among undrafted players).

Here’s a list of the top 20 players by AV.

RkPlayerAgeTmGAV
1Tom Brady35NWE1618
2Robert Griffin III22WAS1518
3Adrian Peterson27MIN1618
4Matt Ryan27ATL1618
5Aaron Rodgers29GNB1617
6Cam Newton23CAR1616
7Russell Wilson24SEA1616
8Drew Brees33NOR1615
9Marshawn Lynch26SEA1615
10Eli Manning31NYG1615
11Peyton Manning36DEN1615
12Alfred Morris24WAS1615
13Julius Peppers32CHI1615
14J.J. Watt23HOU1615
15Wes Welker31NWE1615
16Andre Johnson31HOU1614
17Calvin Johnson27DET1614
18Doug Martin23TAM1614
19Tony Romo32DAL1614
20Roddy White31ATL1614
{ 12 comments }

Reviewing the Divisional Round of the Playoffs

The Best Weekend of the Year lived up to its reputation this weekend, as the divisional round of the playoffs gave us three outstanding games. Here is my reaction, with a disproportionate amount of time spent on the Denver-Baltimore game, because, well, if you saw it, you’d understand.

Baltimore 38, Denver 35

One of the best playoff games in NFL history, and an instant classic. This game could be analyzed for hours and there are countless talking points (Fox playing not to lose, Manning’s playoff failures, Ray Lewis’ retirement tour making at least one last stop, Tim Tebow anyone?) that will fill up the schedules of ESPN and talk radio for weeks. But let’s start with a big picture review of the game from the perspective of the team I expected to win the Super Bowl.

If you want to assign credit and blame to Denver, this is how I would rank the five Broncos units on Saturday, from best to worst.

1) Special teams. Sure, Matt Prater missed a long field goal, but Trindon Holliday’s two return touchdowns were a thing of beauty — especially for fans of excellent blocking. Holliday’s runs were more about textbook blocking by the return unit and poor coverage by the Ravens than Holliday himself, but in any event, the Broncos special teams had a great day. In fact, here is how Pro-Football-Reference broke down the game by unit in terms of Expected Points Added:
[continue reading…]

{ 29 comments }

Yesterday, I previewed Saturday’s games with um, mixed results (skip the Denver-Baltimore preview and just read the San Francisco-Green Bay breakdown twice). Let’s take another crack at it by examining Sunday’s matchups.

Seattle Seahawks (11-5) (+1) at Atlanta Falcons (13-3), Sunday, 1:00PM ET

An offense where the star eats Skittle is a young one

Did you know Marshawn Lynch eats Skittles?

Once again, Atlanta is tasked with facing a dominant wildcard team. Is this the year Matt Ryan finally silences his critics?

Atlanta is only a one-point favorite, just the seventh time a home team has been given such little respect this late in the season since 2000. Home teams are 3-3 when underdogs or small favorites over that span in the divisional conference championship rounds, although one of those losses came by the Falcons in 2010 against the Packers when Atlanta was a 1.5-point favorite. But let’s focus on these two teams, because the stats might surprise you.

Russell Wilson edges Matt Ryan in Y/A (7.9 to 7.7), AY/A (8.1 to 7.7), and passer rating (100.0 to 99.1), despite having a significantly worse set of receivers. Ryan does have the edge in NY/A (7.0 to 6.8) but the two are deadlocked in ANY/A at 7.0. Both quarterbacks led four 4th quarter comebacks this year, and Wilson led 5 game-winning drives while Ryan led six. Considering one quarterback has Roddy White, Julio Jones, and Tony Gonzalez, and the other is a 5’10 rookie, I consider this pretty remarkable.
[continue reading…]

{ 5 comments }

Trindon Holliday’s perfect season: can he go 19-0?

Holliday went 11-0 with the Broncos in the regular season.

Holliday went 11-0 with the Broncos in the regular season.

I was going to save this post for later today if the Broncos won, but seeing as how Trindon Holliday just set a playoff record with the longest punt return touchdown in post-season history, the timing feels more appropriate now. Holliday was a sixth round pick of the Houston Texans in 2010. At 5-5, many viewed him too short to be effective in the NFL, but the Texans saw potential in him as returner (he led the SEC in punt return average in 2009 at LSU). Holliday didn’t make an instant impact, but the shortest player in the NFL in 25 years is trying to vault one of the biggest hurdles in the game: a 19-0 season.

Holliday led the NFL in punt return yards this season and finished the year 16-0. Wearing #16, Holliday gained 341 all-purpose yards in five games with Houston before the Texans decided that he wasn’t providing a big enough spark in the return game. The Broncos quickly scooped him up, and the Broncos finished the year 11-0. That gave Holliday a perfect 16-0 season. According to my data, no player has ever gone 19-0 in a season. Can Holliday become the first?

{ 4 comments }

Here are the selections:

Some quick thoughts: [continue reading…]

{ 6 comments }

I was on vacation last week, so I provided just a bare bones set of NFL playoff predictions. Technically, my picks went 4-0 on Wildcard Weekend, but that doesn’t count for much when you pick the favorite in every game. With a little more time on my hands, here’s an in-depth preview of Saturday’s games. Tomorrow I’ll be previewing Sunday’s action.

Baltimore Ravens (10-6) (+9.5) at Denver Broncos (13-3), Saturday 4:30PM ET

Manning looks for to win another Super Bowl

Manning points to his glove dealer.

Most of the signs in this game point squarely in the favor of Peyton Manning and the Broncos. Baltimore has wildly underachieved on the road the last few seasons, and in Denver does not seem like the optimal place for that trend to reverse itself. From 2002 to 2010, Manning went 8-0 against the Ravens, including a 2-0 mark in playoff games. If you double his numbers in those games (to approximate a 16-game season), Manning would have thrown for 4,044 yards and 28 touchdowns against just 12 interceptions, while averaging 7.8 Y/A and 7.9 AY/A to go with a 65.6% completion rate and a 97.7 passer rating. Manning was similarly lethal in Denver’s win over the Ravens in Baltimore earlier this year.
[continue reading…]

{ 1 comment }

Regular readers surely recall my “What are the Odds of That” post from this summer. In that article, I referenced an obscured Jacoby Jones stat: in 2011, he gained three times as many receiving yards against teams at the back end of the alphabet as he did against the teams he faced in the front of the alphabet. Then I asked, “what are the odds of that?”

This is a very good reason why it’s often inappropriate to apply standard significance tests to football statistics. Surely Jones’ splits would pass any standard significance test, signaling that his wild split was in fact “real” even though we know it wasn’t. With a large enough sample, you would expect to have false positives, which isn’t a knock on standard significant testing. If something is statistically significant at the 1% level, that doesn’t mean you shouldn’t expect to see a false positive if you have 100 different samples…

Some in the statistical community refer to this as the Wyatt Earp Effect. You’ve undoubtedly heard of Wyatt Earp, who is famous precisely because he survived a large number of duels. What are the odds of that? Well, it depends on your perspective. The odds that one person would survive a large number of duels? Given enough time, it becomes a statistical certainty that someone would do just that. Think back to the famous Warren Buffett debate on the efficient market hypothesis. Suppose that 225 million Americans partake in a single elimination national coin-flipping contest, with one coin flip per day. After 20 days, we would expect 215 people to successfully call their coin flips 20 times out of 20. But that doesn’t mean those 215 people are any better at calling coins than you or I am. The Wyatt Earp Effect, the National Coin Flipping Example, and my Splits Happen post all illustrate the same principle. Asking “what are the odds of that?” is often meaningless in retrospect. If you look at enough things, enough players’ splits, enough 4th quarter comeback opportunities, enough coin flips, or enough roulette wheel spins, you will see some things that seem absurdly unlikely.

In December, I highlighted Matt Schaub’s struggles in night games compared to day games as yet another example. Well now, Ray Rice is the latest protagonist in What are the Odds of That? In case you missed it, Rice fumbled twice in Baltimore’s playoff win over Indianapolis, with the Colts recovering both times. Rice has struggled with fumbles in the playoffs in the past, but he’s always been outstanding during the regular season at holding on to the ball. In 2012, he lost just one fumble — which went harmlessly out of bounds — giving him a clean record for the season. So what’s going on? Here’s what Bill Barnwell wrote earlier this week:
[continue reading…]

{ 5 comments }

Matt Ryan is about to throw a touchdown or an interception, depending upon the month

Matt Ryan is about to throw a touchdown or an interception, depending upon the month.

For the second time in three years, the Atlanta Falcons are the NFC’s number one seed. Just like in 2010, the Falcons started this season 13-2 but ended the year with only 11 Pythagorean wins. In 2010, Atlanta lost its first game to the #6 seed Packers, who sported the highest SRS of any NFC team in 2010. This year, Atlanta hosts the #6 seed Seahawks, who finished 2012 with highest SRS of any NFC team. History suggests that this is a difficult challenge for Atlanta, regardless of the Falcons’ lofty record.

One of the obvious topics the mainstream media has hit on this week has been Matt Ryan’s inability to win in the playoffs. As everyone knows, Atlanta is 0-3 in the playoffs in the Mike Smith/Matt Ryan era. As Ryan prepares for his fourth playoff start on Sunday, history offers some comfort: four other quarterbacks (since 1950) have been in exactly the same situation, entering their fourth playoff start with an 0-3 record. Those quarterbacks went 3-1 in their fourth game. Let’s stroll down memory lane.

  • At age 37, Y.A. Tittle and the New York Giants went to Soldier Field to battle the famed 1963 Bears. Tittle had gone 0-3 in his previous three NFL playoff games, and had lost his lone playoff game in the AAFC, too. In 1957, Tittle was on the wrong side of the most famous comeback in playoff history prior to Bills/Oilers. In that game, Tittle threw three touchdowns against the Lions as San Francisco opened up what looked to be an insurmountable 27-7 lead. But Tittle finished the day with three interceptions, and the Lions came back and won, 31-27. In 1961, Tittle was with the Giants, and was part of an embarassing 37-0 shutout on the quite literal frozen tundra of Lambeau Field. Tittle was a miserable 6/20 for 65 yards with 4 interceptions. The next year, the Giants and Packers met again, this time at a frozen and windy Yankee Stadium, with the Packers again topping the Giants. [1]This was the first game Ed Sabol filmed for the NFL, under the label Blair Motion Pictures. So you can imagine that when Tittle and the Giants had to travel to Soldier Field in 1963 — the Giants third straight year in the title game — Tittle probably carried the choker label. With a wind chill of -11 degrees, the weather was again miserable, and the result was more of the same for Tittle and New York. The Giants lost 14-10, and Tittle threw 1 touchdown against 5 interceptions.
  • Jack Kemp took the Chargers to the AFL title game in the league’s first two seasons. On New Year’s Day 1961, Kemp was outplayed by Houston’s George Blanda, and Billy Cannon put the final nail in the coffin as the Oilers won, 24-16. The Oilers and Chargers met again in the title game the following year — this time in San Diego — but Kemp had a miserable game, throwing 4 interceptions as the Chargers lost, 10-3. By 1963, Kemp was with the Bills, and Buffalo had finished the year tied with the Patriots, setting up a one-game playoff for the division title at War Memorial Stadium. But Kemp struggled and was benched for Daryle Lamonica at halftime, as the Bills lost 26-8. In 1964, the Bills went 12-2, and entered the AFL title game against Kemp’s old team, San Diego. At this time, Kemp had an 0-3 post-season record, and surely Chargers fans taunted the citizens of Buffalo by calling Kemp the Mayor of Chokesville. While Kemp did not produce stellar numbers, the Bills managed to defeat the Chargers and capture their first AFL championship. The hero of the game may have been Mike Stratton, who produced the “hit heard round the world” early in the game, knocking out San Diego’s Keith Lincoln. In any event, the Mayor of Chokesville was able to abdicate his throne.
  • [continue reading…]

References

References
1 This was the first game Ed Sabol filmed for the NFL, under the label Blair Motion Pictures.
{ 5 comments }

Checkdowns: Deja vu for the Falcons?

Mike Smith's team either just converted a 4th-and-1 or won another one-point game.

Mike Smith's goal in 2013 is to face a bad #6 seed for a change.

Much has been written this season arguing that the Falcons are not as good as their 13-3 record. Conversely, the Seahawks have emerged as a favorite among some in our advanced statistical community: Brian Burke ranks Seattle as the third most efficient team, Aaron Schatz ranks them number one, and Pro-Football-Reference ranks Seattle second in the SRS behind only the Patriots.

Here’s a quick way to summarize the Falcons-Seahawks game on Sunday: Atlanta won two more games than Seattle this season but the SRS says that the Falcons are 5.7 points worse than the Seahawks. That’s based on the fact that (1) Seattle has outscored opponents its by 2.9 more points per game than Atlanta outscored its opponents this year, and (2) Seattle faced a schedule that was 2.8 points per game harder than Atlanta’s schedule.

How often does it happen that a home team in the playoffs won 2+ more games than its opponent but was at least 5 points worse than that opponent in the SRS? This is just the second time such a matchup has occurred in the last 10 years… and the first involved the 2010 Falcons. In fact, this scenario has only unfolded five times since 1970:

YearBoxscoreTmOppRdSRS TMSRS OPPSRS DIFFWIN TMWIN OPPWIN DIFFPFPAW/L
2012BoxscoreATLSEAD6.512.2-5.713112
2010BoxscoreATLGBD611-5131032148L
1999BoxscoreTENBUFW17.2-6.2131122216W
1982BoxscoreRAINYJD5.310.7-5.48621417L
1976BoxscoreRAIPITC8.515.3-6.813103247W

[continue reading…]

{ 1 comment }

Season in review: AFC and NFC West

AFC East and NFC East Season in review
AFC North and NFC North Season in review
AFC North and NFC South Season in review

In the case of the AFC West, a picture can say a thousand words.

AFC West

Denver Broncos

Pre-season Projection: 8.5 wins
Maximum wins: 13 (after weeks 10 through 16)
Minimum wins: 9 (after weeks 3, 5 )
Week 1 comment: Watching Peyton Manning work his magic was a thing of beauty on Sunday night. The less John Fox touches this offense, the better, but I think everyone in Denver already knows that.

Once Peyton Manning proved that he was healthy and back, the AFC West race was effectively over. Officially, that happened in the week 6 comeback over the Chargers. That win only made them 3-3, but here is what I wrote then: According to Advanced NFL Stats, Denver is the best team in the league. Their remaining schedule is absurdly easy, so I’m going to perhaps prematurely give them a two-win bump. Their week 15 game in Baltimore may be for a bye, and I now think Denver is the favorite.

Kudos to Brian Burke’s model for correctly identifying how good the Broncos were early in the year. After week 9, I pegged Denver at 12 wins, and wrote: As a matter of principle, projecting a team to finish 7-1 is never advised. But this seems to be a good place to make an exception.

The next week, I bumped them to 13 wins, and never moved off that number. They got a late Christmas present from Manning’s old team, and now the AFC playoffs will have to go through Denver.

San Diego Chargers

Pre-season Projection: 9 wins
Maximum wins: 9 (after weeks 1, 2, and 4)
Minimum wins: 6 (after weeks 10 through 13, 16)
Week 1 comment: Unimpressive on Monday Night Football, but the schedule lines up for them to succeed. Philip Rivers is still elite, so expecting them to only go 8-7 the rest of the way is probably more of a knock on them than anything else. A healthy Ryan Mathews back will help.

The Chargers schedule was ridiculously easy, but they lost to the Browns, Saints, and Panthers, and couldn’t beat the Ravens, Bengals, or Bucs. The decline of Philip Rivers from elite quarterback to throw-it-out-of-bounds master is depressing, and it’s easy and probably appropriate to point the blame at the general manager. Going into 2013, San Diego will have a new head coach and GM, and we’ll see if that is what was needed to resurrect Rivers’ career.

It’s not easy to remember, but the Chargers were actually 3-1. At that point, I wrote: An unimpressive 3-1 team with a struggling offensive line. I really wanted to keep them at 8 wins, but their schedule is too easy and Philip Rivers — even in a down year — is good enough to lead them to a .500 record the rest of the way.

But by the time they were 3-4, I had already started with the “I can’t think of anything positive to say about the Chargers right now” comments. I summed up the Chargers season after week 13, when I wrote: This team started 2-0 but hasn’t beaten anyone but the Chiefs since then.

Of course, San Diego being San Diego, the Chargers did finish with 7 wins, but it was another disappointing season for the franchise. It’s hard to think back to September, but Vegas really did project the Chargers to win this division.
[continue reading…]

{ 4 comments }

The good Charles showed up against the Saints

The good Charles showed up against the Saints.

A couple of weeks ago, I heard my buddy and co-worker Sigmund Bloom say on the Footballguys Podcast that Jamaal Charles was having one of the craziest seasons ever. As Sigmund noted, Charles has been an incredibly frustrating fantasy player. This year, he had three games with 10 or fewer rushing yards… and he also became the first player in NFL history with two games with over 225 rushing yards in the same season.

Did you know that Kansas City finished 2012 fifth in carries? Under Todd Haley, Chiefs fans and fantasy football players were constantly frustrated by Thomas Jones, who Haley seemed to always find a way to give an extra ten carries to. This year, under Romeo Crennel, Peyton Hillis was the complementary back, but he was not nearly as predatory. Still, while Charles finally received the lion’s share of the carries, he was once again an inconsistent fantasy player.

Take a look at Charles’ weekly game logs:

G#DateOppResultAttYdsYPCTD
109/09/2012ATLL 24-4016875.440
209/16/2012@BUFL 17-35630.50
309/23/2012@NORW 27-24332337.061
409/30/2012SDGL 20-3717885.181
510/07/2012BALL 6-9301404.670
610/14/2012@TAML 10-3812403.330
710/28/2012OAKL 16-26540.80
811/01/2012@SDGL 13-3112393.250
911/12/2012@PITL 13-16231004.351
1011/18/2012CINL 6-2817875.120
1111/25/2012DENL 9-17231074.650
1212/02/2012CARW 27-21271274.70
1312/09/2012@CLEL 7-30181659.171
1412/16/2012@OAKL 0-159101.110
1512/23/2012INDL 13-202222610.271
1612/30/2012@DENW14533.790

That’s a pretty incredible distribution, but how crazy is it?

I looked at the standard deviation of every game by every player in a season with at least 1,000 rushing yards from 1960 to 2011. As it turns out, Charles has had one of the most inconsistent seasons ever. While he gained 1,509 rushing yards, he had a standard deviation of 71.4 yards. That may not mean anything to you in the abstract, but it would place him as the 4th most inconsistent back since 1960.
[continue reading…]

{ 0 comments }

Season in review: AFC and NFC South

Last week I reviewed the seasons of the teams in the AFC East and NFC East and in the AFC North and NFC North. Today we’ll review the interesting seasons from the AFC and NFC South divisions.

In the AFC South, I had the bottom three teams projected for between 5 and 6 wins for a five week stretch starting after week two. As we now know, that was resolved quite definitively by the end of the year:

AFC South

Houston Texans

Pre-season Projection: 10 wins
Maximum wins: 14 (after week 15)
Minimum wins: 10 (after week 1)
Week 1 comment: Going to win the AFC South going away; this team could win 12 games, but concerns about injuries and the potential to rest starters late keep them at 10 wins for now.

A miserable December ruined what should have been a marvelous season in Houston. At no point did I project any of the other AFC South teams to finish within even three games of the Texans. When they were 5-0, I wrote: Not only do the Texans still have 6 home games remaining, but they have 4 more games against the AFC South and get the Bills and Lions. Even without Brian Cushing, I don’t see why they don’t win 8 more games.

The Texans schedule was easy, but they also had dominant seasons out of J.J. Watt and Andre Johnson. Left Tackle Duane Brown was outstanding, and Houston is as good as any other team in the league when they’re at their their best. Unfortunately, they might be undermanned in a gunfight with the Broncos or Patriots, and it looks like now they’ll have to beat both of those teams to get to New Orleans. Still, I give the Texans a fighting chance; Matt Schaub has struggled in primetime games, but that doesn’t really mean anything. In the end I think the week 17 loss submarined their playoff hopes, and the team will be left wondering how good they could have been if Cushing stayed healthy.

Indianapolis Colts

Pre-season Projection: 5.5 wins
Maximum wins: 10 (after week 12 through the end of the year)
Minimum wins: 4 (after week 1)
Week 1 comment: There will be growing pains in Indianapolis. But nobody feels bad for their fans, nor should they; the Colts will be contenders each year for a decade, starting next season.

I never got on board with the Colts this year and it only looks worse in retrospect. On the other hand, even though Indianapolis finished 11-5, they were still outscored by 30 points in 2012. They struggled to beat Brady Quinn and the Chiefs and split with the Jaguars. The Colts won just two game by more than a touchdown.

While I missed on the Colts overall, I was on board the Andrew Luck bandwagon early on even when his numbers were terrible. I wrote this before the Colts-Packers game: Andrew LuckAaron Rodgers I won’t steal the spotlight from Tom BradyPeyton Manning XIII; by the time these two teams play again in four years, we may be looking at the best two quarterbacks in the league. I highlighted how Luck was being undervalued by conventional statistics after week 7, and wrote this after week 8: A wildcard darkhorse? I don’t think the Colts are very good — they’re just 29th according to Football Outsiders — but a win over Miami this weekend puts them in the driver’s seat. I finally projected them at 10 wins after week 12, and noted: Basically clinched a playoff berth with win over Buffalo and Steelers loss. Hard not to like this team.

They may not be very good, but they certainly are likeable. Even after the upset win over the Texans, Houston is just the 10th team to make the playoffs after being outscored by at least 30 points.
[continue reading…]

{ 2 comments }

Moss makes turkeys out of the Cowboys

Moss was very good when his teams won.

Last weekend, I looked at career rushing stats in wins and losses, and yesterday, I did the same for quarterbacks. Today we will check out the splits for receivers.

I looked at all games, including playoffs, from 1960 to 2011, for all players with at least 4,000 receiving yards over that time period. The table below lists the following information for each player:

– His first year (or 1960, if he played before 1960) and his last year (or 2011, if still active)
– All the franchises he played for (which you can search for in the search box)
– His number of career wins, and his career receptions, receiving yards, yards per reception, and receiving yards per game in wins
– His number of career losses, and his career receptions, receiving yards, yards per reception, and receiving yards per game in losses

You might be surprised to see Andre Johnson at the top of the list, but his career average should decline the longer he plays; that said, 2012 didn’t drop his numbers. On the flip side, Calvin Johnson moves up into the #2 slot; part of that was due to a great season (although Detroit didn’t get many wins) and part of that was due to Randy Moss slipping. Larry Fitzgerald comes up high on the list for the same reason as both Johnsons, although it’s often easy to forget how great Fitzgerald can be thanks to his current situation.

The table is sorted by receiving yards per game in wins:

RkPlayerYearsTeamsPosWinRec_WYd_WYPR_WY/G_WLossRec_LYd_LYPR_LY/G_L
1Andre Johnson2003--2011htxWR52325473914.5891.172394511812.9971.1
2Randy Moss1998--2010min-rai-nwe-otiWR114597996016.6887.493404576314.2662
3Michael Irvin1988--1999dalWR106560913316.3186.262277408614.7565.9
4Larry Fitzgerald2004--2011crdWR59352502114.2685.171383529913.8474.6
5Calvin Johnson2007--2011detWR23113192917.0783.954265415415.6876.9
6Lance Alworth1962--1972sdg-dalFL-WR83360687219.0982.842172309417.9973.7
7Jerry Rice1985--2004sfo-rai-seaWR20710991690915.3981.7118598817313.6769.3
8Art Powell1960--1968nyj-rai-buf-minSE-WR51244416017.0581.645215347716.1777.3
9Jimmy Smith1995--2005jaxWR96512782915.2981.680390510513.0963.8
10Torry Holt1999--2009ram-jaxWR93486741615.2679.789481659613.7174.1
11Charley Hennigan1960--1966otiWR44209350116.7579.640201321315.9980.3
12Steve Smith2001--2011carWR75390589815.1278.684356516214.561.5
13Del Shofner1960--1967ram-nygE41165321319.4778.43186122414.2339.5
14Dwayne Bowe2007--2011kanWR25118194816.5177.949238297912.5260.8
15Don Maynard1960--1973nyj-crdWR-HB79298615020.6477.876305509116.6967
16Terrell Owens1996--2010sfo-phi-dal-buf-cinWR1316551012715.4677.395477655813.7569
17Marvin Harrison1996--2008cltWR125723964913.3577.281444581413.0971.8
18Sterling Sharpe1988--1994gnbWR52292393713.4875.762314442614.171.4
19DeSean Jackson2008--2011phiWR39149293419.6975.22593136414.6754.6
20Wesley Walker1977--1989nyjWR73272548520.1775.171185319517.2745
21Herman Moore1991--2001detWR63314471215.0174.877383493612.8964.1
22Charlie Brown1982--1987was-atlWR42177313417.7174.62171101414.2848.3
23Sonny Randle1960--1968crd-sfo-dalE-WR45178333018.717445155218714.1148.6
24Greg Jennings2006--2011gnbWR61279449316.173.734151224314.8566
25Reggie Wayne2001--2011cltWR122639893813.9973.363306389812.7461.9
26John Jefferson1978--1985sdg-gnb-cleWR54238395316.6173.244131209115.9647.5
27Terry Glenn1996--2007nwe-gnb-dalWR793795686157261246357414.5358.6
28Darnay Scott1994--2002cin-dalWR40171285216.6871.377237334114.143.4
29Buddy Dial1960--1966pit-dalSE-FL35112249422.2771.331110205018.6466.1
30Isaac Bruce1994--2009ram-sfoWR114529811915.3571.2110539784814.5671.3
31Gary Clark1985--1995was-crd-miaWR107484760915.7271.166273407314.9261.7
32Carl Pickens1992--2000cin-otiWR39212274612.9570.484328438313.3652.2
33Homer Jones1964--1970nyg-cleSE-WR3291224024.627047131257319.6454.7
34Marques Colston2006--2011norWR61313426013.6169.832181260814.4181.5
35Cris Carter1987--2002phi-min-miaWR132701918513.169.6101463558412.0655.3
36Al Toon1985--1992nyjWR48251333613.2969.558287355112.3761.2
37Anquan Boldin2003--2011crd-ravWR65332448213.56967405518812.8177.4
38Pete Retzlaff1960--1966phiWR-TE42155288918.6468.842181280715.5166.8
39Chad Ochocinco2001--2011cin-nweWR74350508414.5368.789419604914.4468
40Steve Largent1976--1989seaWR99419679716.2268.7106423672615.963.5
41Raymond Berry1960--1967cltE57263391114.8768.632149197813.2861.8
42Gary Garrison1966--1977sdg-otiWR-SE55192376419.668.463201355717.756.5
43Darrell Jackson2000--2008sea-sfo-denWR61282414714.716863258348813.5255.4
44Mike Quick1982--1990phiWR39142264518.6367.857216366416.9664.3
45James Lofton1978--1993gnb-rai-buf-ram-phiWR109395738718.767.8115402725418.0463.1
46Rob Moore1990--1999nyj-crdWR59269399814.8667.894374557214.959.3
47Fred Barnett1990--1997phi-miaWR59243397716.3767.438136166812.2643.9
48Kellen Winslow1979--1987sdgTE58320390812.2167.455249321312.958.4
49George Sauer1965--1970nyjSE-WR45172301917.5567.130137197714.4365.9
50Joe Horn1996--2007kan-nor-atlWR71319473914.8666.777285405514.2352.7
51Otis Taylor1965--1974kanWR-FL75265498518.8166.541146232315.9156.7
52Mark Duper1983--1992miaWR88324583918.0266.455219362516.5565.9
53Bob Hayes1965--1975dal-sfoSE-WR87268567921.1965.341126212816.8951.9
54Steve Watson1979--1987denWR63223411218.4465.339147231415.7459.3
55Roddy White2005--2011atlWR62296403213.626553256353513.8166.7
56Rod Smith1995--2006denWR121575786513.686564323438413.5768.5
57Flipper Anderson1988--1995ram-cltWR3499220422.2664.858175332318.9957.3
58Eddie Brown1985--1991cinWR53175343119.6164.751197280214.2254.9
59Wes Welker2004--2011sdg-mia-nweWR86509555410.9164.645194211010.8846.9
60Derrick Alexander1994--2002cle-rav-kan-minWR48167309218.5164.469251390915.5756.7
61Andre Reed1985--2000buf-wasWR134599862114.3964.3106437580613.2954.8
62Antonio Gates2003--2011sdgTE80375512413.6664.153257310812.0958.6
63Wes Chandler1978--1988nor-sdg-sfoWR61234389416.6463.884348541915.5764.5
64Anthony Miller1988--1997sdg-den-dalWR71272451216.5963.582332477314.3858.2
65Al Denson1964--1971den-minWR-TE2589158117.7663.24916326081653.2
66Antonio Freeman1995--2003gnb-phiWR95375597815.9462.941155209613.5251.1
67Lee Evans2004--2011buf-ravWR51174320318.4162.867211287413.6242.9
68Plaxico Burress2000--2011pit-nyg-nyjWR95385592315.3862.357202296914.752.1
69Santana Moss2001--2011nyj-wasWR74285460616.1662.288387496312.8256.4
70Brandon Marshall2006--2011den-miaWR43214267612.562.248280357112.7574.4
71Keyshawn Johnson1996--2006nyj-tam-dal-carWR92447569112.7361.982406544913.4266.5
72Joey Galloway1995--2010sea-dal-tam-nwe-wasWR85321520516.2161.2107393590415.0255.2
73Muhsin Muhammad1996--2009car-chiWR105477640713.436196413558913.5358.2
74Henry Ellard1983--1998ram-was-nweWR99343604017.6161125492807916.4264.6
75Tommy McDonald1960--1968phi-dal-ram-atl-cleWR-HB49166297917.9560.861222349315.7357.3
76Anthony Carter1985--1995min-detWR80293485316.5660.762233353515.1757
77Art Monk1980--1995was-nyj-phiWR142631860913.6460.695378517413.6954.5
78Red Phillips1960--1967ram-minE2494145515.4860.653214314714.7159.4
79Roger Carr1974--1983clt-sea-sdgWR40110242522.0560.660163268116.4544.7
80Paul Flatley1963--1970min-atlWR-FL34117206117.6260.655179274215.3249.9
81David Boston1999--2005crd-sdg-miaWR27109162614.9260.247206307314.9265.4
82Ernest Givins1986--1995oti-jaxWR75320451614.1160.280311447314.3855.9
83Dwight Clark1979--1987sfoWR81343487214.260.146216264812.2657.6
84Santonio Holmes2006--2011pit-nyjWR57211342516.2360.138152221214.5558.2
85Paul Warfield1964--1977cle-miaWR-SE115340689220.2759.947132249718.9253.1
86Laveranues Coles2000--2009nyj-was-cinWR71323425313.1759.981378463812.2757.3
87Jimmy Orr1960--1970pit-cltWR73219437219.9659.938119211917.8155.8
88Elbert Dubenion1960--1967bufWR-HB53159317219.9559.842127207516.3449.4
89Ken Burrough1970--1981nor-otiWR67222397717.9159.480204323015.8340.4
90Stephone Paige1983--1991kanWR57180336118.675963203308915.2249
91Todd Christensen1980--1988raiTE-FB66306388812.7158.941186234212.5957.1
92Louis Lipps1984--1992pit-norWR48169282716.7358.963204337616.5553.6
93Jeff Graham1991--2001pit-chi-nyj-phi-sdgWR57222334515.0758.785335506415.1259.6
94Harold Jackson1969--1983phi-ram-nwe-min-seaWR-FL100296586419.8158.684292483516.5657.6
95Tim Brown1988--2004rai-tamWR135562790714.0758.6127577760813.1959.9
96Tony Martin1990--2001mia-sdg-atlWR103369603116.3458.676267373213.9849.1
97John Stallworth1974--1987pitWR103361602316.6858.558230368716.0363.6
98Eric Martin1985--1994nor-kanWR85315496915.7758.568253339613.4249.9
99Stanley Morgan1977--1990nwe-cltWR99298578719.4258.586278525018.8861
100Alfred Jenkins1975--1983atlWR50170290317.0858.160196357118.2259.5
101Jason Witten2003--2011dalTE77381445711.757.967343374510.9255.9
102Kellen Winslow Jr.2004--2011cle-tamTE34153196712.8657.958284286910.149.5
103Braylon Edwards2005--2011cle-nyj-sfoWR48172275916.0457.557184288415.6750.6
104Cris Collinsworth1981--1988cinWR60216344615.9557.448222360616.2475.1
105Gene A. Washington1969--1979sfo-detWR-SE60178344519.3557.469210353516.8351.2
106John Gilliam1967--1977nor-crd-min-atlWR-FL69206394719.1657.270176301717.1443.1
107Chris Burford1960--1967kanSE-WR52205297114.4957.138157229214.660.3
108Max McGee1960--1967gnbE57177324418.3356.91956106719.0556.2
109Charlie Joiner1969--1986oti-cin-sdgWR114404647616.0356.8114375613216.3553.8
110Tony Hill1977--1986dalWR97335550816.4456.846190309816.3167.3
111Bernie Casey1961--1968sfo-ramFB-WR45162254715.7256.644160233114.5753
112Charley Taylor1964--1977wasWR-RB87341491814.4256.570297407113.7158.2
113Javon Walker2002--2009gnb-den-raiWR45157253716.1656.438123176014.3146.3
114Jerry Butler1979--1986bufWR38139213915.3956.347146228515.6548.6
115Carlos Carson1980--1989kan-phiWR50147280919.1156.263203344416.9754.7
116Webster Slaughter1986--1998cle-oti-kan-nyj-sdgWR76276426515.4556.184314424313.5150.5
117Hines Ward1998--2011pitWR145684812911.8856.183393499612.7160.2
118Gail Cogdill1960--1970det-atlSE-WR54172302317.585653164243114.8245.9
119Johnny Morris1960--1967chiFL-HB51189284715.0655.837141179412.7248.5
120Chris Chambers2001--2010mia-sdg-kanWR74273412715.1255.876291392813.551.7
121Cliff Branch1972--1984raiWR129401718417.9255.749170273916.1155.9
122Andre Rison1989--2000clt-atl-cle-jax-gnb-kan-raiWR92361512014.1855.792411550013.3859.8
123Reggie Rucker1970--1981dal-nyg-nwe-cleWR70235389016.5555.679215323415.0440.9
124Eddie Kennison1996--2007ram-nor-chi-den-kanWR75245416316.9955.5102306423213.8341.5
125Antonio Bryant2002--2009dal-cle-sfo-tamWR40148221714.9855.464225347215.4354.3
126Donald Driver1999--2011gnbWR115471636813.5255.476313436713.9557.5
127Marty Booker1999--2009chi-mia-atlWR57242315313.0355.385299356811.9342
128Yancey Thigpen1992--2000pit-otiWR67227370116.355.233121180014.8854.5
129Tony Gonzalez1997--2011kan-atlTE122562672311.9655.1116603677211.2358.4
130Vance Johnson1985--1995denWR70269385614.3355.151183252013.7749.4
131Curtis Conway1993--2004chi-sdg-nyj-sfoWR61232335914.4855.197369495213.4251.1
132Roy Jefferson1965--1976pit-clt-wasWR-SE78251426516.9954.772217349416.148.5
133Fred Biletnikoff1965--1978raiWR-FL136475742415.6354.646148213714.4446.5
134Lionel Taylor1960--1968den-otiWR31136169112.4354.571405515312.7272.6
135Vincent Jackson2005--2011sdgWR63194342917.6854.433107182817.0855.4
136Jim Colclough1960--1968nweE49148266618.0154.445112187416.7341.6
137Carroll Dale1960--1973ram-gnb-minWR-TE91245494920.254.473211366017.3550.1
138Dave Parks1964--1973sfo-nor-otiWR-TE31107168115.7154.267215342415.9351.1
139Shannon Sharpe1990--2003den-ravTE131534710013.354.26934337741154.7
140Ben Hawkins1966--1973phiWR2875151720.2354.257171294517.2251.7
141Eric Moulds1996--2007buf-htx-otiWR89344480313.9654100435551212.6755.1
142Isaac Curtis1973--1984cinWR79226426318.865475203302214.8940.3
143Brian Blades1988--1998seaWR66268355613.2753.978318414213.0353.1
144Lynn Swann1974--1982pitWR94302505416.7453.83280130016.2540.6
145Deion Branch2002--2011nwe-seaWR94367504813.7553.751197238312.146.7
146Sammy White1976--1985minWR68211364617.2853.661188289315.3947.4
147Kevin House1980--1987tam-ramWR3089160818.0753.670218369316.9452.8
148Haywood Jeffires1987--1996oti-norWR65272348312.8153.668304336411.0749.5
149Roy Green1979--1992crd-phiWR76239406617.0153.5104318482615.1846.4
150Ahmad Rashad1972--1982crd-buf-minWR71271376913.9153.167236329513.9649.2
151Amani Toomer1996--2008nygWR110403583114.475389307423213.7947.6
152Bobby Mitchell1960--1968cle-wasWR-HB52175275015.7152.962263419215.9467.6
153Bill Brooks1986--1996clt-buf-wasWR74278391014.0652.885332440313.2651.8
154Harold Carmichael1971--1984phi-dalWR-TE82279430615.4352.599333500115.0250.5
155Drew Pearson1973--1983dalWR121391635016.2452.550165257715.6251.5
156Lance Rentzel1965--1974min-dal-ramWR-FL66180345819.2152.44294154416.4336.8
157Irving Fryar1984--2000nwe-mia-phi-wasWR119398623015.6552.4135477684514.3550.7
158Bert Emanuel1994--2001atl-tam-mia-nwe-detWR44158230014.5652.352202268313.2851.6
159Keenan McCardell1992--2007cle-jax-tam-sdg-wasWR123495642812.9952.387443556712.5764
160Aaron Thomas1961--1970sfo-nygTE-SE3587182821.0152.255170266515.6848.5
161Mark Clayton1983--1993mia-gnbWR102336530315.785265278417815.0364.3
162Jake Reed1992--2002min-norWR72251374214.915262225366616.2959.1
163Roy E. Williams2004--2011det-dal-chiWR46161238814.8351.966237338614.2951.3
164Henry Marshall1976--1987kanWR58188298215.8651.484234363515.5343.3
165John Taylor1987--1995sfoWR94302482515.9851.33591150716.5643.1
166Ricky Sanders1986--1995was-atlWR80286410514.3551.357228288912.6750.7
167Alvin Harper1991--1997dal-tam-wasWR56139287120.6551.32976125716.5443.3
168Frank Clarke1960--1967dalE37112188716.855151149295919.8658
169Marcus Robinson1998--2006chi-rav-minWR47160239414.9650.955172244114.1944.4
170T.J. Houshmandzadeh2001--2011cin-sea-rav-raiWR57253289311.4350.881370428611.5852.9
171Drew Hill1979--1993ram-oti-atlWR103334522015.6350.7105339515215.249.1
172Michael Jackson1991--1998cle-ravWR39127196915.550.562234355615.257.4
173Willie Davis1992--1998kan-otiWR61183307316.7950.444119166914.0337.9
174Boyd Dowler1960--1971gnb-wasFL-SE102324511215.7850.140119160013.4540
175Derrick Mason1997--2011oti-rav-nyj-htxWR141542705313.015097450560912.4657.8
176Johnnie Morton1994--2005det-kan-sfoWR75267374614.0349.997368509213.8452.5
177Mark Carrier1987--1998tam-cle-carWR64212318815.0449.8102366566815.4955.6
178Danny Abramowicz1967--1974nor-sfoE3097149415.449.874255388415.2352.5
179Wayne Chrebet1995--2005nyjWR69263343513.0649.881336419912.551.8
180Dave Kocourek1960--1968sdg-mia-raiTE-FL55157272717.3749.63798150915.440.8
181Ed McCaffrey1991--2003nyg-sfo-denWR106380521213.7249.258227276412.1847.7
182Michael Westbrook1995--2002was-cinWR39135191414.1849.142144236116.456.2
183Lionel Manuel1984--1990nygWR50143244417.0948.933103174016.8952.7
184Gary Collins1962--1971cleWR80240387716.1548.54295149715.7635.6
185Robert Brooks1992--2000gnb-denWR67226324414.3548.436128168313.1546.8
186Frank Sanders1995--2003crd-ravWR48178232313.0548.480336452813.4856.6
187Jerry Porter2000--2008rai-jaxWR38116183915.8548.462197257313.0641.5
188Mel Gray1971--1982crdWR65167311318.6447.978188354518.8645.4
189Tim McGee1986--1994cin-wasWR53145252617.4247.769183273714.9639.7
190Frank Lewis1971--1983pit-bufWR86229409817.947.758190311416.3953.7
191Bernard Berrian2004--2011chi-minWR58178276115.5147.652143182712.7835.1
192Sean Dawkins1993--2001clt-nor-sea-jaxWR54173256614.8347.578290396013.6650.8
193Willie Gault1983--1993chi-raiWR98227465320.547.558127247919.5242.7
194Dallas Clark2003--2011cltTE88358417511.6647.436133155911.7243.3
195Jessie Hester1985--1995rai-atl-clt-ramWR49133231817.4347.373241354814.7248.6
196Michael Haynes1988--1997atl-norWR52155245915.8647.381280428815.3152.9
197Haven Moses1968--1981buf-denWR-SE82199385619.384790253442517.4949.2
198Jackie Smith1963--1978crd-dalTE84226395017.484777235369615.7348
199Mark Jackson1986--1994den-nyg-cltWR74205347216.9446.953159249115.6747
200Terance Mathis1990--2002nyj-atl-pitWR86299400213.3846.5114419520612.4245.7
201Bob Chandler1971--1981buf-raiWR48145223315.446.567229305813.3545.6
202Milt Morin1966--1975cleTE56165259915.7546.446117171014.6237.2
203Reggie Langhorne1985--1993cle-cltWR63205292314.2646.459229287412.5548.7
204Pat Tilley1976--1986crdWR61189283014.9746.474280418614.9556.6
205John Mackey1963--1972clt-sdgTE89253412816.3246.43377113314.7134.3
206Michael Timpson1989--1997nwe-chi-phiWR41137190013.8746.361164215413.1335.3
207Bill Schroeder1997--2004gnb-det-tamWR50150231115.4146.247159234214.7349.8
208Chris Cooley2004--2011wasTE48187221111.8246.160252263510.4643.9
209Brett Perriman1988--1997nor-det-kan-miaWR74258339013.1445.872294352211.9848.9
210Dave Casper1974--1984rai-oti-minTE70230320213.9245.744175237713.5854
211Dave Logan1976--1984cle-denWR47133214716.1445.747133216616.2946.1
212Bobby Joe Conrad1960--1969crd-dalWR-HB62191283014.8245.655192256313.3546.6
213Koren Robinson2001--2008sea-min-gnbWR51159232514.6245.646150206313.7544.8
214Bobby Engram1996--2009chi-sea-kanWR80301364112.145.5101384458611.9445.4
215Gary Ballman1962--1973pit-phi-nyg-minWR-TE3589156517.5844.768212345116.2850.8
216Nat Moore1974--1986miaWR-RB119363531514.6444.755163231214.1842
217Duriel Harris1976--1985mia-cle-dalWR68185303716.4244.744133228417.1751.9
218Jack Snow1965--1975ramWR-SE85214377317.6344.442115197817.247.1
219Freddie Scott1974--1983clt-detWR3695159216.7644.258173276615.9947.7
220Ray Butler1980--1988clt-seaWR3490150316.744.264152254316.7339.7
221Devery Henderson2005--2011norWR64150282818.8544.247104169716.3236.1
222J.J. Stokes1995--2003sfo-jax-nweWR66238291312.2444.149141181212.8537
223Charlie Sanders1968--1977detTE60174264315.1944.150151199513.2139.9
224Kevin Johnson1999--2005cle-jax-rav-detWR38133167212.574463255306312.0148.6
225Donte Stallworth2002--2011nor-phi-nwe-cle-rav-wasWR61164265616.243.555170237213.9543.1
226Freddie Solomon1975--1985mia-sfoWR83214359516.843.363191278814.644.3
227Ben Coates1991--2000nwe-ravTE70276301910.9443.170249279411.2239.9
228Vernon Davis2006--2011sfoTE42150181112.0743.145164228413.9350.8
229Rocket Ismail1993--2001rai-car-dalWR61168261715.5842.965204286514.0444.1
230Qadry Ismail1993--2002min-mia-nor-rav-cltWR83228354415.5442.758143188013.1532.4
231O.J. McDuffie1993--2000miaWR71248300512.1242.352217267212.3151.4
232Mark Bavaro1985--1994nyg-cle-phiTE77239325413.6242.340142184512.9946.1
233James Jett1993--2001raiWR55127232218.2842.253142226915.9842.8
234Brent Jones1987--1997sfoTE113366476913.0342.233111116610.535.3
235Jeremy Shockey2002--2011nyg-nor-carTE82309345011.1742.161260291811.2247.8
236Chris Calloway1990--2000pit-nyg-atl-nweWR64170269115.834272223289112.9640.2
237David Patten1997--2008nyg-cle-nwe-was-norWR77200323616.184263144173912.0827.6
238J.T. Smith1978--1990was-kan-crdWR64211267112.6641.791323417212.9245.8
239Brandon Stokley1999--2011rav-clt-den-sea-nygWR80226329514.5841.249156200512.8540.9
240Calvin Williams1990--1996phi-ravWR58184238112.9441.141141174412.3742.5
241Nate Burleson2003--2011min-sea-detWR64210262612.54160204257612.6342.9
242Ron Jessie1971--1981det-ram-bufWR74181303116.75414396143114.9133.3
243Keith Jackson1988--1996phi-mia-gnbTE87288356012.3640.947204255712.5354.4
244Jeff Chadwick1983--1992det-sea-ramWR44103179917.4740.962191275014.444.4
245Curtis Duncan1987--1993otiWR58210236811.2840.842146184112.6143.8
246Mike Sherrard1986--1996dal-sfo-nyg-denWR62162252815.640.832104147614.1946.1
247Shawn Jefferson1991--2003sdg-nwe-atl-detWR96253391415.4740.888244339013.8938.5
248Marshall Faulk1994--2005clt-ramRB9942240229.5340.68939733728.4937.9
249Jabar Gaffney2002--2011htx-nwe-den-wasWR66199268113.4740.682269322311.9839.3
250Willie Green1991--1998det-tam-car-denWR55147223315.1940.635117184415.7652.7
251Todd Heap2001--2011rav-crdTE83273336912.3440.663250279111.1644.3
252Mike Ditka1961--1972chi-phi-dalTE80239324013.5640.554184241613.1344.7
253Torrance Small1992--2001nor-ram-clt-phi-nweWR51141205314.5640.371213262412.3237
254Peerless Price1999--2007buf-atl-dalWR54159215813.574067254324412.7748.4
255Mike Renfro1978--1987oti-dalWR53140211715.1239.960190275914.5246
256Quinn Early1988--1999sdg-nor-buf-nyjWR73203291414.3539.976278379013.6349.9
257Chris Burkett1985--1993buf-nyjWR41110163514.8639.966185277214.9842
258Ike Hilliard1997--2008nyg-tamWR79258314812.239.885312353411.3341.6
259Drew Bennett2001--2008oti-ramWR44116175215.139.853205286813.9954.1
260Jerricho Cotchery2004--2011nyj-pitWR62206246111.9539.758199276113.8747.6
261Mike Pritchard1991--1999atl-den-seaWR58172229713.3539.667263304311.5745.4
262Nate Washington2005--2011pit-otiWR55139217515.6539.545137189213.8142
263Riley Odoms1972--1983denTE83220327914.939.561176237913.5239
264Sam McCullum1974--1983min-seaWR51131200315.2939.363150212814.1933.8
265Jay Novacek1985--1995crd-dalTE84298328111.0139.152186199410.7238.3
266Ozzie Newsome1978--1990cleTE102324397712.273998365437611.9944.7
267Bob Trumpy1968--1977cinTE-WR60147233115.8638.958147210314.3136.3
268Raymond Chester1970--1981rai-cltTE80199309915.5738.763172214612.4834.1
269Travis Taylor2000--2007rav-min-rai-ramWR52153201313.1638.750172216212.5743.2
270Joe Jurevicius1998--2007nyg-tam-sea-cleWR68195262913.4838.751145183212.6335.9
271Wesley Walls1989--2003sfo-nor-car-gnbTE68206260412.6438.381253276610.9334.1
272Ricky Proehl1990--2006crd-sea-chi-ram-car-cltWR112299427914.3138.2117393496212.6342.4
273Bob Tucker1970--1980nyg-minTE56161212913.223882255318712.538.9
274Steve Jordan1982--1994minTE86255326912.823881269338112.5741.7
275Leonard Thompson1975--1986detWR-HB52116197617.033880169286816.9735.9
276Charles Johnson1994--2002pit-phi-nwe-bufWR69204261612.8237.949173228313.246.6
277Jerry Smith1965--1977wasTE-WR75206284113.7937.960190234412.3439.1
278Rich Caster1970--1981nyj-oti-nor-wasTE-WR58123219717.8637.976207338516.3544.5
279Michael Jenkins2004--2011atl-minWR52144195413.5737.654184216811.7840.1
280Alge Crumpler2001--2010atl-oti-nweTE73196274013.9837.568191216811.3531.9
281Paul Coffman1979--1987gnb-kanTE49145183812.6837.562196248912.740.1
282Courtney Hawkins1992--2000tam-pitWR55170205912.1137.470204257212.6136.7
283Russ Francis1975--1988nwe-sfoTE96277358712.9537.455151214914.2339.1
284Billy Cannon1960--1970oti-rai-kanTE-RB80174298617.1637.3318194511.6730.5
285Jimmie Giles1977--1989oti-tam-det-phiTE50122186115.2537.288232330614.2537.6
286Brian Brennan1984--1992cle-cin-sdgWR61172226713.1837.262184237812.9238.4
287Eric Green1990--1999pit-mia-rav-nyjTE55167201712.0836.757200248812.4443.6
288Troy Brown1993--2007nweWR120392439211.236.681223266811.9632.9
289Gino Cappelletti1960--1970nweFL-SE63132230517.4636.670139203714.6529.1
290Justin McCareins2001--2008oti-nyjWR61145223015.3836.653118180615.3134.1
291Rick Upchurch1975--1983denWR67151243916.1536.453117193916.5736.6
292Frank Wycheck1993--2003was-otiTE86299312910.4636.46724323109.5134.5
293Heath Miller2005--2011pitTE80239286311.9835.839138149810.8638.4
294Floyd Turner1989--1998nor-clt-ravWR46129163812.735.654167238214.2644.1
295Mark Ingram1987--1996nyg-mia-gnb-phiWR65153230115.0435.447128181514.1838.6
296Ken Dilger1995--2004clt-tamTE69192243912.735.375180181910.1124.3
297Rodney Holman1982--1995cin-detTE81210281613.4134.879173220012.7227.8
298Dennis Northcutt2000--2009cle-jax-detWR49132170212.8934.797278339012.1934.9
299Pete Holohan1981--1992sdg-ram-kan-cleTE62190214911.3134.763189199510.5631.7
300Mickey Shuler1978--1991nyj-phiTE68222235210.5934.671248284511.4740.1
301Jerome Barkum1972--1983nyjTE-WR54129185514.3834.472201299014.8841.5
302Az-Zahir Hakim1998--2006ram-det-norWR57145191713.2233.655192255813.3246.5
303Brian Westbrook2002--2010phi-sfoRB8026926589.8833.24920316057.9132.8
304Larry Centers1990--2003crd-was-buf-nweFB8434127828.1633.111950741778.2435.1
305John L. Williams1986--1995sea-pitFB8129026779.23337528722227.7429.6
306Brandon Lloyd2003--2011sfo-was-chi-den-ramWR3281104912.9532.873230373516.2451.2
307Billy Johnson1974--1988oti-atl-wasWR65159211013.2732.571176207711.829.3
308Randy McMichael2002--2011mia-ram-sdgTE53160168610.5431.888257280210.931.8
309Roger Craig1983--1993sfo-rai-minRB12743140059.2931.55319515007.6928.3
310Ricky Watters1992--2001sfo-phi-seaRB9128928519.8731.36321518158.4428.8
311Ronnie Harmon1986--1997buf-sdg-oti-chiRB-WR94283293410.3731.289350361210.3240.6
312Tiki Barber1997--2006nygRB8026724979.3531.28033828178.3335.2
313Eric Metcalf1989--2002cle-atl-sdg-crd-car-was-gnbRB-WR83238256410.7730.9102317318510.0531.2
314Jim R. Mitchell1969--1979atlTE57139175912.6530.966160237514.8436
315Keith Byars1986--1998phi-mia-nwe-nyjFB-TE11939036659.430.87927224398.9730.9
316Freddie Jones1997--2004sdg-crdTE37109113110.3830.679295310110.5139.3
317Tony Nathan1979--1987miaRB8929027059.3330.44515815369.7234.1
318Tony McGee1993--2002cin-dalTE3992117812.830.289230291112.6632.7
319Jackie Harris1990--2001gnb-tam-oti-dalTE63157188111.9829.979251265010.5633.5
320Joe Morrison1960--1972nygRB-WR66147195813.3229.779224274712.2634.8
321Charle Young1973--1985phi-ram-sfo-seaTE76190225311.8629.671241300212.4642.3
322David Hill1976--1987det-ramTE71182209111.4929.576187221111.8229.1
323Billy Joe DuPree1973--1983dalTE101213293313.77294293107911.625.7
324Antwaan Randle El2002--2010pit-wasWR88184247313.4428.166220240210.9236.4
325Kelvin Martin1987--1996dal-sea-phiWR68138183913.332774238302312.740.9
326Thurman Thomas1988--2000buf-miaRB13034634119.8626.27120217198.5124.2
327Marcus Pollard1996--2008clt-det-sea-atlTE81183211311.5526.181185240212.9829.7
328LaDainian Tomlinson2001--2011sdg-nyjRB10434126837.8725.87630822657.3529.8
329Walter Payton1975--1987chiRB11327826459.5123.48623620718.7824.1
330Herschel Walker1986--1997dal-min-phi-nygRB8421119579.2723.310631129629.5227.9
331Kevin Faulk1999--2011nweRB12532828858.823.15415412287.9722.7
332Marcus Allen1982--1997rai-kanRB14534131869.34229129927559.2130.3
333Warrick Dunn1997--2008tam-atlRB9824421418.7721.89230124548.1526.7
334Earnest Byner1984--1997cle-was-ravRB11127123998.8521.610227825849.2925.3
335Tony Galbreath1976--1987nor-min-nygRB7917514708.418.69032626678.1829.6

[continue reading…]

{ 2 comments }

Is this a thinly-veiled Brady/Manning post?

Is this a thinly-veiled Brady/Manning post?

Last weekend, I looked at career rushing stats in wins and losses; today I will do the same but for quarterbacks.

I looked at all games, including playoffs, from 1960 to 2011, for all quarterbacks with at least 5,000 career passing yards over that time period. The table below lists the following information for each passer:

– His first year (or 1960, if he played before 1960) and his last year (or 2011, if still active)
– All the franchises he played for (which you can search for in the search box)
– His number of career wins, and his touchdown rate, interception rate, yards per attempt and Adjusted Yards per Attempt (which includes a 20-yard bonus for touchdown passes and a 45-yard penalty for interceptions) in wins [1]Unfortunately, I excluded sack data from this study due to its general unavailability for most of the covered time period.
– His number of career losses, and his touchdown rate, interception rate, yards per attempt and Adjusted Yards per Attempt in losses

The table is sorted by AY/A in wins; unsurprisingly, Aaron Rodgers — who is the career leader in that metric — tops this table, too. In fact, Rodgers is also the leader in AY/A in losses. Note that this table includes all games played by the quarterback, not just his starts.

RkPlayerYearsTeamsPYDWinTD%_WINT%_WY/A_WAY/A_WLossTD%_LINT%_LY/A_LAY/A_L
1Aaron Rodgers2005--2011gnb19147497.6%1.3%8.78.3274.3%2.5%7.46.4
2Matt Schaub2004--2011atl-htx17936485.3%1.7%8.78.1533.5%3.3%7.25.8
3Tony Romo2005--2011dal21666606.6%2.1%8.77.9434.3%3.4%75.5
4Kurt Warner1998--2009ram-nyg-crd36296816.8%2.2%8.77.8573.3%4.4%7.25.3
5Daunte Culpepper1999--2009min-mia-rai-det25133457.1%2.2%8.77.8643.3%4%6.95.1
6Bob Berry1965--1975min-atl9197327.4%2.3%8.67.7364.2%7.4%7.13.8
7Steve Young1985--1999tam-sfo364501256.8%1.7%8.37.6602.9%4.2%7.25.3
8Philip Rivers2004--2011sdg26105696.2%2.3%8.57.6394%3.1%7.36
9Ben Roethlisberger2004--2011pit29729905.7%2.2%8.47.6383.7%4.9%7.25
10John Friesz1990--2000sdg-was-sea-nwe8699195%1%7.87.5382.6%4%5.84
11Bart Starr1960--1971gnb22810996.6%2.9%8.67.5412.4%5.9%6.74.1
12Don Meredith1960--1968dal17750518.5%3.3%8.87.5503.5%6%6.23.6
13Drew Brees2001--2011sdg-nor43722976.5%1.7%87.4663.4%3.7%6.75.1
14Ken O'Brien1984--1993nyj-phi25598565.8%1.7%87.4722.1%3.6%6.34.7
15J.P. Losman2004--2011buf-rai-mia6271175.8%1.5%7.97.4282.5%4.4%6.14.1
16Trent Green1997--2008was-ram-kan-mia28794595.3%2.1%8.27.3633.6%3.8%7.15.5
17Rob Johnson1995--2003jax-buf-tam-was-rai5947204.8%1.5%7.97.3252.8%3.6%6.75.1
18Chad Pennington2000--2010nyj-mia19241465.1%1.2%7.77.3493.2%4.1%6.64.9
19Boomer Esiason1984--1997cin-nyj-crd38520896.6%2.4%8.27.31033.3%4.4%6.54.6
20Neil Lomax1981--1988crd23156486.4%2.1%8.17.3593%3.3%6.65.2
21David Garrard2002--2010jax16489455.3%1.4%7.87.3442.7%3.4%6.44.9
22Matthew Stafford2009--2011det8220138.1%1.8%7.97.2173.4%4.4%6.34.4
23Joe Montana1979--1994sfo-kan463231406.4%2.2%8.17.2602.7%3.4%6.34.9
24Eddie LeBaron1960--1963dal53311112.5%5.5%9.47.2314.7%8.7%7.13.3
25Peyton Manning1998--2010clt602171506.3%1.9%87.2773.9%4.1%6.95.2
26Ed Brown1960--1965chi-pit-clt7723357.7%5.8%9.77.2332.9%8.8%6.52.6
27Wade Wilson1981--1998min-atl-nor-dal-rai18605666.1%2.6%8.37.2632.4%5.3%6.23.9
28Jay Cutler2006--2011den-chi18637426.6%2.2%8.17.2382.7%4.6%6.54.5
29Josh Freeman2009--2011tam8898175.6%1.8%7.97.2242.8%4.6%6.14.1
30Tom Brady2000--2011nwe452641406.1%1.6%7.87.2433.6%4.2%6.34.5
31Matt Moore2007--2011car-mia5137176.2%1.8%7.87.1192.8%5%6.24
32Chris Chandler1988--2004clt-tam-crd-ram-oti-atl-chi29212725.9%2.6%8.27.11053.1%4.4%6.44.4
33Len Dawson1960--1975cle-kan301121058.7%3.6%8.67.1643.2%6.3%6.63.8
34Joe Flacco2008--2011rav15348494.6%1.2%7.67.1243%4.4%5.94
35Trent Edwards2007--2010buf-jax6019144%1.6%7.77.1222%4.3%5.73.8
36Jeff Garcia1999--2009sfo-cle-det-phi-tam26894635.4%1.3%7.57.1683.4%3.1%6.45.1
37Ken Anderson1971--1986cin341591006.2%2.4%87.1922.7%4.7%6.74.7
38Rudy Bukich1960--1968pit-chi7865307.5%3.5%8.57353.5%8.6%62.3
39Troy Aikman1989--2000dal367911054.8%2.1%7.97762.1%4.1%64.2
40Damon Huard1998--2008mia-nwe-kan6349204.9%1.1%7.47242%4.3%5.84
41Jim Everett1986--1997ram-nor-sdg35957665.7%2.6%8.17973.2%4.2%6.54.6
42Roger Staubach1969--1979dal254911066.1%2.5%87443.5%6.3%6.73.9
43Bert Jones1973--1982clt-ram18589476.4%3.1%8.27583.6%4.6%6.34.3
44Frank Reich1985--1998buf-car-nyj-det6858398.8%2.1%7.77393.3%4.3%6.34.4
45Jeff Hostetler1986--1997nyg-rai-was17464705.5%1.9%7.77402.3%4.1%6.34.5
46Dan Fouts1973--1987sdg45165915.9%3.2%8.36.9953.1%5.5%7.14.7
47Bill Kenney1980--1988kan17374375.9%2.5%86.9493.2%4.2%6.54.6
48Y.A. Tittle1960--1964sfo-nyg11542408.9%4.3%8.76.9232.5%6.9%5.72.7
49Mark Brunell1994--2011gnb-jax-was-nor-nyj33905994.8%1.8%7.66.9913.2%2.9%6.24.9
50Aaron Brooks2000--2006nor-rai20822415.8%1.6%7.56.9543.3%4.1%6.44.7
51Patrick Ramsey2002--2008was-nyj-den5929165.2%2.3%7.86.9243.1%3.8%5.84.2
52Scott Mitchell1992--2001mia-det-rav-cin15925406%2.1%7.76.9452.6%4.6%5.93.9
53Randy Wright1984--1988gnb7106125.4%3.4%8.36.9332.2%5.5%5.93.5
54Rich Gannon1987--2004min-was-kan-rai30434915.5%1.5%7.46.9713%3.6%6.24.6
55Earl Morrall1960--1976det-nyg-clt-mia17529927.9%4.8%8.96.9444.2%6.9%6.63.6
56Sonny Jurgensen1960--1974phi-was31546747.7%3.9%8.46.9794.5%4.9%6.84.7
57Steve DeBerg1978--1998sfo-den-tam-kan-mia-atl34752725.4%2.3%7.86.91143.2%4.9%6.44.2
58Steve Beuerlein1988--2003rai-dal-crd-jax-car-den24317645.6%2.3%7.86.8663.4%4.2%6.85
59Fran Tarkenton1961--1978min-nyg488061316.8%2.8%86.81173.6%5.5%6.54.1
60John Brodie1960--1973sfo30783786.7%3.3%8.26.8793.3%6%6.13.5
61Doug Flutie1986--2005chi-nwe-buf-sdg15209485.2%2.4%7.86.8452.9%3.9%64.3
62Johnny Unitas1960--1973clt-sdg323351076.3%3.8%8.46.8592.7%7.3%6.53.2
63Joe Namath1965--1977nyj-ram28299686.4%4%8.56.8713.3%6.8%6.53.5
64Matt Ryan2008--2011atl14832436.1%1.9%7.56.8222.4%3%6.14.8
65Craig Erickson1992--1997tam-clt-mia7625184.8%2.7%7.96.8343.2%3.9%6.54.8
66Marc Bulger2002--2009ram23758424.9%2.6%7.86.8573.1%3.3%6.85.4
67Matt Cassel2005--2011nwe-kan11769425.1%2%7.66.8303.5%3.3%5.74.3
68Tom Flores1960--1969rai-buf-kan11960408.3%3.8%8.36.8442.8%6.7%5.72.8
69Phil Simms1979--1993nyg351411025.3%2.5%7.76.7723%4.3%6.44.6
70Derek Anderson2006--2011cle-crd-car9148215.5%2.4%7.76.7322.7%4.6%5.73.6
71Michael Vick2001--2011atl-phi18889655.8%2.4%7.76.7512.8%3.4%6.34.9
72Brett Favre1991--2010atl-gnb-nyj-min776932016.3%2.2%7.66.71253.2%4.9%6.44.3
73Craig Morton1965--1982dal-nyg-den291431186.7%3.7%8.26.7822.6%6.5%6.23.4
74Steve Pelluer1985--1990dal-kan6870173.3%2.2%7.66.7262.9%4.7%6.94.8
75Dan Marino1983--1999mia658711555.7%2.4%7.76.71054.1%3.9%6.85.1
76Donovan McNabb1999--2011phi-was-min408591065.4%2%7.46.7742.9%2.6%6.15
77Dave Krieg1980--1998sea-kan-det-crd-chi-oti400421136.7%3%7.96.7983%4.4%6.54.5
78Warren Moon1984--2000oti-min-sea-kan521951085.5%2.6%7.76.61103.1%4.2%6.84.9
79Jim Kelly1986--1996buf393301106.1%3.2%86.6673.1%4.6%6.64.6
80John Hadl1962--1977sdg-ram-gnb-oti339411037%3.7%8.26.6923.3%7.8%6.12.7
81Bernie Kosar1985--1996cle-dal-mia25254674.8%1.9%7.46.6663.1%3.4%6.65.1
82Jake Delhomme1999--2011nor-car-cle-htx22822655.5%2.9%7.86.6453.1%4.2%6.64.8
83Vince Evans1977--1995chi-rai9511377.1%3.8%8.26.6572.4%6%6.33.6
84John Elway1983--1998den564391635%2.6%7.76.6922.8%3.9%6.34.6
85Drew Bledsoe1993--2006nwe-buf-dal459461025.1%1.9%7.46.6992.4%4.2%5.94
86Jason Campbell2006--2011was-rai14417323.8%1.7%7.36.6393.3%2.7%6.45.3
87Pete Liske1964--1972nyj-den-phi5170167%2.6%7.66.6232.2%8.2%5.92.3
88Jeff George1990--2001clt-atl-rai-min-was28603485.5%2.7%7.76.6853.2%2.9%6.65.4
89Alex Smith2005--2011sfo13038334.4%1.1%76.6392.9%4.3%64.1
90Jim Zorn1976--1987sea-gnb-tam21249524.9%2.9%7.86.6682.8%5.4%6.13.7
91Lynn Dickey1971--1985oti-gnb23914526.5%4.4%8.46.6763.5%6.6%74.1
92Jon Kitna1997--2011sea-cin-det-dal30104565.7%2%7.46.6862.8%4.7%6.34.3
93Eric Hipple1981--1989det11009306.3%3%7.86.6361.8%5.5%6.44
94Bob Griese1967--1980mia265591087.4%3.9%8.16.5623.5%6.4%6.43.5
95Chris Miller1987--1999atl-ram-den19789375.7%2.4%7.56.5633.6%4.2%6.34.5
96Gus Frerotte1994--2008was-det-den-cin-min-mia-ram21666585.1%2.7%7.66.5602.5%4.1%6.24.4
97Matt Hasselbeck1999--2011gnb-sea-oti35891915.1%2.4%7.56.5803%3.4%6.34.8
98Tarvaris Jackson2006--2011min-sea7239274.5%3.1%7.86.5232.8%3.4%5.84.3
99Jeff Blake1992--2005nyj-cin-nor-rav-crd-phi-chi21711425.1%2.1%7.46.5773.6%3.6%6.34.7
100Tony Eason1983--1990nwe-nyj11703355.1%2.8%7.76.5313.3%3.4%6.75.2
101Jim Harbaugh1987--2000chi-clt-rav-sdg27194784.8%2.1%7.36.5932.3%3.6%6.24.6
102Don Majkowski1987--1996gnb-clt-det12906344.8%2.8%7.76.5432.6%4.2%64.2
103Gary Hogeboom1982--1989dal-clt-crd9598315.1%2.6%7.56.5282.7%6.1%6.74
104Joe Theismann1974--1985was26988956%2.8%7.66.5592.4%5.1%6.34.1
105Randall Cunningham1985--2001phi-min-dal-rav32405986.1%2.6%7.66.5733.1%3.6%6.34.7
106Byron Leftwich2003--2010jax-atl-pit-tam10439305%1.6%7.16.5312.6%3.5%6.24.7
107Tony Banks1996--2005ram-rav-was-htx15315435.2%2.2%7.46.5522%3.7%5.94.3
108Bobby Hebert1985--1996nor-atl22331635.2%3%7.76.5553.5%5%6.24.1
109Greg Landry1968--1984det-clt-chi16100556.7%3.9%8.16.5652.5%4.7%6.34.2
110Eli Manning2004--2011nyg30095775.5%2.2%7.36.4543.7%4.5%6.74.7
111Jay Fiedler1998--2005min-jax-mia-nyj12499505%2.6%7.56.4292.5%5.9%63.4
112Stan Humphries1989--1997was-sdg18538554.4%2.3%7.46.4392.2%5.1%5.93.7
113Jim Plunkett1971--1986nwe-sfo-rai28175855.6%3.4%7.96.4823.2%7.1%6.43.2
114Elvis Grbac1994--2001sfo-kan-rav17492614.8%2.4%7.46.4393.1%4.4%6.24.3
115Richard Todd1976--1985nyj-nor21636515.2%3.6%7.96.4703.2%7%6.23.1
116Steve Grogan1975--1990nwe27457806.7%4.3%8.26.4713.5%7.2%6.83.6
117Frank Ryan1960--1970ram-cle-was15833669.3%4.4%8.26.4424%6.1%6.63.9
118Carson Palmer2004--2011cin-rai25659505.9%2.9%7.66.4593.8%3.5%6.95.3
119Shaun Hill2005--2011min-sfo-det6209185.5%1.8%7.16.4163.2%2.8%6.35.1
120Mark Rypien1988--2001was-cle-ram-phi-clt20249585.7%3.3%7.76.4472.9%3.6%6.54.9
121Bubby Brister1986--2000pit-phi-nyj-den-min14801475.7%2.3%7.36.4511.9%4.3%5.93.9
122Kerry Collins1995--2011car-nor-nyg-rai-oti-clt42478924.4%2.1%7.26.41132.7%4%6.14.3
123Steve McNair1995--2007oti-rav330681004.6%2.1%7.26.4722.6%3.4%6.44.9
124Charlie Batch1998--2011det-pit10610405.2%2.8%7.56.3373.1%3.4%6.65.1
125Bill Nelsen1963--1972pit-cle15004466.5%4.1%86.3433%7.2%6.53.4
126Charley Johnson1961--1975crd-oti-den24410687.3%4.7%8.36.3703%5.9%6.33.6
127Steve Bartkowski1975--1986atl-ram24916605.9%3.1%7.66.3733.5%5.2%6.54.3
128Sam Bradford2010--2011ram567684.1%1.5%6.96.3181.9%2.5%5.64.5
129Gary Danielson1977--1988det-cle14000424.9%2.9%7.56.3433.5%5.3%6.74.4
130Brian Sipe1974--1983cle23896606%3.2%7.66.3623%5.4%6.23.8
131Jay Schroeder1985--1994was-rai-cin-crd20854715.2%2.7%7.46.3502.7%5.3%6.64.3
132Virgil Carter1968--1976chi-cin-sdg5127215.7%3%7.56.3242.1%4.7%5.63.5
133Tommy Kramer1977--1990min-nor25651645.9%2.8%7.46.3662.9%5.7%6.23.7
134Brad Johnson1994--2008min-was-tam-dal304571024.6%2.1%7.16.2702.9%3.9%6.24.5
135Kelly Holcomb1995--2007tam-clt-cle-buf-min645395.5%3.4%7.76.2294%4.5%6.54.6
136Quincy Carter2001--2004dal-nyj6491204.7%2.2%7.16.2181.8%5.3%5.93.5
137Ryan Fitzpatrick2005--2011ram-cin-buf10936226.2%2.4%7.26.2342.9%4.5%5.93.9
138Neil O'Donnell1991--2003pit-nyj-cin-oti23399725%2%76.2582.5%2.3%6.35.4
139James Harris1969--1979buf-ram-sdg8479445.8%4.2%86.2341.8%6.6%63.1
140Brian Griese1998--2008den-mia-tam-chi19440535.2%2.8%7.46.2403.3%4.2%6.64.7
141Terry Bradshaw1970--1983pit318221257%4.3%86.2623%7.3%6.12.9
142Bill Munson1964--1979ram-det-sea-sdg-buf12940416.4%2.6%7.26.2582.8%5%6.13.9
143Steve Tensi1966--1970sdg-den5558158.5%4.4%86.1293.5%5.7%5.83.3
144Jeff Kemp1981--1991ram-sfo-sea-phi6403286.7%2.9%7.36.1261.9%5.5%6.33.8
145Ty Detmer1993--2001gnb-phi-sfo-cle-det6499184.9%2.5%7.16.1242.7%4.6%6.54.4
146Billy Wade1960--1966ram-chi11390346.1%3.5%7.66.1333.8%6.3%6.43.7
147Dave M. Brown1992--2000nyg-crd10304294.1%2.5%7.26.1421.9%4.2%5.84
148Mark Sanchez2009--2011nyj10364305.1%2%6.96.1222.9%5%6.24
149Joe Ferguson1973--1990buf-det-tam-clt30631836.4%3.1%7.46.11073%5.8%6.13.5
150Norm Snead1961--1976was-phi-min-nyg-sfo30797576.9%4.3%7.96.11143.5%6.7%6.73.7
151Dennis Shaw1970--1975buf-crd6347125.9%5.3%8.46.1342.8%8.1%6.52.9
152Vince Ferragamo1977--1986ram-buf-gnb12564357.1%3.7%7.66.1422.9%7.1%6.53.4
153Jake Plummer1997--2006crd-den30593744.7%2.5%7.16.1752.9%4.8%6.44.3
154Tommy Maddox1992--2005den-ram-nyg-pit8754275.9%3.2%7.46.1282.6%5.3%6.13.7
155Daryle Lamonica1963--1974buf-rai210821047.8%4.6%86.1373%7.3%62.8
156Kyle Orton2005--2011chi-den-kan14532364.5%1.9%6.86.1353%3.1%6.45
157Roman Gabriel1962--1977ram-phi29780875.7%2.6%7.16.1793.2%4%5.84.1
158Bob Lee1969--1980min-atl-ram5416605.9%4.8%8.16.1241.2%6.2%52.3
159David Carr2002--2010htx-car-nyg-sfo14433323.4%2.2%76.1612.7%3.4%6.24.7
160Jack Trudeau1986--1995clt-nyj-car10494253.2%2.4%7.16432.3%5.2%5.83.5
161Steve Fuller1979--1986kan-chi7454334%3.5%7.56291.9%4%6.24.5
162Danny White1976--1988dal242431245.8%4%7.76594%5.3%6.74.4
163Archie Manning1971--1984nor-oti-min23911374.4%3.2%7.461103.1%5.1%6.34.1
164Ken Stabler1970--1984rai-oti-nor305791106.6%4.6%7.96643%7.3%6.53.3
165Doug Williams1978--1989tam-was18108495.4%2.8%7.26453.1%4.8%6.54.4
166Joe Pisarcik1977--1984nyg-phi5552254.6%4.1%7.86322.1%5.7%5.73.1
167Jim McMahon1982--1996chi-sdg-phi-min-crd-gnb19260864.5%3.3%7.46402.6%3.8%6.44.8
168Milt Plum1960--1969cle-det-ram-nyg13335466.9%4.9%8.16403.1%6%6.33.7
169Ron Jaworski1974--1989ram-phi-mia-kan29859895.4%2.9%7.26793.4%4.8%6.54.4
170Rodney Peete1989--2004det-dal-phi-was-car16636554.3%3.4%7.56482.2%4.3%6.54.6
171Vinny Testaverde1987--2007tam-cle-rav-nyj-dal-nwe-car475531025.3%3.1%7.361373.3%4.5%6.74.7
172Billy Kilmer1961--1978sfo-nor-was21555886.7%3.7%7.56813.3%5.9%6.13.5
173Tim Couch1999--2003cle11131225.5%3.2%7.36402.7%4.3%64.1
174Erik Kramer1987--1999atl-det-chi-sdg16336384.9%2.4%76483.4%4.1%6.54.7
175Trent Dilfer1994--2007tam-rav-sea-cle-sfo21489685.3%2.7%7.16652%5.1%63.7
176Mike Pagel1982--1993clt-cle-ram9593224.5%2.6%7.16532.9%4.9%63.8
177Kordell Stewart1995--2005pit-chi-rav15490763.5%2.1%6.85.9542.7%5.6%5.53
178Chad Henne2008--2011mia7114143.6%1.7%6.65.9202.4%4.6%6.74.7
179Jim Hart1966--1984crd-was35156935.7%4%7.65.91032.9%5.5%6.23.8
180Vince Young2006--2011oti-phi9102354.5%3%7.15.9272.2%4.9%6.54.3
181Josh McCown2002--2011crd-det-rai-car-chi6998154.2%1.6%6.55.9362.9%5.2%6.23.9
182Mark Malone1981--1989pit-sdg-nyj10733296.3%3%7.15.8442.3%5.9%5.83.2
183Babe Parilli1960--1969rai-nwe-nyj18778647.1%4.1%7.55.8473.2%7.5%5.92.5
184Don Strock1974--1988mia-cle5913377.1%3.6%7.35.8304.5%7.3%6.63.3
185Dick Wood1962--1966sdg-nyj-rai-mia7153177.1%3.4%7.25.8282.6%7.3%5.32.1
186Shaun King1999--2004tam-crd5057195.9%2.3%6.75.8161.1%4.1%5.53.7
187Pat Haden1976--1981ram10024414.4%2.9%75.8263.1%7.1%6.43.3
188Bobby Douglass1969--1978chi-sdg-nor-gnb6493166.2%3.5%7.25.8572.1%5.8%5.12.5
189Cotton Davidson1960--1968kan-rai11451306.5%4.1%7.55.7402.9%7.2%6.33.1
190Steve Bono1985--1999min-pit-sfo-kan-gnb-ram-car10576494.6%1.8%6.45.7262.5%3.7%5.74.1
191Marc Wilson1980--1990rai-nwe14526395.8%4%7.45.7422.8%5.8%6.53.9
192Billy Joe Tolliver1989--1999sdg-atl-oti-kan-nor10760245%2.6%6.85.7533%4.1%6.14.4
193Rick Mirer1993--2003sea-chi-nyj-sfo-rai11969273.9%2.4%6.65.6521.8%4.4%5.53.5
194Steve Ramsey1970--1976nor-den6437235.4%5.9%8.15.6282.4%6.5%6.33.4
195Jacky Lee1960--1969oti-den-kan6191309%7%8.55.5294%6.9%6.63.6
196Hugh Millen1987--1995ram-atl-nwe-den644082.3%4.2%7.45.5302.4%3.6%6.85.2
197Jim Ninowski1960--1969det-cle-was-nor6953334.3%4.5%7.55.5272.6%7.4%6.22.9
198Dave Wilson1981--1988nor7007164.2%5.2%7.85.5373.1%5.5%6.23.8
199Kyle Boller2003--2011rav-ram-rai8931304.1%1.7%6.25.5362.6%4.7%5.73.6
200Joey Harrington2002--2007det-mia-atl14693274.4%2.2%6.45.5552.5%3.8%5.53.9
201Todd Blackledge1983--1989kan-pit5366225.2%3.4%6.95.5221.7%5.2%5.32.9
202Mike Tomczak1985--1999chi-gnb-cle-pit16963793.8%3.9%7.15.5593.4%5.3%6.64.2
203Mike Livingston1968--1979kan11295374.4%3.2%6.85.5522.4%5.7%6.23.7
204Danny Kanell1996--2003nyg-atl-den5328145.3%2.5%6.55.5252.2%4%4.93.2
205Steve Dils1980--1988min-ram-atl5816183.5%2.6%6.55.4292.4%3.6%5.74.1
206Jack Thompson1979--1984cin-tam5329155.3%1.8%6.15.4303.5%6.2%6.33.6
207Kent Graham1992--2001nyg-crd-pit-was7801274.4%1.6%65.4331.8%3.1%5.74.3
208David Woodley1980--1985mia-pit9203384.4%3.5%6.95.4243%7.4%6.33.1
209Randy Johnson1966--1976atl-nyg-was-gnb8329147.8%4.4%7.25.4583.2%7.6%6.33
210Rex Grossman2003--2011chi-htx-was11015304.7%3.3%6.85.4272.3%4.3%6.24.3
211Jim Miller1995--2002pit-chi6410203.9%2.9%6.65.3183%3.2%5.64.3
212Dan Pastorini1971--1983oti-rai-ram-phi19469624.6%4.2%7.15.3812.5%6.1%5.42.7
213Paul McDonald1980--1984cle5550123.8%3.4%6.85.3232.8%5.1%74.7
214George Blanda1960--1975oti-rai220291428.4%6%7.85.3793.9%8%6.12.5
215Jack Kemp1960--1969sdg-buf22256714.6%5.2%7.55.2462.2%7.1%6.23
216David Whitehurst1977--1983gnb6205216.1%5.3%7.45.1301.1%5.4%5.73.3
217Zeke Bratkowski1960--1971chi-ram-gnb8005304.7%5.5%7.55.1453.5%8.9%6.62.7
218Steve Spurrier1967--1976sfo-tam6878486.4%4.9%7.15.1532.2%5.2%5.43.1
219Joe Kapp1967--1970min-nwe6746266.6%6.2%7.75.1262.2%8.1%5.72.1
220Bob Avellini1975--1984chi7288304.2%5.9%7.55362.3%6.8%5.72.7
221Frank Tripucka1960--1963den7676135.1%5.9%7.55293.3%6.7%5.22.3
222Pete Beathard1964--1973kan-oti-crd-ram8544404.5%5.3%7.24.9342.5%7.3%5.62.4
223Gary Cuozzo1963--1972clt-nor-min-crd7688474.6%3.9%6.54.9352.9%5.7%63.5
224Al Dorow1960--1962nyj-buf5732145.7%5%6.94.8184.7%8.5%5.82.1
225Steve Walsh1989--1999dal-nor-chi-ram-tam-clt8248273.9%3.2%6.24.8342.4%4.5%5.93.9
226Mike Phipps1970--1981cle-chi10806504.5%3.7%6.44.8511.7%8.4%5.31.6
227Scott Brunner1980--1985nyg-crd6843163.7%3.7%6.34.7293%5.8%6.23.6
228Jack Concannon1964--1975phi-chi-gnb-det6270274.6%4.3%6.54.6322.5%6.8%5.12.1
229Mike Taliaferro1964--1972nyj-nwe-buf5241198.2%4.7%6.34.4412.2%7.2%5.11.9

[continue reading…]

References

References
1 Unfortunately, I excluded sack data from this study due to its general unavailability for most of the covered time period.
{ 0 comments }

Post your Playoff Predictions

Before the playoffs start, I figured I should write down my predictions somewhere. I encourage everyone to post that predictions in the comments. Here are mine:

Wild Card Round
Saturday, Jan. 5, 4:30 p.m.: Bengals at Texans — Texans
Saturday, Jan. 5, 8:00 p.m.: Vikings at Packers — Packers
Sunday, Jan. 6, 1:00 p.m.: Colts at Ravens — Ravens
Sunday, Jan. 6, 4:30 p.m.: Seahawks at Redskins– Seahawks

Divisional Round
Saturday, Jan. 12, 4:30 p.m.: Ravens/ Colts/ Bengals at Broncos — Broncos
Saturday, Jan. 12, 8 p.m.: Packers/ Redskins/ Seahawks at 49ers — 49ers
Sunday, Jan. 13, 1 p.m.: Redskins/ Seahawks/ Vikings at Falcons — Seahawks
Sunday, Jan. 13, 4:30 p.m.: Texans/ Ravens/ Colts at Patriots — Patriots

Conference Championship Round

Sunday, Jan. 21: 3:00 p.m.: Seahawks at 49ers 49ers
Sunday, Jan. 21: 6:30 p.m.: Patriots at Broncos Broncos

Super Bowl
Sunday, Feb. 3, 2013 – 6:30 p.m.: Broncos vs. 49ersBroncos

{ 11 comments }

Season in review: AFC and NFC North

On Monday, I examined the seasons of the teams in the AFC and NFC East. Today I will do the same for the AFC and NFC North, starting in the AFC.

AFC North

Pittsburgh Steelers

Pre-season Projection: 10 wins
Maximum wins: 11 wins (after weeks 2, 5, and 9)
Minimum wins: 8 (after week 16)
Week 1 comment: Sunday Night was one of the best games I’ve seen from Ben Roethlisberger. An elite team that will be favored to win most weeks, although questions remain about the offensive line, the running backs, and the age of the defense.

Pittsburgh started off 6-3 and looked like a contender, but tanked in the second half of the season once Roethlisberger went down. Even when Roethlisberger returned, the offense never quite looked right. Jonathan Dwyer, Isaac Redman, and Rashard Mendenhall were unexciting plodders, which is an improvement over the 25 carries that went to Baron Batch. No Steeler finished the season with more than two rushing touchdowns. In the passing game, Mike Wallace and Antonio Brown both failed to match last year’s lofty numbers. The potential was there, but the results were not in Pittsburgh in 2012.

On the other side of the ball, Pittsburgh’s defense performed well by conventional measures — through week 16 (which is when they were knocked out of the playoff race), they ranked 1st in yards allowed and first downs allowed, and ranked 2nd in net yards per attempt allowed, rushing yards and rushing yards per carry allowed. But the defense wasn’t really up to Steelers standards — through week 16, they ranked 10th in points allowed and, more damningly, had forced more turnovers than just three teams. Pittsburgh allowed 5 4th quarter game-winning drives, which ultimately cost them the playoffs.

Baltimore Ravens

Pre-season Projection: 10 wins
Maximum wins: 11 wins (first after week 3, last after week 13)
Minimum wins: 9 wins (after week 15)
Week 1 comment: Great performance on Monday Night, but I have to imagine missing Terrell Suggs is going to hurt this team. He’s too good to simply expect business as usual in Baltimore, and their schedule (AFC West, NFC East, Houston, New England outside the division) is riddled with traps.

The schedule was riddled with traps, but the Ravens rode some late-game success and excellent special teams to a 9-2 record. At that point, I wrote: I still don’t believe in this team, because they aren’t going to have amazing special teams or amazing 4th and 29 conversions every week.

Joe Flacco had a solid but not great year, while Ray Rice continued to prove effective when given the carries. The big issue for Baltimore was defensively. Through 16 weeks, the Ravens ranked 20th in yards allowed, 18th in NY/A, and 24th in first downs allowed. While the Ravens won the North, 8 games out of Terrell Suggs, 6 games of Ray Lewis, and 6 games of Lardarius Webb simply wasn’t enough to give them the defense Ravens fans were used to seeing.
[continue reading…]

{ 0 comments }

NYT Fifth Down: Post-week 17

At the New York Times Fifth Down Blog this week, I explain my choices for the major awards this season.

Offensive Player of the Year: Adrian Peterson, Minnesota Vikings

Generally, the Most Valuable Player award is given to the best quarterback, while the Offensive Player of the Year is usually the player with the most impressive statistics. In the last five years, Tom Brady — first in 2007, and then again in 2010 — is the only player to take home both awards in the same season. Last year, Drew Brees won the award while Aaron Rodgers took home the M.V.P., but running backs Priest Holmes (2002), Jamal Lewis (2003), Shaun Alexander (2005), LaDainian Tomlinson (2006), and Chris Johnson (2009) have all won the award in the last decade. While Calvin Johnson will probably get some support for breaking Jerry Rice’s single-season record for receiving yards, Adrian Peterson has had this award locked up for a month, and finishing the season with 2,097 yards was the icing on the cake.

I don’t think you’ll find too many people arguing about this one. Peterson’s story is outstanding, and it’s hard to argue that he didn’t provide the single most impressive performance by an offensive player this year. Quarterbacks may be more valuable, but it’s hard not to just sit back and admire what Peterson’s done. Johnson’s also had a magnificent season, but he was greatly aided by the Lions also breaking the record for pass attempts in a season.

Defensive Player of the Year: J.J. Watt, Houston Texans

The shine is off the Texans, but there’s no denying that their star lineman has been outstanding this year. If the stars were aligned slightly differently — say, the Texans were streaking towards the end of the year, and Watt had a monster primetime game late — he’d have a legitimate chance at the M.V.P. award. Last month, I talked about how this award was a three-man race with the stars all coming from the 2011 Draft. In that article I also mentioned Geno Atkins as a possible darkhorse, and he’s been ever better since. But Watt has 20.5 sacks and the national reputation as the Sultan of Swatt, so this award is pretty easy to predict.

And well justified. Watt’s production as a 3-4 defensive end is remarkable. He now owns the single-season record for sacks by a player at that position, but he’s far from one dimensional. We know that he is fantastic at tipping passes at the line of scrimmage and is excellent in run support. He’s a complete player in every respect, a dominant force at a position that rarely receives media attention.

I’d select Von Miller as my runner-up and give Atkins the bronze. While Aldon Smith gets more attention because of his lofty sack totals, he’s a one-dimensional player. While he’s outstanding at that one dimension, just being a dominant pass rusher only makes him the fourth best defensive player this year. He also disappeared down the stretch, which not coincidentally began when star defensive end Justin Smith went down with a triceps injury.

Comeback Player of the Year: Peyton Manning, Denver Broncos

Peyton Manning missed the entire 2011 season, but as soon as he took the field in 2012 he became the favorite to win Comeback Player of the Year. A quarterback has won this award each of the last four years — Chad Pennington (2008), Tom Brady (2009), Michael Vick (2010), and Matthew Stafford (2011) — and the trend should continue in 2012. Comeback Player of the Year is a two-man race, and there’s no wrong answer when choosing between Manning and Peterson. If the voters could, surely the majority would pick that Manning and Peterson split the award. If ever an award called for a split, this was it.

Peyton Manning’s neck injury was considered career-threatening this time last year. Many questioned his arm strength in the pre-season and in September, but by the end of the year he was once again the best quarterback in the league. It’s simply splitting hairs picking between Manning and Peterson, who tore two ligaments in his knee just over a year ago and rebounded to rush for 2,000 yards. And let’s at least recognize Jamaal Charles, who in any other year would likely take home the award. The Kansas City running back tore the anterior cruciate ligament in his left knee last season, and rebounded to rush for over 1,500 yards in 2012. My guess is that those voters looking for a tiebreaker focus on the fact that Manning missed the entire 2011 season while Peterson ran for 970 yards and 12 touchdowns last year, making Manning more of a “comeback” story.

You can view the full post here.

{ 3 comments }

Three weeks ago, I set forth the argument that perhaps Calvin Johnson was not even the most productive receiver in his own division. While Megatron racked up the numbers, I argued that you have to account for the situation. The relevant situation here is that the Lions ran an incredible 1,160 plays compared to just 999 for the Bears, and Detroit attempted 740 passes while Chicago threw only 485 times.

When one team throws 255 more passes than the other, I don’t think it’s appropriate to compare the receivers based on their raw receiving yards. One thing we could look at is yards per team attempt. The table below lists the number of team attempts for each wide receiver, his raw receiving statistics, and also his yards per attempt. The table is sorted by yards per team passing attempt. And while it is not relevant when discussing Marshall and Megatron, I have also included a Pro-rated Yards per Attempt column, which pro-rates the number of team attempts for the number of games played by the receiver (this helps Percy Harvin, of course).

RkPlayerTmGTmAttRecYdsYPRTDY/APY/A
1Brandon MarshallCHI16485118150812.8113.113.11
2Andre JohnsonHOU16554112159814.342.882.88
3Calvin JohnsonDET16740122196416.152.652.65
4Michael CrabtreeSFO164368511051392.532.53
5A.J. GreenCIN1654097135013.9112.52.5
6Vincent JacksonTAM1656672138419.282.452.45
7Demaryius ThomasDEN1658894143415.3102.442.44
8Steve SmithCAR1649073117416.142.42.4
9Roddy WhiteATL1661592135114.772.22.2
10Reggie WayneIND16628106135512.852.162.16
11Brian HartlineMIA1650474108314.612.152.15
12Wes WelkerNWE16641118135411.562.112.11
13Dez BryantDAL1665892138215122.12.1
14Steve JohnsonBUF1651179104613.262.052.05
15Victor CruzNYG1653986109212.7102.032.03
16Julio JonesATL1661579119815.2101.951.95
17Sidney RiceSEA16405507481571.851.85
18Eric DeckerDEN1658885106412.5131.811.81
19Mike WilliamsTAM165666399615.891.761.76
20Greg OlsenCAR164906984312.251.721.72
21Marques ColstonNOR1667183115413.9101.721.72
22Randall CobbGNB155588095411.981.711.82
23Golden TateSEA154054568815.371.71.81
24Dwayne BoweKAN134755980113.631.692.08
25Jeremy KerleyNYJ164935682714.821.681.68
26Cecil ShortsJAX145865597917.871.671.91
27Anquan BoldinBAL155606592114.241.641.75
28Jason WittenDAL1665811010399.431.581.58
29Lance MooreNOR156716510411661.551.65
30Davone BessMIA135046177812.811.541.9
31Malcom FloydSDG145285681414.551.541.76
32Torrey SmithBAL165604985517.481.531.53
33Tony GonzalezATL16615939301081.511.51
34Justin BlackmonJAX165866486513.551.481.48
35Jimmy GrahamNOR156718598211.691.461.56
36Mike WallacePIT155746483613.181.461.55
37Miles AustinDAL166586694314.361.431.43
38Pierre GarconWAS104424463314.441.432.29
39Josh GordonCLE165665080516.151.421.42
40Heath MillerPIT155747181611.581.421.52
41Brandon LloydNWE166417491112.341.421.42
42James JonesGNB165586478412.3141.411.41
43Percy HarvinMIN94836267710.931.42.49
44Jeremy MaclinPHI156186985712.471.391.48
45Brandon LaFellCAR144904467715.441.381.58
46Nate WashingtonTEN165404674616.241.381.38
47Antonio BrownPIT135746678711.951.371.69
48T.Y. HiltonIND156285086117.271.371.46
49Jermaine GreshamCIN165406473711.551.361.36
50Jordy NelsonGNB125584974515.271.341.78
51Larry FitzgeraldARI166087179811.241.311.31
52Santana MossWAS16442415731481.31.3
53Owen DanielsHOU155546271611.561.291.38
54Hakeem NicksNYG135395369213.131.281.58
55Brandon MyersOAK166297980610.241.281.28
56Vernon DavisSFO164364154813.451.261.26
57Chris GivensSTL155574269816.631.251.34
58Andre RobertsARI156086475911.951.251.33
59Danario AlexanderSDG105283765817.871.251.99
60Donnie AveryIND16628607811331.241.24
61Brandon GibsonSTL165575169113.551.241.24
62Rob GronkowskiNWE116415579014.4111.231.79
63Leonard HankersonWAS164423854314.331.231.23
64Danny AmendolaSTL115576366610.631.21.74
65Jermichael FinleyGNB165586166710.921.21.2
66Dennis PittaBAL16560616691171.191.19
67Denarius MooreOAK156295174114.571.181.26
68Martellus BennettNYG165395562611.451.161.16
69Kendall WrightTEN15540646269.841.161.24
70Josh MorganWAS164424851010.621.151.15

Why can't we throw it like the Lions do??

Why can't we throw it like the Lions do??


As it turns out, Calvin Johnson was neither the best Johnson nor the best receiver in his division, at least as measured by this metric. I’m not convinced or even arguing that yards/attempt is the best way to rank receivers, but I do think the statistic represents an improvement on just receiving yards. Since receiving yards are so highly correlated with attempts, some adjustment needs to be made, and I plan on providing more analysis on how to grade wide receivers this off-season.
[continue reading…]

{ 3 comments }

Season in review: AFC and NFC East

This season, I published power rankings after each week where I stated my updated projected number of wins for each team. The point of those posts was to put in writing my thoughts at that time, so that once the season was over, I could look back and see how I did. Over the next two weeks, that’s exactly what we’re going to do.

The picture below graphs my projections for each team for each week of the season. I’ve also added the Vegas futures win totals for each team from the pre-season as the first data point in each graph and the final number of regular season wins for each team as the final data point. My projected win totals for each week N come following the conclusion of week N (i.e., my week 1 power rankings were released after week 1).

AFC East

New England Patriots

Pre-season Projection: 12 wins
Maximum wins: 13 (after weeks 1 and 14)
Minimum wins: 10 (after weeks 6 and 7)
Week 1 comment: Incredible offensive weapons, an improved defense and a cupcake schedule. Only injuries on the offensive line or to Tom Brady could derail them.

The Patriots started hot with a big win over the Titans, but managed to lose nail-biters to the Cardinals and Ravens the next two weeks. A loss in Seattle — which was an upset, at the time — dropped them to 3-3 and my projected total to just 10 wins. An overtime win over the Jets the following week was unimpressive and didn’t cause me to bump them, but I kept steadily increasing their win total after that.

In the end, it was another monster statistical season for Brady and the Patriots. New England broke a record for offensive first downs and finished with the third most points scored in a season. I was a little bumpy in my New England projections, but they ended up landing right on the Vegas number.

New York Jets
Pre-season Projection: 8.5 wins
Maximum wins: 9 (after weeks 1 and 2)
Minimum wins: 6 (first after week 8)
Week 1 comment: The additions of Quinton Coples and LaRon Landry were easy to mock, but these two could make the Jets defense a top-three unit. So far, so good. Right tackle Austin Howard exceeded expectations by infinity against Mario Williams, and his play this year will be tied to the Jets success on offense.

The Jets best game of the season came in week 1, which inspired a glimmer of early-season hope. In the end, Coples and Landry had strong seasons, but the loss of Darrelle Revis and the disappointing years by Calvin Pace, Bryan Thomas, and Aaron Maybin prevented the Jets from having a complete defense. Mark Sanchez regressed, and injuries to Santonio Holmes, Dustin Keller, and Stephen Hill didn’t help the offense. Rex Ryan lost control of the team, again, and the Jets struggled against good teams early before disappointing against bad teams late. For the second straight year, the Jets lost their final three games of the season, and it appears like they will fire the offensive coordinator again, too.
[continue reading…]

{ 1 comment }

In 2011, the Broncos scored 309 points and allowed 390 points. Despite being outscored by 81 points, the Tim Tebow express still made it into the post-season. In June, I speculated that the 2012 Broncos might set the record for the largest increase in pass completions in one year, and they did just that on Sunday. They also moved into fourth place on another list.

With 481 points and 289 points allowed, Denver outscored its opponents by 192 points in 2012. Peyton Manning and Von Miller have turned the Broncos into one of the best teams in the league a year after they were one of the worst (at least, as measured by points differential). Denver improving their points differential by a whopping 273 points this year relative to 2011, the fourth largest increase in football history.

RankYearTeamPFPADiffN-1 PFN-1 PAN-1 DiffImpr
11999St. Louis Rams526242284285378-93377
21929New York Giants3128622679136-57283
32001Chicago Bears338203135216355-139274
42012Denver Broncos481289192309390-81273
51998Minnesota Vikings556296260354359-5265
61975Baltimore Colts395269126190329-139265
72004San Diego Chargers446313133313441-128261
82006New Orleans Saints41332291235398-163254
91965Chicago Bears409275134260379-119253
102008Baltimore Ravens385244141275384-109250
111955Washington Redskins24622224207432-225249
121976New England Patriots376236140258358-100240
131963Oakland Raiders36328281213370-157238
141997New York Jets34828761279454-175236
151923Columbus Tigers119358424174-150234
161987Indianapolis Colts30023862229400-171233
171991Cleveland Browns293298-5228462-234229
181967New York Giants369379-10263501-238228
191969Atlanta Falcons2762688170389-219227
202010Detroit Lions362369-7262494-232225
211976Chicago Bears25321637191379-188225
222001Cleveland Browns285319-34161419-258224
231999Indianapolis Colts42333390310444-134224
242000New Orleans Saints35430549260434-174223
252010St. Louis Rams289328-39175436-261222
{ 1 comment }

Trent Richardson thinks this guy was an average running back in losses.

Trent Richardson thinks this guy was an average running back in losses.

Yesterday, I noted that Adrian Peterson is averaging nearly two more yards per rush in losses than wins. He’s also averaging a nearly identical number of rushing yards per game in wins and losses.

As you’re about to see, that’s pretty rare. We all know that wins are correlated with rushing yards, so it should come as no surprise that running backs generally gain more rushing yards in wins than in losses.

I looked at all games, including playoffs, from 1960 to 2011, for all players with at least 3,000 rushing yards over that time period. The table below lists the following information for each player:

— His first year (or 1960, if he played before 1960) and his last year (or 2011, if still active)
— All the franchises he played for (which you can search for in the search box)
— His number of career wins, and his career rush attempts, rushing yards, rushing yards per carry, and rushing yards per game in wins
— His number of career losses, and his career rush attempts, rushing yards, rushing yards per carry, and rushing yards per game in losses

The table is sorted by rushing yards per game in wins. Again, for players like Jim Brown or Peterson, they are included but only their stats from 1960 to 2011 are shown. The table only shows the top 50 players, but the search feature works for the entire table, which includes 281 players. In addition, you can click on the drop arrow and change the number of rows shown.

As always, the table is fully sortable. If you click twice on the far right column, you see the career leaders in rushing yards per game in losses. You probably aren’t surprised to see Barry Sanders at the top, but the presence of the running back formerly known as Dom Davis up there is a bit surprising. Steven Jackson is one of the few players who have averaged over 70 rushing yards per game in losses, which jives with the sixth post in Football Perspective history. In addition, Jackson (at least through 2011) and LaDainian Tomlinson form an interesting example of Simpson’s Paradox: Jackson has a higher career rushing yards per game average in both wins (93.9 to 89.9) and losses (71.1 to 63.2), while Tomlinson has the higher career average overall (78.6 to 78.3).

RkPlayerYearsTeamsPosWRsh_WYd_WYPC_WYd/G_WLRsh_LYd_LYPC_LYd/G_L
1Jim Brown1960--1965cleFB55117665905.6119.82538417064.4468.2
2Terrell Davis1995--2001denRB58141568674.85118.42844418804.2367.1
3Barry Sanders1989--1998detRB75167085265.11113.784148371294.8184.9
4Eric Dickerson1983--1993ram-clt-rai-atlRB74177684114.74113.778136855724.0771.4
5O.J. Simpson1969--1979buf-sfoRB4395048185.0711292144263514.469
6Earl Campbell1978--1985oti-norRB50120954094.47108.270111344183.9763.1
7Adrian Peterson2007--2011minRB3879240025.05105.33868530184.4179.4
8Chris Johnson2008--2011otiRB3677237764.89104.92842619414.5669.3
9Clinton Portis2002--2010den-wasRB58128160514.72104.359101940864.0169.3
10Arian Foster2009--2011htxRB2042820774.85103.91628213054.6381.6
11Emmitt Smith1990--2004dal-crdRB1353036131984.3597.8108172267433.9262.4
12Jamal Lewis2000--2009rav-cleRB74165371934.3597.263101938403.7761
13Walter Payton1975--1987chiRB1132460109754.4697.186155863834.174.2
14Larry Johnson2003--2011kan-cin-was-miaRB4081338424.7396.14362724133.8556.1
15Edgerrin James1999--2009clt-crd-seaRB99225194694.2195.66299536293.6558.5
16Billy Sims1980--1984detRB3060328614.7495.43255423784.2974.3
17Curtis Martin1995--2005nwe-nyjRB96223591344.0995.182146557623.9370.3
18Frank Gore2005--2011sfoRB4793944224.7194.15574333664.5361.2
19Jamaal Charles2008--2011kanRB1621815046.9943429016055.5347.2
20Steven Jackson2004--2011ramRB3776934734.5293.980138856884.171.1
21Shaun Alexander2000--2008sea-wasRB73150666074.3990.55985034104.0157.8
22LaDainian Tomlinson2001--2011sdg-nyjRB104204893464.5689.976125748063.8263.2
23Corey Dillon1997--2006cin-nweRB72139164604.6489.786134752893.9361.5
24Rudi Johnson2001--2008cin-detRB4190136724.0889.65262923633.7645.4
25Eddie George1996--2004oti-dalRB90209478633.7687.46097733543.4355.9
26Wilbert Montgomery1977--1985phi-detRB55101647664.6986.75465225133.8546.5
27Fred Taylor1998--2010jax-nweRB89158876744.8386.272107546344.3164.4
28Jamal Anderson1994--2001atlRB3776731894.1686.24763224233.8351.6
29Gale Sayers1965--1971chiRB2942624925.8585.93651021224.1658.9
30Barry Foster1990--1994pitRB3570429974.2685.62327512304.4753.5
31Curt Warner1983--1990sea-ramRB55113347044.1585.54863623893.7649.8
32Matt Forte2008--2011chiRB3566129854.5285.32739513983.5451.8
33Cookie Gilchrist1962--1967buf-den-miaFB3462528714.5984.43137213813.7144.5
34William Andrews1979--1986atlRB4374936094.8283.94258624394.1658.1
35Marshall Faulk1994--2005clt-ramRB99177483074.6883.989122745743.7351.4
36John Henry Johnson1960--1966pit-otiFB-HB3258926824.5583.83843517183.9545.2
37Tony Dorsett1977--1988dal-denRB1212237101374.5383.868100139853.9858.6
38Jerome Bettis1993--2005ram-pitRB111233392743.9883.593134550623.7654.4
39Priest Holmes1997--2007rav-kanRB61109350774.6583.24972933164.5567.7
40Ricky Watters1992--2001sfo-phi-seaRB91182375524.14836396337203.8659
41Jim Nance1965--1973nwe-nyjRB3057124554.381.86268025853.841.7
42Robert Smith1993--2000minRB63103951464.9581.74151722624.3855.2
43George Rogers1981--1987nor-wasRB53100943264.2981.64577231284.0569.5
44Jim Taylor1960--1967gnb-norFB81146865764.4881.23140115823.9551
45Travis Henry2001--2007buf-oti-denRB3667229064.3280.75281631803.961.2
46Willie Parker2004--2009pitRB5597744364.5480.72740314133.5152.3
47Ray Rice2008--2011ravRB4579236274.5880.62227411944.3654.3
48Maurice Jones-Drew2006--2011jaxRB4577636164.6680.45072232864.5565.7
49Deuce McAllister2001--2008norRB5091340174.480.34754322404.1347.7
50Thurman Thomas1988--2000buf-miaRB1302373103784.3779.87184331383.7244.2
51Terry Allen1991--2001min-was-nwe-nor-ravRB69130355044.2279.86589032633.6750.2
52Fred Jackson2007--2011bufRB2539319805.0479.24042418144.2845.4
53Jonathan Stewart2008--2011carRB2841422175.3679.23531412954.1237
54Franco Harris1972--1984pit-seaRB1362553106824.1878.55577629243.7753.2
55John Riggins1971--1985nyj-wasRB103204880883.9578.579111942603.8153.9
56Tiki Barber1997--2006nygRB80127762694.9178.480105446324.3957.9
57Lydell Mitchell1972--1980clt-sdg-ramRB58110344724.0577.14964522803.5346.5
58Ricky Williams1999--2011nor-mia-ravRB81148662214.1976.8709673868455.3
59Greg Bell1984--1990buf-ram-raiRB3559626414.4375.55068426763.9153.5
60Marshawn Lynch2007--2011buf-seaRB3159223373.9575.44356823384.1254.4
61Stephen Davis1996--2006was-car-ramRB72123454224.3975.36380731013.8449.2
62LeSean McCoy2009--2011phiRB2842721004.9275202259964.4349.8
63Domanick Williams2003--2005htxRB122268983.9774.82854422974.2282
64Hoyle Granger1966--1972oti-norRB2744320134.5474.63835815304.2740.3
65DeAngelo Williams2006--2011carRB3855728335.0974.64345122775.0553
66Rodney Hampton1990--1997nygRB56104841223.9373.65182629693.5958.2
67Ahman Green1998--2009sea-gnb-htxRB89141665454.6273.56375931814.1950.5
68Earnest Jackson1983--1988sdg-phi-pitRB3154422794.1973.54451518883.6742.9
69Lawrence McCutcheon1973--1981ram-den-sea-bufRB75124354624.3972.83842216934.0144.6
70Freeman McNeil1981--1992nyjRB71113251094.51727578233644.344.9
71Rashard Mendenhall2008--2011pitRB3764626434.0971.4172289544.1856.1
72Warrick Dunn1997--2008tam-atlRB98161869964.3271.492116743713.7547.5
73Cedric Benson2005--2011chi-cinRB5092535683.8671.44564724463.7854.4
74Natrone Means1993--1999sdg-jaxRB55100439173.971.23954919483.5549.9
75Gary Brown1991--1999oti-sdg-nygRB4061928414.59713542414763.4842.2
76Michael Turner2004--2011sdg-atlRB76113053914.7770.93837614573.8838.3
77Christian Okoye1987--1992kanRB447803120470.93544717713.9650.6
78Karim Abdul-Jabbar1996--2000mia-cle-cltRB3365123393.5970.93138811883.0638.3
79Garrison Hearst1993--2004crd-cin-sfo-denRB76121053854.4570.95568128404.1751.6
80Joe Morris1982--1991nyg-cleRB63110344604.0470.85044816783.7533.6
81Johnny Johnson1990--1994crd-nyjRB2442816853.9470.24761823933.8750.9
82Thomas Jones2000--2011crd-tam-chi-nyj-kanRB88154161543.9969.999126249503.9250
83Chuck Muncie1976--1984nor-sdgRB5181735544.3569.76585436644.2956.4
84Chuck Foreman1973--1980min-nweRB77132453184.0269.13842614093.3137.1
85Ottis Anderson1979--1992crd-nygRB94163064893.986980103342174.0852.7
86Larry Csonka1968--1979mia-nygRB91138762234.4968.46469125873.7440.4
87Randy McMillan1981--1986cltRB2028213654.8468.36669524843.5737.6
88John Brockington1971--1977gnb-kanRB3663724563.8668.25465123083.5542.7
89Ryan Grant2007--2011gnbRB4567030524.5667.82231312914.1258.7
90Willis McGahee2004--2011buf-rav-denRB66104244154.2466.96185933593.9155.1
91Ron A. Johnson1969--1975cle-nygRB3762924263.8665.64153317293.2442.2
92Joe Cribbs1980--1988buf-sfo-miaRB5583435804.2965.14952319613.7540
93Marcus Allen1982--1997rai-kanRB145222194334.2565.191106841573.8945.7
94Antowain Smith1997--2005buf-nwe-oti-norRB75124848723.9656167425593.842
95Larry Brown1969--1976wasRB69117144413.7964.43546417803.8450.9
96Kevin Jones2004--2008det-chiRB2232614154.3464.34146917613.7543
97Floyd Little1967--1975denRB4573828803.9646782031873.8947.6
98Wendell Tyler1977--1986ram-sfoRB7193145104.8463.54655024434.4453.1
99Ricky Bell1977--1982tam-sdgRB253971588463.53846215913.4441.9
100Abner Haynes1960--1967kan-den-mia-nyjHB4860130465.0763.56043915923.6326.5
101Cadillac Williams2005--2011tam-ramRB3350520944.1563.55056819933.5139.9
102Clem Daniels1960--1968kan-rai-sfoRB5168932364.763.54940116694.1634.1
103Pete Johnson1977--1984cin-sdg-miaRB64102839953.8962.45053818793.4937.6
104Leonard Russell1991--1996nwe-den-ram-sdgRB3154919343.5262.45161520393.3240
105Bam Morris1994--1999pit-rav-chi-kanRB396052423462.13744416363.6844.2
106Rueben Mayes1986--1993nor-seaRB3655522334.02624031412624.0231.6
107Errict Rhett1994--2000tam-rav-cleRB3663522133.4961.54253919303.5846
108Anthony Thomas2001--2007chi-dal-nor-bufRB3962823953.8161.44943115323.5531.3
109James Wilder1981--1990tam-detRB3248119644.0861.486112341603.748.4
110Joseph Addai2006--2011cltRB6294338044.0361.42631012704.148.8
111Marion Butts1989--1995sdg-nwe-otiRB507663067461.35560122623.7641.1
112Matt Snell1964--1972nyjRB4264125734.0161.33543518494.2552.8
113Delvin Williams1974--1980sfo-miaRB5174531154.1861.14758825254.2953.7
114James Brooks1981--1992sdg-cin-cle-tamRB8397650605.18618676731184.0736.3
115Kevin Mack1985--1993cleRB5175331094.13615464524383.7845.1
116Mike Thomas1975--1980was-sdgRB5279631633.9760.82831911483.641
117Neal Anderson1986--1993chiRB6899241304.1660.74960423153.8347.2
118Paul Lowe1960--1969sdg-kanHB6676739985.2160.62822810754.7138.4
119DeShaun Foster2003--2008car-sfoRB4768928334.1160.33332311383.5234.5
120Napoleon Kaufman1995--2000raiRB4651227605.39604646720364.3644.3
121Mike Garrett1966--1973kan-sdgRB6282337124.5159.94147717033.5741.5
122Dave Hampton1969--1976gnb-atl-phiRB3654721443.9259.65558322963.9441.7
123Leroy Kelly1964--1973cleRB92126854654.3159.44953821453.9943.8
124Sam Cunningham1973--1982nweRB5380031333.9259.15261524303.9546.7
125Duce Staley1997--2006phi-pitRB6692338814.258.85262123683.8145.5
126Charlie Garner1994--2004phi-sfo-rai-tamRB6983040354.8658.58278435034.4742.7
127Mike Rozier1985--1991oti-atlRB4565426224.0158.35256020223.6138.9
128Brian Westbrook2002--2010phi-sfoRB8097146604.858.34952922064.1745
129Mark van Eeghen1974--1983rai-nweRB96139355613.9957.94143217143.9741.8
130Julius Jones2004--2010dal-sea-norRB4868427754.0657.84863624723.8951.5
131Marion Barber2005--2011dal-chiRB5978334074.3557.74441415243.6834.6
132James Stewart1995--2002jax-detRB5482831083.7557.65368128954.2554.6
133Eddie Lee Ivery1979--1986gnbRB3540720144.9557.5342448913.6526.2
134Ken Willard1965--1974sfo-crdRB69100339553.9457.35857919633.3933.8
135Mike Pruitt1976--1986cle-buf-kanRB6794438404.0757.37692136053.9147.4
136Marv Hubbard1969--1977rai-detRB6676737734.9257.2242258673.8536.1
137Gerald Riggs1982--1991atl-wasRB6289435443.9657.272111046904.2365.1
138Ronnie Brown2005--2011mia-phiRB4359624484.1156.95058625224.350.4
139Adrian Murrell1993--2003nyj-crd-was-dalRB4463724943.9256.77276528623.7439.8
140Don Perkins1961--1968dalFB-HB5575831074.156.55175430794.0860.4
141Lamar Smith1994--2003sea-nor-mia-carRB5481130433.7556.45856520303.5935
142Mike Anderson2000--2007den-ravRB5871632544.5456.1402509763.924.4
143J.D. Smith1960--1966sfo-dalFB-HB3345118504.156.13641115643.8143.4
144Ted Brown1979--1986minRB5066027994.24565649919073.8234.1
145Dick Bass1960--1969ramFB-HB4759026124.4355.65956725044.4242.4
146Sammy Winder1982--1990denRB80119544433.7255.55242313563.2126.1
147Emerson Boozer1966--1975nyjRB5477429843.8655.35851820924.0436.1
148Ed Podolak1969--1977kanRB4865526304.0254.84742314823.531.5
149Earnest Byner1984--1997cle-was-ravRB111152260643.9854.610275730344.0129.7
150Brandon Jacobs2005--2011nygRB7186238694.4954.53933614414.2936.9
151Roger Craig1983--1993sfo-rai-minRB127165868734.1554.15352921063.9839.7
152Mel Farr1967--1973detRB3137716774.4554.1272929603.2935.6
153Bobby Humphrey1989--1992den-miaRB3342217814.22542234213383.9160.8
154Jim Otis1970--1978nor-kan-crdRB5778230573.9153.65139113353.4126.2
155Chris Warren1990--2000sea-dal-phiRB7087237434.2953.59194840614.2844.6
156Ahmad Bradshaw2007--2011nygRB5256527804.9253.5272469173.7334
157John Stephens1988--1993nwe-gnb-kanRB2841014773.652.85953519633.6733.3
158Gary W. Anderson1985--1993sdg-tam-detRB3642018994.5252.87344915103.3620.7
159Otis Armstrong1973--1980denRB5872130554.2452.73932114084.3936.1
160Mercury Morris1969--1976mia-sdgRB7473738965.2952.6331616824.2420.7
161Kevan Barlow2001--2006sfo-nyjRB3745119464.3152.65058320743.5641.5
162Tom Sullivan1972--1978phi-cleRB2637513593.6252.35148316833.4833
163Reggie Cobb1990--1996tam-gnb-jax-nyjRB2940715143.7252.26267022553.3736.4
164Hewritt Dixon1963--1970den-raiRB-TE5567728614.2352381615533.4314.6
165Altie Taylor1969--1976det-otiRB5471827943.8951.74541714063.3731.2
166Tony Collins1981--1990nwe-miaRB5668228854.2351.55355619623.5337
167Sherman Smith1976--1983sea-sdgRB3540317924.4551.25343117284.0132.6
168Justin Fargas2003--2009raiFB2528712784.4551.16554020913.8732.2
169Edgar Bennett1992--1999gnb-chiRB6489932643.63514737912893.427.4
170Terry Metcalf1973--1981crd-wasRB-WR4649923414.6950.93628212164.3133.8
171Calvin Hill1969--1981dal-was-cleRB96114548844.2750.95439515593.9528.9
172Michael Vick2001--2011atl-phiQB6545932877.1650.65129721657.2942.5
173MacArthur Lane1968--1978crd-gnb-kanRB5260226204.3550.46755118843.4228.1
174Larry Kinnebrew1983--1990cin-bufRB3745818634.0750.44032812873.9232.2
175Gerry Ellis1980--1986gnbRB4647923144.8350.35435014994.2827.8
176Barry Word1987--1993nor-kan-minRB4554122354.1349.7242238593.8535.8
177Johnny Roland1966--1973crd-nygRB4050119683.9349.24742714583.4131
178Herschel Walker1986--1997dal-min-phi-nygRB8496241224.2849.1106102042354.1540
179Curtis Dickey1980--1986clt-cleRB3038314673.8348.95155325454.649.9
180Keith Lincoln1961--1968sdg-bufFB-HB4744022945.2148.83830812554.0733
181Boobie Clark1973--1980cin-otiRB4860123113.8548.1312258373.7227
182Clarence Davis1971--1978raiRB7375935114.6348.1251666253.7725
183Michael Pittman1998--2008crd-tam-denRB6978233154.24488166524993.7630.9
184Tom Woodeshick1963--1972phi-crdRB3134614834.2947.85045619224.2138.4
185Tyrone Wheatley1995--2004nyg-raiRB6781831853.8947.56149218783.8230.8
186Charley Tolar1960--1966otiFB4657621733.7747.24235411833.3428.2
187Frank Pollard1980--1988pitRB5255124484.4447.15044717723.9635.4
188Lorenzo White1988--1995oti-cleRB5461225384.15475952619683.7433.4
189Ron Dayne2000--2007nyg-den-htxRB5469325373.66474232012713.9730.3
190Walter Abercrombie1982--1988pit-phiRB4551621134.09474236914233.8633.9
191Harvey Williams1991--1998kan-raiRB5363224873.9446.95541115283.7227.8
192Don Calhoun1974--1981buf-nweRB5557725324.39463928810443.6326.8
193Greg Hill1994--1999kan-ram-detRB5357924394.2146281967954.0628.4
194Roland Harper1975--1982chiRB3439815543.945.74036415014.1237.5
195Rob Carpenter1977--1986oti-nyg-ramRB7690434493.8245.44835412463.5226
196Dexter Bussey1974--1984detRB5757825714.4545.17662825514.0633.6
197Wray Carlton1960--1967bufHB-FB4347219354.1453833814024.1536.9
198John David Crow1960--1968crd-sfoHB-TE5253923244.3144.74535514254.0131.7
199Mike Alstott1996--2006tamRB89100239483.9444.47946914813.1618.7
200Dalton Hilliard1986--1993norRB6576228643.7644.14438313643.5631
201Joe Washington1977--1985sdg-clt-was-atlRB6467228194.19446254220763.8333.5
202Wilbur Jackson1974--1982sfo-wasRB3637115744.2443.76060823053.7938.4
203Nick Pietrosante1960--1967det-cleFB5052021854.243.73630612414.0634.5
204Mario Bates1994--2000nor-crd-detRB3844016443.7443.35341614393.4627.2
205Les Josephson1964--1974ramRB5855225014.5343.1352006283.1417.9
206Reggie Bush2006--2011nor-miaRB4542919384.5243.13634914384.1239.9
207Rocky Bleier1968--1980pitRB8586136024.1842.4362077403.5720.6
208Chris Brown2003--2009oti-htxRB3230213524.4842.33844217814.0346.9
209James R. Jones1983--1992det-seaFB-TE3742915553.62427557520243.5227
210Charlie H. Smith1968--1975rai-sdgRB6672127513.8241.7221737154.1332.5
211Don Woods1974--1980sdg-sfoRB2933812053.5741.64042518824.4347.1
212Wayne Morris1976--1984crd-sdgRB4749619513.9341.56439914323.5922.4
213LaMont Jordan2001--2009nyj-rai-nwe-denRB5346721804.6741.16046917703.7729.5
214Ernie Green1962--1968cleHB-FB6455626214.7141271346544.8824.2
215Doug Kotar1974--1981nygRB3132412533.8740.45857621273.6936.7
216Dorsey Levens1994--2004gnb-phi-nygRB104102841824.0740.24838014753.8830.7
217Charles White1980--1988cle-ramRB5148720394.19405130310683.5220.9
218Craig Heyward1988--1998nor-chi-atl-ram-cltRB7164728374.38407240715183.7321.1
219Reuben Droughns2001--2008det-den-cle-nygRB5047819934.1739.94745916383.5734.9
220Johnny Hector1983--1992nyjRB5856923064.0539.86348920074.131.9
221Harold Green1990--1998cin-ram-atlRB4744218664.2239.77872025543.5532.7
222Amos Marsh1961--1967dal-detHB-FB3126412224.6339.45241216554.0231.8
223Dave Osborn1965--1976min-gnbRB8288632323.6539.44735213123.7327.9
224Cid Edwards1968--1975crd-sdg-chiRB2923511434.8639.4494181670434.1
225Tom Matte1961--1972cltRB9494237003.9339.44329811473.8526.7
226John L. Williams1986--1995sea-pitFB8173931724.2939.27553119393.6525.9
227Ladell Betts2002--2010was-norRB5248120164.1938.86035613553.8122.6
228Walt Garrison1966--1974dalRB8777733194.2738.1372369754.1326.4
229Michael Bennett2001--2010min-kan-tam-sdg-raiRB4742417884.22386044020084.5633.5
230Wendell Hayes1963--1974dal-den-kanRB625872349437.95840114453.624.9
231Willie Ellison1967--1974ram-kanRB5549020624.2137.52624810164.139.1
232Essex Johnson1968--1976cin-tamRB4839917894.4837.36532914614.4422.5
233Jim Kiick1968--1977mia-denRB8079129723.7637.23431310563.3731.1
234Stump Mitchell1981--1989crdRB5143918904.3137.16451425735.0140.2
235John Fuqua1969--1976nyg-pitRB5752421014.0136.93723910874.5529.4
236Robert Newhouse1972--1983dalRB115103042374.1136.84230411983.9428.5
237Curtis McClinton1962--1968kanFB-TE5851721344.1336.8322429784.0430.6
238Leroy Hoard1990--1999cle-rav-car-minRB7667727964.1336.87039213973.5620
239Merril Hoge1987--1994pit-chiRB5650520274.0136.25435913593.7925.2
240Charlie Harraway1966--1973cle-wasRB6258822403.8136.1342759213.3527.1
241Larry Garron1960--1968nweHB-FB5245718774.1136.1372609193.5324.8
242Correll Buckhalter2001--2010phi-denRB6249022224.5335.8482229594.3220
243Erric Pegram1991--1997atl-pit-sdg-nygRB5856420673.6635.64132714504.4335.4
244Carl Garrett1969--1977nwe-chi-nyj-raiRB5043517524.03356460424784.138.7
245Rickey Young1975--1983sdg-minRB5852820323.85357347216053.422
246Greg Pruitt1973--1984cle-raiRB8861430785.01357157725174.3635.5
247Darrin Nelson1982--1992min-sdgRB7358325454.3734.97648320674.2827.2
248Lenny Moore1960--1967cltRB-WR5846720114.3134.7332479863.9929.9
249Donny Anderson1966--1974gnb-crdRB6859423493.9534.55758922563.8339.6
250Kenneth Davis1986--1994gnb-bufRB7760326564.434.55433313714.1225.4
251Tommy Mason1961--1971min-ram-wasRB6154421023.8634.55542418554.3833.7
252Chester Taylor2002--2011rav-min-chi-crdRB8672629534.0734.37047019324.1127.6
253Tony Nathan1979--1987miaRB8963630474.7934.2452149504.4421.1
254Dominic Rhodes2001--2010clt-raiRB7057823874.1334.14033413063.9132.7
255Timmy Brown1960--1968phi-cltRB5139017244.4233.85346320054.3337.8
256Dick Hoak1961--1970pitRB-WR4341314203.44337963823073.6229.2
257Bill Mathis1960--1969nyjFB-HB6661521643.5232.86041713803.3123
258Earl Gros1962--1970gnb-phi-pit-norFB4434814414.1432.85245516733.6832.2
259Bill Brown1961--1974chi-minRB9689331383.5132.77770924613.4732
260Anthony Johnson1990--2000clt-nyj-chi-car-jaxRB5348217123.5532.37437113893.7418.8
261Jess Phillips1968--1977cin-nor-rai-nweRB6244419804.4631.96145116013.5526.2
262Terry Kirby1993--2002mia-sfo-cle-raiRB6853821564.0131.75130510193.3420
263Ronnie Bull1962--1971chi-phiRB6052018963.6531.64932712483.8225.5
264Norm Bulaich1970--1979clt-phi-miaRB7255222754.1231.64630011953.9826
265John Cappelletti1974--1983ram-sdgRB7767624103.5731.3341836243.4118.4
266Sammy Morris2000--2011buf-mia-nwe-dalRB6544319894.4930.66529410733.6516.5
267Pete Banaszak1966--1978raiRB11386734533.9830.6401856373.4415.9
268Cullen Bryant1973--1987ram-seaRB9571827463.8228.9522449653.9518.6
269Maurice Morris2002--2011sea-detRB7653521694.0528.57637416004.2821.1
270Randall Cunningham1985--2001phi-min-dal-ravQB9848627015.5627.67333424757.4133.9
271Tony Galbreath1976--1987nor-min-nygRB7950421244.2126.99054420213.7222.5
272Matt Suhey1980--1989chiRB8460222573.7526.9592698453.1414.3
273Kordell Stewart1995--2005pit-chi-ravQB7641019924.8626.25420411645.7121.6
274Steve Young1985--1999tam-sfoQB12555032365.8825.96026815975.9626.6
275Steve McNair1995--2007oti-ravQB10047924885.1924.97224514575.9520.2
276Donovan McNabb1999--2011phi-was-minQB10645823915.2222.67422914886.520.1
277Kevin Faulk1999--2011nweRB12565327434.221.95429912894.3123.9
278Preston Pearson1968--1980clt-pit-dalRB11860723803.9220.25837713313.5322.9
279Keith Byars1986--1998phi-mia-nwe-nyjFB-TE11953718933.5315.97931811543.6314.6
280John Elway1983--1998denQB16359822793.81149226615535.8416.9
281Fran Tarkenton1961--1978min-nygQB13139017104.3813.111729219346.6216.5

[continue reading…]

{ 4 comments }

Adrian Peterson’s amazing, except when the Vikings win

Adrian Peterson is having an incredible season. He’s likely to hit the 2,000-yard mark on Sunday, and he’s also chasing Eric Dickerson’s single-season rushing record. But his splits this year are…interesting.

The table below shows Adrian Peterson’s game logs. These display his traditional statistics, along with his Win Probability added, Expected Points Added, and Success Rate, all courtesy of Advanced NFL Stats; finally I have added the Vikings SRS score for that particularly game (on the season, Minnesota has an SRS of +3.0).

G#OppW/LScoreRshYdsYPCTDRecYdsWPAEPASR(%)SRS
1JAXW26-2317844.9230.172.550-12.2
2INDL20-2316603.8020-0.02-2.240-5.7
3SFOW24-1325863.4021-0.1-2.433.318.3
4DETW20-13211024.90200.051.8407.5
5TENW30-717885.2015-0.12-1.533.39.3
6WASL26-3817794.6050-0.061.642.3-5.9
7ARIW21-14231536.7160.120.433.30.8
8TAML17-36151238.214-0.070.743.8-22.9
9SEAL20-301718210.72110.379.552.45.7
10DETW34-24271716.3150.04-0.7254.5
11CHIL10-28181086030-0.030.860-7.8
12GNBL14-2321210101100.4210.443.51.5
13CHIW21-143115452160.242.345.511.2
14STLW36-22242128.8100.216.945.816.8
15HOUW23-625863.404-0.1-525.924.5
Total31418986112151.1225.140.23

A robot and a vegan walk into a bar...

A robot and a vegan walk into a bar...

Peterson has only had two games this season where he averaged fewer than 3.5 yards per carry. Those two games were, without question, the two most impressive wins of the year for the Vikings. Peterson had identical stat lines of 25 carries/86 yards/0 touchdowns in shocking upsets over the 49ers and Texans.
[continue reading…]

{ 2 comments }

Week 16 Power Rankings

What’s the point of power rankings now that there is just one week left in the regular season? If you’ve asked that question, you are implicitly saying that power rankings serve a purpose earlier in the year! If you want to see the playoff picture, I laid that out earlier this week, so I’ll assume you’ll be staying on this post for the snark.

I was on the Seahawks’ bandwagon a couple of weeks earlier than most, but they’re now #1 in Football Outsiders’ DVOA ratings and third in Advanced NFL Stats’ Efficiency Rankings. Seattle is also first in Pro-Football-Reference.com’s SRS Ratings; the Seahawks are second in the NFL in points differential, behind the Patriots, but a much tougher schedule was enough to close the gap there. Now that Richard Sherman is cleared to play in the postseason, Seattle is a legitimate Super Bowl contender. They may not have home field advantage in the playoffs, but they do have my Coach of the Year.

Here’s the week 17 schedule along with my projected winner:

Road TeamHome TeamTimeProj Winner
Tampa Bay Buccaneers@Atlanta Falcons1:00 PMAtlanta Falcons
New York Jets@Buffalo Bills1:00 PMBuffalo Bills
Baltimore Ravens@Cincinnati Bengals1:00 PMCincinnati Bengals
Houston Texans@Indianapolis Colts1:00 PMHouston Texans
Chicago Bears@Detroit Lions1:00 PMChicago Bears
Green Bay Packers@Minnesota Vikings1:00 PMGreen Bay Packers
Carolina Panthers@New Orleans Saints1:00 PMCarolina Panthers
Philadelphia Eagles@New York Giants1:00 PMNew York Giants
Jacksonville Jaguars@Tennessee Titans1:00 PMTennessee Titans
Cleveland Browns@Pittsburgh Steelers1:00 PMPittsburgh Steelers
Miami Dolphins@New England Patriots4:25 PMNew England Patriots
Kansas City Chiefs@Denver Broncos4:25 PMDenver Broncos
Oakland Raiders@San Diego Chargers4:25 PMSan Diego Chargers
St. Louis Rams@Seattle Seahawks4:25 PMSeattle Seahawks
Arizona Cardinals@San Francisco 49ers4:25 PMSan Francisco 49ers
Dallas Cowboys@Washington Redskins8:20 PMWashington Redskins

That leaves us with the final week 17 standings:

TeamRecWinsPrvWinDiffRemSOSRemHGComment
Atlanta Falcons13-2141300.5001Mike Smith says the Falcons will play to win this game. I believe him.
Houston Texans12-3131410.6250The best season in Texans history will be secure with a win in Indianapolis in week 17.
Denver Broncos12-3131300.1251The best team in the AFC? With a win at home against Kansas City, the Broncos will finish the year on an 11-game win streak.
New England Patriots11-41212-10.4381A home win against the Dolphins will mark just the second time Bill Belichick's Patriots have gone undefeated in the division.
Green Bay Packers11-4121210.5000Winning in Minnesota is going to be difficult, but the Packers need a win to secure a much-needed bye.
San Francisco 49ers10-4-111.511.510.3131The 49ers can salvage a strong season by winning at home against Arizona; a loss and the team is in a full-fledged free fall.
Seattle Seahawks10-5111100.4061A Super Bowl championship? The coach of the year? The rookie of the year? Seattle might end up with all three in a couple of months.
Chicago Bears9-6101000.2500The Bears rooting for the Packers is one of the weirder twists of week 17.
Indianapolis Colts10-5101000.8751A magnificent season in Indianapolis is capped by the return of Chuck Pagano this weekend.
Baltimore Ravens10-5109-10.5630The Ravens plugged the leak against the Giants, but week 17 against the Bengals will be more like a pre-season game.
Washington Redskins9-610900.6251The Redskins entered the year with the least hype in the NFC East; they may end the year with the division crown.
Cincinnati Bengals9-610910.5631In a meaningless game, I'll take the home team. A.J. Green and Geno Atkins will give the Patriots trouble in round 1.
New York Giants8-791000.2501The only team the last three years to start 6-2 and miss the playoffs? The 2010 Giants. The 2012 Giants may soon join them.
Minnesota Vikings9-69810.7501I doubt they can do it, but if they beat the Packers and Texans in back-to-back weeks, they will have earned their playoff berth.
Dallas Cowboys8-781010.5630Tony Romo is closing in on 5,000 yards, Jason Witten set the single-season record for catches by a tight end, DeMarcus Ware and Anthony Spencer have double digit sacks, and the Cowboys still need to win in Washington to make the playoffs.
Pittsburgh Steelers7-88900.3131It's 2006 and 2009 all over again for the Steelers. Another playoff absence that leaves more questions than answers for Pittsburgh.
St. Louis Rams7-7-17.56.5-10.6880Sam Bradford and the passing game haven't improved significantly, but the defense is above-average. Add some weapons and this team can compete in 2013.
Miami Dolphins7-87700.7500Cameron Wake is having the best season by a player you don't hear about.
Carolina Panthers6-97710.3750Cam Newton ranks 1st in yards per completion, 2nd in Y/A, 6th in NY/A, and 10th in NY/A this year. He's also added over 700 rushing yards.
San Diego Chargers6-976-10.2501In sixteen seasons as head coach, Norv Turner has made the playoffs just four times.
New Orleans Saints7-87600.4381The Saints have allowed the most yards of any team through 15 games in NFL history; they're only 282 yards allowed from the record.
Tampa Bay Buccaneers6-96810.8130Can the Bucs end the season first in rushing yards allowed and last in passing yards allowed?
New York Jets6-967-10.3750Just. End. The. Season.
Buffalo Bills5-106600.4381C.J. Spiller is closing in on the highest YPC average of any player with 1200 yards in league history.
Tennessee Titans5-106610.1251Chris Johnson joined Eddie George and Earl Campbell as just the 7th running back with 6800 rushing yards in his first five seasons.
Cleveland Browns5-1055-10.5630It's been a typical rookie season for Brandon Weeden, which just looks bad in 2012. A difficult decision faces Cleveland management in the offseason.
Arizona Cardinals5-105510.7190From Kevin Kolb to John Skelton to Ryan Lindley to Brian Hoyer. In case you didn't figure it out, it's been a rough year in the desert.
Detroit Lions4-1144-10.6251Calvin Johnson goes for 2,000 yards and Matt Stafford goes for 700 pass attempts as the Lions try to knock the Bears out of the playoffs.
Philadelphia Eagles4-1144-10.6250The Andy Reid era is going to go out with a whimper, with the Eagles losing 11 of their final 12 games.
Oakland Raiders4-114400.3750Terrelle Pryor or Matt Leinart? This is what the Raiders-Chargers rivalry has come to.
Jacksonville Jaguars2-1322-10.3750It's been a rough season in Jacksonville, but the Jaguars did put a scare into the Patriots on Sunday.
Kansas City Chiefs2-1322-10.8130The Chiefs are one loss away from securing the #1 pick. I think Peyton Manning will make sure of that.
{ 2 comments }

Seattle’s HFA

As usual, Aaron Schatz provided some interesting information in his weekly DVOA recap. He was looking into Seattle’s home/road splits, and found that the data support what you already know:

[W]hen you look closer at home-field advantage over a period of several years, almost every team generally has the same home-field advantage, which in DVOA works out to about 8.5% on offense and 8.5% on defense. Teams will see their home-field advantage bounce up and down if you only look at things in eight-game periods that coincide with specific seasons, but if you put together six or seven years of data you are going to end up close to 8.5% difference most of the time. The biggest exception seems to be the four NFC West teams, which over the last decade have enjoyed the four largest home-field advantages in the league. And of those four teams, the biggest exception by far is Seattle.

I don’t doubt that Seattle is a much better team at home than on the road. But here’s the question on my mind today: is Seattle much better at home because, well, they’re much better at home…. or because they simply get more favorable home games than the average team? That might sound like the same thing, but Jason Lisk has done a bunch of research on home field advantage as it relates to climate and distance between the teams.

The table below shows the distance each team has traveled this season. The “road” column represents how many miles the team has traveled when they were the road team while the “home” column shows how many miles their opponents had to travel. Note that I excluded the Patriots/Rams game in London, but instead pro-rated their half-seasons to eight games.

Teamroadhome
San Francisco 49ers2202423317
Oakland Raiders2317722505
Seattle Seahawks2305921130
San Diego Chargers2075520135
Arizona Cardinals1905819569
Miami Dolphins1798118038
New England Patriots1231117764
New York Jets1084617280
Carolina Panthers906714109
Denver Broncos1493313480
St. Louis Rams1298013248
Dallas Cowboys1482613057
Houston Texans1316812705
New Orleans Saints1153912592
average1255812562
Atlanta Falcons876312016
Minnesota Vikings886511633
Tampa Bay Buccaneers1376611493
Buffalo Bills1284511336
Kansas City Chiefs1198710982
Green Bay Packers801310776
Baltimore Ravens891610642
Cincinnati Bengals780110270
Jacksonville Jaguars126079948
Detroit Lions106158659
New York Giants98988416
Chicago Bears99067167
Tennessee Titans94817141
Indianapolis Colts66087090
Pittsburgh Steelers96426792
Cleveland Browns91986784
Washington Redskins72306022
Philadelphia Eagles99925878

Seattle is the most isolated team in the NFL. Now if an expansion team was place in Vancouver or Portland, my guess is that such a team would fare no worse against Seattle than the Giants do against the Eagles or the Jets against the Patriots. But right now, no one is all that close to the Seahawks:

NFL Map

There are also climate issues at play here. Think of the coldest NFL cities — Green Bay, Chicago, Pittsburgh, Cleveland, Buffalo, New England, Denver, Kansas City. They all play in divisions with other cold-weather teams. Meanwhile, the Seahawks are playing teams from California, Arizona, or Missouri in their division. The climates are significantly different. Climate effects are very real but also very complicated, so that’s best left for another day.
[continue reading…]

{ 13 comments }

Who should win Coach of the Year in the NFL?

Let’s get this out of the way. Bruce Arians, or an Arians/Pagano ballot, is going to win Coach of the Year. Period. But who should win it?

Coach of the Year is one of the most difficult awards to predict each year. The award often goes to the coach who most outperforms expectations rather than the coach who does the best coaching job, which is how you end up in situations where Dick Jauron and Jim Haslett were named the best coaches in 2001 and 2000, respectively.

There are no standards or guidelines to help voters determine the Coach of the Year, so every voter is left to his own devices. Today, I’m going to run down my rankings of the top 8 coaches of 2012.

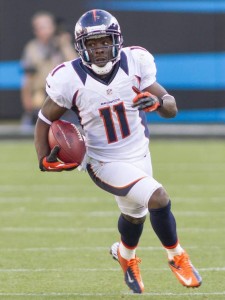
8. John Fox, Denver Broncos

Having Peyton Manning makes coaching easy, but Fox still deserves credit for guiding the Broncos to an excellent season. Denver is going to finish the year on an 11-game winning streak and the Broncos are in the top five in points allowed, yards allowed, net yards per attempt allowed, rushing yards allowed, rushing touchdowns allowed, and rushing yards per carry allowed. Fox has helped turn Von Miller into one of the best two defensive players in the NFL and his hiring of Jack Del Rio to coach the defense has worked beautifully. And while Manning is having a phenomenal year, let’s not forget that it was only three months ago that people were questioning his arm strength and the Broncos were 2-3. Many coaches are doing wonderfully with less, but Fox deserves credit for helping lead Denver to the 2 seed in the AFC.

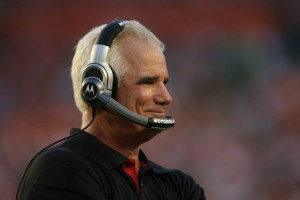
7. Gary Kubiak, Houston Texans

Gary Kubiak

Gary Kubiak wishes COTY voting took place after the end of November.

It was only three weeks ago that the Texans were 11-1 and the class of the NFL. I wrote earlier this season that Kubiak’s done an excellent job resurrecting his coaching career, and much of that remains true. He’s built this team for half a decade, and he oversaw the additions of
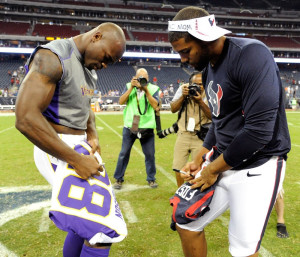
 J.J. Watt and Wade Phillips to the defense to complement Kubiak’s formidable offense. The Texans are likely going to earn the top seed in the A.F.C., an impressive accomplishment considering Matt Schaub isn’t on the same tier of a Peyton Manning or Tom Brady. Even with a little luster off the team right now, Texans fans could hardly ask for more than home field advantage throughout the playoffs.

So why isn’t Kubiak ranked higher? I’m not sure the Texans are as good as their record and they’ve had a relatively easy schedule. Kubiak’s done an excellent job, but he also hasn’t had to face as much adversity as some other coaches this year. Houston is now one of the most talent-laden rosters in the league, and that makes Kubiak’s success just slightly less impressive.

6. Mike McCarthy, Green Bay Packers

The Packers are 11-4 — they’d have the same record as the Texans if not for the Golden Taint play — despite facing a more difficult schedule than Houston. As is seemingly an annual tradition, the Packers have placed a large number of starters on injured reserve, including right tackle Bryan Bulaga, linebackers Nick Perry, D.J. Smith, and Desmond Bishop, and Cedric Benson (along with two other running backs). Charles Woodson has only played in 7 games, James Starks and Alex Green have been banged up most of the year, and injuries have limited Greg Jennings to just 246 receiving yards this year.

Alex Green is the leading rusher with 464 yards, and he’s plodded to the tune of 3.4 yards per carry, narrowly trailing what Benson (3.5) and Starks (3.6) have produced. An anemic running game, a banged up offensive line, and injuries at receiver and tight end have resulted in Aaron Rodgers having a down season and having taken 46 sacks. Clay Matthews has missed four games and he still has 8.5 more sacks than anyone else on defense.

Yet after all that, the Packers are in line for the #2 seed in the NFC. McCarthy’s team is ranked 7th in both points and points allowed, and Green Bay has responded well in the face of adversity this season. After the painful loss to the Seahawks, would other coaches have been able to keep this team focused? After an emotional loss to the Chuckstrong Colts, you didn’t hear about grumbling in the locker room: instead, Green Bay won five straight games. Since a 38-10 shellacking against the Giants, where they looked lost, the Packers have won four in a row. If McCarthy isn’t a household name, that’s just because he’s the most underrated coach in the NFL. Despite facing numerous setbacks this season, he’s got the Packers right where everyone expected they would be.

[continue reading…]

{ 24 comments }

NYT Fifth Down: Post-week 16

This week at the New York Times I looked at some record-breaking performances from week 16.

Sunday was a record-setting day in the N.F.L. In case you missed it …

  • The rookie Minnesota Vikings kicker Blair Walsh connected on a 56-yard field goal in the second quarter against the Texans, making him the first kicker with nine field goals of 50 yards or longer in a season. Even more impressive: Walsh is 9 of 9 from 50-plus yards this year.
  • Kansas City rushed for 352 yards against the Colts, easily breaking the record for rushing yards gained in a losing effort and also for rushing yards differential in a loss. How do you lose when you rush for so many yards? Brady Quinn threw an interception that was returned for a touchdown and threw another pick in the Colts’ end zone. Another Chiefs drive ended on a fumble inside the Colts’ 20-yard-line. But the turning point of the game may have been when Quinn was stuffed on a fourth-and-1, one of the few times in the game that the Colts’ run defense won the battle at the line of scrimmage.
  • In the same game, Jamaal Charles recorded the 750th carry of his career, giving him enough rushing attempts to be eligible for the career yards-per-carry title. Jim Brown averaged 5.22 yards per carry during his Browns career. That’s now second highest among running backs in N.F.L. history. Charles has a mind-boggling 5.82 average gain over his five-year career.
  • Brown might take a back seat to another running back this season. Buffalo’s C.J. Spiller has averaged 6.48 yards per carry this year on 183 carries, the highest single-season average of any player with that many carries. The previous record holder was Brown, who averaged 6.40 yards per rush in 1963.
  • It’s been another remarkable season for Atlanta’s Tony Gonzalez, but he actually was nudged out of the record books this weekend. In 2004, Gonzalez set the single-season record for receptions by a tight end with 102, but Dallas’s Jason Witten caught his 103rd pass of the season in overtime against the Saints on Sunday.
  • The Seattle Seahawks have outscored their last three opponents, 150-30. That 120-point margin of victory is the largest differential in a three-game span in 70 years. In 1942, the Chicago Bears won three straight games and did it with a combined 127-7 score; the year before, Chicago outscored its opponents, 136-14, over a three-game stretch.

Mega Record for Megatron

Of course, the most noteworthy individual record to fall this past weekend was Jerry Rice’s single-season receiving record of 1,848 yards. Calvin Johnson needed only 15 games to break the record Saturday night, and with 1,892 yards, he has a good chance of becoming the first N.F.L. receiver to hit the 2,000-yard mark.

With 225 yards against the Falcons, he also became the first player to gain 100 receiving yards in eight straight games and to collect 10 receptions in four straight games. For Johnson, it was his fifth career game (including the postseason) with at least 200 receiving yards, tying him with Lance Alworth and Rice for the most 200-yard games since 1960.

Detroit has averaged 47 pass attempts per game, and will set the single-season record for attempts on its 12th pass attempt Sunday. Most of those passes have come from the right arm of Matthew Stafford, who threw 663 passes in 2011, (now) the fourth-highest number ever. On his seventh pass in Week 17 against the Bears, he’ll set the record, and he needs just 15 passes to become the first quarterback with 700 pass attempts in a season.

You can check out the full post here.

{ 1 comment }

Merry Christmas

The North Pole is that way, dude

The North Pole is that way, dude.

Merry Christmas from Football Perspective! Most people know that Jay Cutler is from Santa Claus, Indiana, but did you know that that Arizona offensive lineman Daryn Colledge is from the North Pole? Well, at least from the one in Alaska.

Former Oregon State lineman Johan Asiata had a cup of coffee with the Bears two years ago, and he’s one of two players in NFL history from Christchurch, New Zealand (Riki Ellison is the other). Wes Ours was from Christian, Kentucky and Wayne McClure was from Merryvile, Tennesssee, while Kyle Rudolph is one of seven players with that last name in league history.

On a more relevant note, today is the 41st anniversary of one of the best games in NFL history. On December 25th, 1971, the Miami Dolphins defeated the defending Kansas City Chiefs in double overtime. The win prevented Len Dawson from going for his 2nd Super Bowl title in three years and helped Don Shula reach the first of three consecutive Super Bowls.

Hopefully you are celebrating the day with your loved ones today. Thanks for being a part of Football Perspective. I’ll close with this list, courtesy of PFR: There are also 63 players in NFL history born our Christmas day, including a Hall of Famer and one of the best quarterbacks not currently in Canton.

Happy Holidays!

Passing Rushing Receiving
Rk Pos Born From To AP1 PB St AV G Cmp Att Yds TD Lng Int Sk Yds Att Yds TD Lng Rec Yds TD Lng
1 Ken Stabler QB 1945 1970 1984 1 4 11 94 184 2270 3793 27938 194 88 222 281 2514 118 93 4 18
2 Larry Csonka RB 1946 1968 1979 2 5 11 73 146 1891 8081 64 54 106 820 4 65
3 William Andrews RB 1955 1979 1986 0 4 5 68 87 0 1 0 0 0 0 1 2 1315 5986 30 33 277 2647 11 86
4 Hanford Dixon DB 1958 1981 1989 2 3 9 68 131
5 Roland Lakes DT-DE-T-DT 1939 1961 1971 0 0 10 58 154
6 Dave Parks SE-TE-WR 1941 1964 1973 1 3 9 51 118 0 1 0 0 0 0 0 0 4 -10 0 10 360 5619 44 83
7 Norm Bulaich RB 1946 1970 1979 0 1 5 50 120 814 3362 30 67 224 1766 11 80
8 Marcus Trufant DB 1980 2003 2012 0 1 8 50 135
9 Chris Naeole G 1974 1997 2007 0 0 9 48 154
10 Dick Barwegan G 1921 1947 1954 4 4 7 37 92
11 Howard Twilley WR-FL 1943 1966 1976 0 0 5 36 120 212 3064 23 44
12 Corey Widmer LB-DT 1968 1992 1999 0 0 4 33 114
13 Shawn Andrews G-T 1982 2004 2010 1 2 3 28 63
14 Harry Jagielski DT-T 1931 1956 1961 0 0 2 27 36
15 Chris Fletcher DB 1948 1970 1976 0 0 4 26 76
16 Pete Jaquess DB 1940 1964 1970 0 1 3 26 85
17 Roy Hord G 1934 1960 1963 0 0 3 24 53
18 Jeff Rohrer LB 1958 1982 1987 0 0 3 22 83
19 Bob Scholtz C-G-T 1937 1960 1966 0 0 3 21 81
20 Rod Sherman WR-FL 1944 1967 1973 0 0 4 18 83 4 20 1 13 105 1576 5 55
21 Torrin Tucker T-G 1979 2003 2005 0 0 2 11 36
22 Tom Drougas T-G 1949 1972 1976 0 0 1 10 65
23 Craig Veasey DT 1966 1990 1995 0 0 0 8 69
24 Demaryius Thomas WR 1987 2010 2012 0 0 1 6 35 0 1 0 0 0 0 0 0 3 6 0 5 132 2044 14 71
25 Marlon Forbes DB 1971 1996 1999 0 0 0 5 63
26 Reggie Rembert WR 1966 1991 1993 0 0 0 5 28 36 437 1 27
27 Gordon Bell RB 1953 1976 1978 0 0 0 4 30 90 319 2 26 32 259 0 20
28 Kerlin Blaise G 1974 1999 2003 0 0 0 4 38
29 Robbie Jones LB 1959 1984 1987 0 0 0 4 60
30 Hank Rivera DB 1938 1962 1963 0 0 0 3 12
31 Stuart Anderson LB 1959 1982 1985 0 0 0 2 40
32 Bill Briggs DE 1943 1966 1967 0 0 0 2 23
33 Trevor Insley WR 1977 2001 2001 0 0 0 2 11 14 165 1 26
34 Greg L. Robinson T 1962 1986 1987 0 0 0 2 6
35 Josh Baker TE 1986 2011 2011 0 0 0 1 11 3 27 1 17
36 Patrick Brown T 1986 2011 2012 0 0 0 1 16
37 Scott Curry T 1975 1999 1999 0 0 0 1 5
38 Buck McPhail FB-K 1929 1953 1953 0 0 0 1 12 53 138 0 30 10 38 0 45
39 Limas Sweed WR 1984 2008 2009 0 0 0 1 20 7 69 0 17
40 Thomas Williams LB 1984 2008 2011 0 0 0 1 15
41 Nate Abrams E 1897 1921 1921 0 0 2 0 1
42 Ermal Allen QB-DB 1918 1947 1947 0 0 0 0 12 4 13 88 0 0 0 7 11 0 0
43 Napoleon Barrel C 1885 1923 1923 0 0 2 0 7
44 Norm Barry BB-HB 1897 1921 1922 0 0 3 0 12
45 John Barsha FB 1898 1920 1920 0 0 0 0 3
46 Milt Crain FB 1921 1944 1944 0 0 0 0 10 26 78 0 8 1 16 0 16
47 Lon Evans G-T 1911 1933 1937 2 0 4 0 57
48 Harry Flaherty LB 1961 1987 1987 0 0 0 0 2
49 Dick Hanson T 1949 1971 1971 0 0 0 0 3
50 Mike Hudson DB 1963 1987 1987 0 0 0 0 3
51 Julie Koshlap B 1917 1945 1945 0 0 0 0 1
52 Mel Maceau C 1921 1946 1948 0 0 0 0 37
53 Joe Majors DB 1936 1960 1960 0 0 0 0 1
54 Joe Mickles RB 1965 1989 1990 0 0 0 0 10
55 Gery Palmer T 1950 1975 1975 0 0 0 0 2
56 Leon Pennington LB 1963 1987 1987 0 0 0 0 3
57 Hosea Rodgers FB 1921 1949 1949 0 0 1 0 12 0 1 0 0 0 0 131 494 5 0 7 97 0 0
58 Jim Sanford T 1898 1924 1924 0 0 0 0 1
59 Don Silvestri K 1968 1995 1996 0 0 0 0 28
60 Marty Slovak TB-DB 1916 1939 1941 0 0 0 0 27 57 109 638 4 48 18 141 396 1 14
61 John Starnes P 1962 1987 1987 0 0 0 0 1
62 Frank Walton G 1911 1934 1945 0 0 1 0 25
63 Bill Wexler C 1904 1930 1930 0 0 0 0 1
{ 1 comment }
Next Posts Previous Posts