≡ Menu

Wazzup????

Wazzup????

Some quarterbacks and wide receivers just go together. Peyton Manning and Marvin Harrison. Dan Marino and Mark Clayton and Mark Duper. Joe Namath and Don Maynard. John Hadl and Lance Alworth. But quarterbacks play with lots of receivers, and receivers generally play with several quarterbacks. We don’t remember most combinations, but that doesn’t mean they were all unproductive. So I thought it might be interesting to look at every wide receiver since 1950, find his best single season in receiving yards, and record who was his team’s primary quarterback that season.

Jerry Rice’s best year came with Steve Young, not Joe Montana. Randy Moss set the touchdown record with Tom Brady, but his best year in receiving yards was with Daunte Culpepper. Lynn Swann’s best year was with Terry Bradshaw, but John Stallworth’s top season in receiving yards came with Mark Malone. James Lofton’s best season was with Lynn Dickey, Isaac Bruce’s best year was with Chris Miller, Torry Holt’s top season came with Marc Bulger, and Tim Brown’s top year was with Jeff George.

This is little more than random trivia, but this site does not have aspirations for March content higher than random trivia. In unsurprising news, 25 different players had their best season in receiving yards (minimum 300 receiving yards) while playing with Brett Favre. That includes a host of Packers, but also a couple of Jets and Vikings, too (including one future Hall of Famer).

After Favre, Marino is next with 22 players, and he’s followed by Manning and Fran Tarkenton (20). From that group, I suspect that Tarkenton might surprise some folks. That is, unless they realized that he was the career leader in passing yards when he retired and played for five years with the Giants and thirteen with Minnesota.

The table below shows every quarterback who was responsible for the peak receiving yards season of at least five different receivers (subject to the 300 yard minimum threshold). For each quarterback, I’ve also listed all of his receivers. [continue reading…]

{ 10 comments }

Contest Results: Tom Brady’s 2013 Season

Most Brady projections overshot their target

Most Brady projections overshot their target.

In the summer, I ran a contest to predict the final stats that Tom Brady would produce in 2013. Suffice it to say, nearly everyone was much more bullish on Brady than they should have been: of the 21 contest entries, 19 of them projected Brady to finish with a better ANY/A average than what he actually produced.

The average entry predicted 603 pass attempts, 4,467 yards, 30.8 TDs, 10.4 INTs, 28 sacks, and 139 sack yards lost, for an average ANY/A of 7.09.  In reality, Brady ended the year with 628 attempts, 4,343 yards, 25 TDs, 11 INTs, 40 sacks, and 256 sack yards lost. Basically, the group over-projected his Yards per Attempt by half a yard, expected six more touchdowns, and 12 fewer sacks. Brady’s ANY/A was 6.13, nearly one full adjusted net yard below the average projection.

The winning entry goes to Joe: [continue reading…]

{ 6 comments }

No, Peyton, you're the man

No, Peyton, you're the man.

In 1984, Dan Marino set an NFL record with 48 touchdown passes, but his Dolphins lost in the Super Bowl. Twenty years later, Peyton Manning broke Marino’s record, but he lost to the eventual Super Bowl champion Patriots in the playoffs. In 2007, Tom Brady broke Manning’s touchdowns record, but he lost in the Super Bowl, too.

When the greatest quarterback seasons of all time are discussed, these three years dominate the discussion. And with good reason. But if you include the playoffs — and frankly, there’s no reason not to include the playoffs — which quarterback produced the greatest season of all time? I’m going to stipulate that the greatest quarterback season ever has to end in a Lombardi Trophy, because otherwise, I think we’ll end up back in the world of Marino ’84/Brady ’07/Manning ’04. Of course, now another Manning season has entered the mix: and with a Super Bowl win, Manning’s 2013 should and would be remembered as the greatest quarterback season of all time.

So, the question becomes, which season would he knock off the top rung? I think there are six seasons that stand out from the rest, based on regular and postseason performance.

Honorable Mention [continue reading…]

{ 14 comments }

Championship Game Preview: New England at Denver

These two men look important

These two men look important.

Someone needs to say it. I know, I know, it’s Manning/Brady XV. But someone needs to remind people that Peyton Manning threw 30 more touchdown passes than Tom Brady in 2013. He threw for over 1,000 more yards. He threw one less interception. He was sacked 22 fewer times. And did I mention that he threw 30 more touchdowns? If you’re not into stats, Brian Burke has Manning providing 5.83 extra wins this year, compared to 3.82 for Brady. At some point, the analysis should move beyond “a game between two of the greatest quarterbacks ever” and recognize these things, right?

Let’s cut off the Patriots fans before they can begin typing in Boston accents: the fact that Manning’s 2013 numbers dwarf Brady’s 2013 numbers does not mean Manning’s career >>> Brady’s career. And it doesn’t even mean (although it strongly implies) that Manning was a better quarterback in 2013 than Brady was. There’s no doubt that Denver’s supporting cast, at least on offense, is much better than New England’s. Manning has Brady’s favorite target from last year, Wes Welker, along with Demaryius Thomas, Eric Decker, and Julius Thomas. Brady has dealt with a very inexperienced set of receivers following massive turnover. The Patriots have had to replace Welker, Rob Gronkowski, Aaron Hernandez, and Danny Woodhead with Julian Edelman, 12 games worth of Danny Amendola, 8 games of Shane Vereen (although he’ll be around on Sunday), 7 games of Gronkowski (he won’t be around on Sunday), and Aaron Dobson and Kenbrell Thompkins. Each quarterback is down a star tackle (Ryan Clady, Sebastian Vollmer) but has an All-Pro caliber guard (Louis Vasquez, Logan Mankins).

But whatever the reason for the discrepancy, one conclusion is inescapable: this is not a meeting of equal passing attacks. On one hand, you have one of the greatest passing offenses ever. On the other, you have an above-average passing offense. And that’s the real story. The Broncos averaged 10 more points per game than New England, while Manning (as representative of the Denver passing attack) averaged 2.75 more adjusted net yards per attempt than Brady (as representative of the Patriots passing attack). [continue reading…]

{ 3 comments }

When it comes Patriots/Colts, it’s easy to want to focus on Tom Brady vs. Andrew Luck. Or to marvel at the sheer number of star players these teams have lost in the last 12 months. If you played college in the state of Florida, you’re probably not going to be playing in this game: T.Y. Hilton is the last star standing with Vince Wilfork, Aaron Hernandez, Brandon Spikes, and Reggie Wayne gone. The Patriots also have placed Rob Gronkowski, Sebastian Vollmer, Jerod Mayo, Tommy Kelly and Adrian Wilson on injured reserve, while Devin McCourty and Alfonzo Dennard are both questionable. Also, of course, Brady is probable with a shoulder.

The Colts just put defensive starters Gregory Toler and Fili Moala on injured reserve, adding to a list that already included Wayne, Ahmad Bradshaw, Vick Ballard, Dwayne Allen, Donald Thomas, Montori Hughes, and Pat AngererLaRon Landry and Darrius Heyward-Bey are both questionable, and the latter’s injury caused the team to sign ex-Patriot Deion Branch.

All the injuries and changing parts make this a pretty tough game to analyze. So I’m not going to, at least not from the usual perspective. Instead, I want to take a 30,000 foot view of the game. According to Football Outsiders, the Patriots were the most consistent team in the league this season, while the Colts were the fourth least consistent team. Rivers McCown was kind enough to send me the single-game DVOA grades for both teams this season, and I’ve placed those numbers in the graph below with the Colts in light blue and the Patriots in red. The graph displays each team’s single-game DVOA score for each game this season, depicted from worst (left) to best (right). For Indianapolis, the graph spans the full chart, from the worst game (against St. Louis) to the best (against Denver). As you can see, the portion of the graph occupied by New England is much narrower, stretching from Cincinnati to Pittsburgh. [continue reading…]

{ 7 comments }

How quaint: a quarterback taking snaps form under center

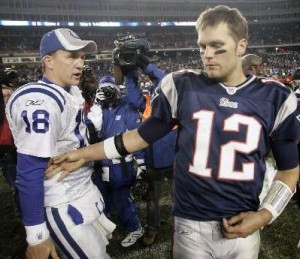
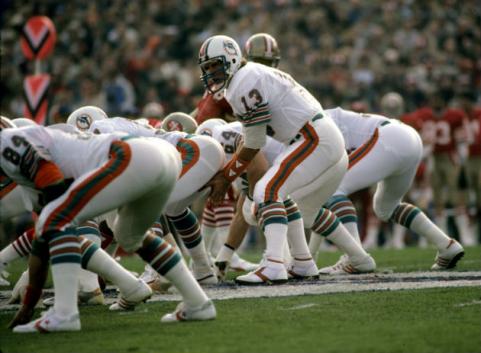
How quaint: a quarterback taking snaps form under center.

With one game remaining, 
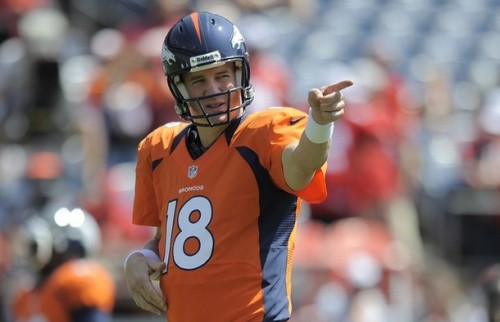
Peyton Manning has already set the new single-season record with 51 passing touchdowns (two months ago, I projected Manning to finish the season with 52 touchdowns). But all records must be viewed in their environment, and NFL teams are averaging 1.58 touchdown passes per team game this year, the highest average since 1948. In 1984, the year 
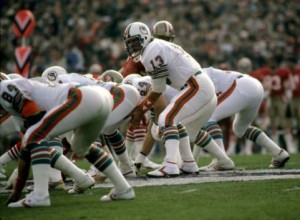
Dan Marino threw 48 touchdowns, teams averaged 1.37 touchdown passes per game.

So which season is more impressive? That’s a complicated question, and one that could be answered in many ways. In my view, the question boils down to which performance was more outstanding; in mathematical terms, we could define that as which season was farthest from the mean.

To make life a little simpler, I’m going to analyze this question on the team level, meaning we will compare “Denver 2013” to “Miami 1984.” Of course, this approach is preferable in many ways, since when we praise Manning we really mean “Manning with his offensive line and his coaching staff throwing to Demaryius Thomas, Wes Welker, Eric Decker, and Julius Thomas.” And “Marino in 1984” means “Marino and Mark Clayton and Mark Duper and Dwight Stephenson and Ed Newman.”

This season, the Broncos have 51 touchdown passes. The other 31 teams (through 15 games) are averaging 22.8 passing touchdowns, which means Denver is 28.2 touchdowns above average. The standard deviation of the 32 teams in passing touchdowns is 7.4; as a result, we can say that the Broncos are 3.84 standard deviations above average, also known as their Z-score.

In 1984, the other 27 teams (through 16 games) averaged 21.0 touchdowns, while the Dolphins threw 49 scores (Jim Jenson, a college quarterback who played receiver for Miami, threw a 35-yard touchdown to Duper against the Patriots off a Marino lateral). The standard deviation that season in touchdown passes at the team level was 7.5, which gives Miami a Z-score of 3.72 in 1984.

So the Broncos this season have been more extraordinary, at least by this measure. One nice thing about using the Z-score is we don’t need to adjust for games played. I went ahead and calculated the Z-scores for every team since 1932. The current Broncos are #1, with the ’84 Dolphins in second place. The third place team isn’t the Tom Brady 2007 Patriots; that team is down at #7, because the standard deviation in passing touchdowns among the league’s 32 teams was 8.8 that season. Instead, the third slot goes to the 1986 Dolphins. Few remember that Marino threw 44 touchdowns that season; add in Don Strock’s two touchdowns, a lower league average and a smaller standard deviation, and those Dolphins get a Z-score of 3.70.

Let’s look at the top 100 teams using this metric. The 2004 Colts ranked fifth (if you click on the cell in the team column, the link takes you to that team’s PFR page) in Z-score. That year, Indianapolis threw 51 touchdowns, while the other 31 teams averaged 21.97 touchdown passes. That means Indianapolis was 29.03 touchdowns above average, the highest production above average to date. But that year, the standard deviation among the 32 teams in passing touchdowns was 8.53, giving the Colts a Z-score of “only” 3.41; that’s why they’re 5th, not first.
[continue reading…]

{ 38 comments }

Every year at Footballguys.com, I publish an article called Rearview QB, which adjusts quarterback (and defense) fantasy numbers for strength of schedule. I’ve also done the same thing using ANY/A instead of fantasy points, and today I revive that concept for the 2012 season.

Let’s start with the basics. Adjusted Net Yards per Attempt is defined as (Passing Yards + 20 * Passing Touchdowns – 45 * Interceptions – Sack Yards Lost) divided by (Pass Attempts plus Sacks). ANY/A is my favorite explanatory passing statistic — it is very good at telling you the amount of value provided (or not provided) by a passer in a given game, season, or career.

Let’s start with some basic information. The league average ANY/A in 2012 was 5.93. Peyton Manning averaged 7.89 ANY/A last year, the highest rate in the league among the 39 passers with at least 75 attempts. Since the Broncos star had 583 pass attempts and 21 sacks in 2012, that means he was producing 1.96 ANY/A over league average on 604 dropbacks. That means Manning is credited with 1,185 Adjusted Net Yards above average, a metric I simply call “VALUE” in the table below. Manning led the league in that category, with Tom Brady, Drew Brees, Aaron Rodgers, and Matt Ryan rounding out the top five. Remember, the ANY/A and VALUE results aren’t supposed to surprise you, so it makes sense that the best quarterbacks finish near the top in this category every year.
[continue reading…]

{ 21 comments }

On September 13, 2008, Doug Drinen wrote this post, which I reproduce in full below.

I’m hearing and reading a lot of crazy stuff this week.

So I just want to document my predictions that (a) the Patriots will win at least 11 games this year, (b) the Patriots will clinch the East before week 17, and (c) Matt Cassel will be a top-12 fantasy quarterback from here out.

That is all.

You think I'm going to lose my top 5 receivers next year? Hahaha. Ok

You think I'm going to lose my top 5 receivers next year? Hahaha. Ok.

With the combination arrest/release of Aaron Hernandez stacked upon five surgeries in seven months for Rob Gronkowski and the departure of Wes Welker to Denver, it’s fair to say that many are wondering about the fate of the New England passing game. In addition to those three, Tom Brady is without Brandon Lloyd (free agent) and Danny Woodhead (San Diego), the fourth and fifth leading receivers on the 2012 Patriots. As Jason Lisk pointed out, that puts Brady in historically bad territory when it comes to roster turnover.

So today’s post doubles as a temperature check and a contest entry. Please predict the following for Tom Brady in 2013, based on the assumption that he is responsible for 99.4% of all Patriots pass attempts by quarterbacks for the second year in a row. To the extent he is not, I will pro-rate his numbers for purposes of judging the contest. To enter, simply copy and paste this table below in the comments and fill out each line.

Your name:
Brady’s number of pass attempts:
Brady’s number of passing yards:
Brady’s number of passing touchdowns:
Brady’s number of interceptions:
Brady’s number of sacks:
Brady’s number of sack yards lost:
Commentary:
[continue reading…]

{ 28 comments }

[In case you missed it, earlier this week, I created an NFL Draft Pick Value Calculator and provided wallet-sized and iPhone-style copies of the 2013 NFL Schedule.]

I find old newspaper articles very entertaining, so I decided to see how the Boston Globe documented the selection of Tom Brady in the sixth round of the 2000 Draft.

On April 17th, the day after the draft concluded, the Globe provided a full summary of each player. Here’s how they described the 199th pick:

6, 199 – Tom Brady, QB, Michigan

A pocket passer who will compete for a practice squad spot with the Patriots . . . Drafted as a catcher by the Montreal Expos in 1995 out of Serra (San Mateo, Calif.) HS . . . Completed 62.8 percent of his passes with 20 TDs and six interceptions. Only Elvis Grbac had more TD tosses in a season for the Wolverines . . . Throws a great slant . . . At almost 6-4, 214 pounds, has some mobility . . . Platooned with sophomore Drew Henson . . . Was projected to go in the third round, but dropped quickly.

[continue reading…]

{ 1 comment }

Those are some clutch shirts

Those are some clutch shirts.

Eight years ago — almost to the day — our old PFR colleague Doug Drinen wrote a Sabernomics post about “The Manning Index”, a metric designed to roughly gauge the clutchness (or chokeitude) of a given quarterback by looking at how he did relative to expectations (he revived this concept in version two, six years ago). In a nutshell, Doug used the location of the game and the win differential of the two teams involved to establish an expected winning percentage for each quarterback in a given matchup. He then added those up across all of a quarterback’s playoff starts, and compared to the number of wins he actually had. Therefore, quarterbacks who frequently exceeded expectations in playoff games could be considered “clutch” while those who often fell short (like the Index’s namesake, Peyton Manning) might just be inveterate chokers.

Doug ran that study in the midst of the 2004-05 playoffs, so it shouldn’t be surprising that Tom Brady (who was at the time 8-0 as a playoff starter and would run it to 10-0 before ever suffering a loss) came out on top, winning 3.5 more games than you’d expect from the particulars of the games he started. Fast-forward eight years, though, and you get this list of quarterbacks who debuted after 1977:
[continue reading…]

{ 31 comments }

13-time Pro Bowler

Will Lewis go out on top?

According to the SRS, this is as lopsided as championship games get. The Patriots are 12.8 points better than average while the Ravens have an SRS of just +2.9; therefore, you’d put New England as 13-point favorites at home (in reality, they are 8-point favorites). I’ve been a Ravens skeptic for a couple of months now, and never thought they were one of the best teams in the league.

In my week 11 power rankings, when Baltimore was 8-2, I wrote: “According to Football Outsiders, Baltimore has the best special teams since 1991 through 10 weeks. Schatz tweeted that Baltimore’s the 16th best team based on just offense and defense.”

A few days later the Ravens defeated the Chargers in the famous 4th-and-29 game, which certainly didn’t change my outlook on Baltimore. Then the Ravens tanked down the stretch, seemingly fulfilling their reputation as an average team. And let’s not forget: had Ben Roethlisberger stayed healthy, it’s possible the Ravens don’t even make the playoffs. Without the 13-10 ugly win over Byron Leftwich and the Steelers, both Baltimore and Pittsburgh would have finished 9-7 with the Steelers holding the tiebreaker. To be fair, the Ravens did not compete in a meaningless week 17 game, but the point is that the Ravens were barely above-average team during the season that got a few breaks along the way.
[continue reading…]

{ 7 comments }

Reviewing the Divisional Round of the Playoffs

The Best Weekend of the Year lived up to its reputation this weekend, as the divisional round of the playoffs gave us three outstanding games. Here is my reaction, with a disproportionate amount of time spent on the Denver-Baltimore game, because, well, if you saw it, you’d understand.

Baltimore 38, Denver 35

One of the best playoff games in NFL history, and an instant classic. This game could be analyzed for hours and there are countless talking points (Fox playing not to lose, Manning’s playoff failures, Ray Lewis’ retirement tour making at least one last stop, Tim Tebow anyone?) that will fill up the schedules of ESPN and talk radio for weeks. But let’s start with a big picture review of the game from the perspective of the team I expected to win the Super Bowl.

If you want to assign credit and blame to Denver, this is how I would rank the five Broncos units on Saturday, from best to worst.

1) Special teams. Sure, Matt Prater missed a long field goal, but Trindon Holliday’s two return touchdowns were a thing of beauty — especially for fans of excellent blocking. Holliday’s runs were more about textbook blocking by the return unit and poor coverage by the Ravens than Holliday himself, but in any event, the Broncos special teams had a great day. In fact, here is how Pro-Football-Reference broke down the game by unit in terms of Expected Points Added:
[continue reading…]

{ 29 comments }

Yesterday, I previewed Saturday’s games with um, mixed results (skip the Denver-Baltimore preview and just read the San Francisco-Green Bay breakdown twice). Let’s take another crack at it by examining Sunday’s matchups.

Seattle Seahawks (11-5) (+1) at Atlanta Falcons (13-3), Sunday, 1:00PM ET

An offense where the star eats Skittle is a young one

Did you know Marshawn Lynch eats Skittles?

Once again, Atlanta is tasked with facing a dominant wildcard team. Is this the year Matt Ryan finally silences his critics?

Atlanta is only a one-point favorite, just the seventh time a home team has been given such little respect this late in the season since 2000. Home teams are 3-3 when underdogs or small favorites over that span in the divisional conference championship rounds, although one of those losses came by the Falcons in 2010 against the Packers when Atlanta was a 1.5-point favorite. But let’s focus on these two teams, because the stats might surprise you.

Russell Wilson edges Matt Ryan in Y/A (7.9 to 7.7), AY/A (8.1 to 7.7), and passer rating (100.0 to 99.1), despite having a significantly worse set of receivers. Ryan does have the edge in NY/A (7.0 to 6.8) but the two are deadlocked in ANY/A at 7.0. Both quarterbacks led four 4th quarter comebacks this year, and Wilson led 5 game-winning drives while Ryan led six. Considering one quarterback has Roddy White, Julio Jones, and Tony Gonzalez, and the other is a 5’10 rookie, I consider this pretty remarkable.
[continue reading…]

{ 5 comments }

Is this a thinly-veiled Brady/Manning post?

Is this a thinly-veiled Brady/Manning post?

Last weekend, I looked at career rushing stats in wins and losses; today I will do the same but for quarterbacks.

I looked at all games, including playoffs, from 1960 to 2011, for all quarterbacks with at least 5,000 career passing yards over that time period. The table below lists the following information for each passer:

– His first year (or 1960, if he played before 1960) and his last year (or 2011, if still active)
– All the franchises he played for (which you can search for in the search box)
– His number of career wins, and his touchdown rate, interception rate, yards per attempt and Adjusted Yards per Attempt (which includes a 20-yard bonus for touchdown passes and a 45-yard penalty for interceptions) in wins [1]Unfortunately, I excluded sack data from this study due to its general unavailability for most of the covered time period.
– His number of career losses, and his touchdown rate, interception rate, yards per attempt and Adjusted Yards per Attempt in losses

The table is sorted by AY/A in wins; unsurprisingly, Aaron Rodgers — who is the career leader in that metric — tops this table, too. In fact, Rodgers is also the leader in AY/A in losses. Note that this table includes all games played by the quarterback, not just his starts.

RkPlayerYearsTeamsPYDWinTD%_WINT%_WY/A_WAY/A_WLossTD%_LINT%_LY/A_LAY/A_L
1Aaron Rodgers2005--2011gnb19147497.6%1.3%8.78.3274.3%2.5%7.46.4
2Matt Schaub2004--2011atl-htx17936485.3%1.7%8.78.1533.5%3.3%7.25.8
3Tony Romo2005--2011dal21666606.6%2.1%8.77.9434.3%3.4%75.5
4Kurt Warner1998--2009ram-nyg-crd36296816.8%2.2%8.77.8573.3%4.4%7.25.3
5Daunte Culpepper1999--2009min-mia-rai-det25133457.1%2.2%8.77.8643.3%4%6.95.1
6Bob Berry1965--1975min-atl9197327.4%2.3%8.67.7364.2%7.4%7.13.8
7Steve Young1985--1999tam-sfo364501256.8%1.7%8.37.6602.9%4.2%7.25.3
8Philip Rivers2004--2011sdg26105696.2%2.3%8.57.6394%3.1%7.36
9Ben Roethlisberger2004--2011pit29729905.7%2.2%8.47.6383.7%4.9%7.25
10John Friesz1990--2000sdg-was-sea-nwe8699195%1%7.87.5382.6%4%5.84
11Bart Starr1960--1971gnb22810996.6%2.9%8.67.5412.4%5.9%6.74.1
12Don Meredith1960--1968dal17750518.5%3.3%8.87.5503.5%6%6.23.6
13Drew Brees2001--2011sdg-nor43722976.5%1.7%87.4663.4%3.7%6.75.1
14Ken O'Brien1984--1993nyj-phi25598565.8%1.7%87.4722.1%3.6%6.34.7
15J.P. Losman2004--2011buf-rai-mia6271175.8%1.5%7.97.4282.5%4.4%6.14.1
16Trent Green1997--2008was-ram-kan-mia28794595.3%2.1%8.27.3633.6%3.8%7.15.5
17Rob Johnson1995--2003jax-buf-tam-was-rai5947204.8%1.5%7.97.3252.8%3.6%6.75.1
18Chad Pennington2000--2010nyj-mia19241465.1%1.2%7.77.3493.2%4.1%6.64.9
19Boomer Esiason1984--1997cin-nyj-crd38520896.6%2.4%8.27.31033.3%4.4%6.54.6
20Neil Lomax1981--1988crd23156486.4%2.1%8.17.3593%3.3%6.65.2
21David Garrard2002--2010jax16489455.3%1.4%7.87.3442.7%3.4%6.44.9
22Matthew Stafford2009--2011det8220138.1%1.8%7.97.2173.4%4.4%6.34.4
23Joe Montana1979--1994sfo-kan463231406.4%2.2%8.17.2602.7%3.4%6.34.9
24Eddie LeBaron1960--1963dal53311112.5%5.5%9.47.2314.7%8.7%7.13.3
25Peyton Manning1998--2010clt602171506.3%1.9%87.2773.9%4.1%6.95.2
26Ed Brown1960--1965chi-pit-clt7723357.7%5.8%9.77.2332.9%8.8%6.52.6
27Wade Wilson1981--1998min-atl-nor-dal-rai18605666.1%2.6%8.37.2632.4%5.3%6.23.9
28Jay Cutler2006--2011den-chi18637426.6%2.2%8.17.2382.7%4.6%6.54.5
29Josh Freeman2009--2011tam8898175.6%1.8%7.97.2242.8%4.6%6.14.1
30Tom Brady2000--2011nwe452641406.1%1.6%7.87.2433.6%4.2%6.34.5
31Matt Moore2007--2011car-mia5137176.2%1.8%7.87.1192.8%5%6.24
32Chris Chandler1988--2004clt-tam-crd-ram-oti-atl-chi29212725.9%2.6%8.27.11053.1%4.4%6.44.4
33Len Dawson1960--1975cle-kan301121058.7%3.6%8.67.1643.2%6.3%6.63.8
34Joe Flacco2008--2011rav15348494.6%1.2%7.67.1243%4.4%5.94
35Trent Edwards2007--2010buf-jax6019144%1.6%7.77.1222%4.3%5.73.8
36Jeff Garcia1999--2009sfo-cle-det-phi-tam26894635.4%1.3%7.57.1683.4%3.1%6.45.1
37Ken Anderson1971--1986cin341591006.2%2.4%87.1922.7%4.7%6.74.7
38Rudy Bukich1960--1968pit-chi7865307.5%3.5%8.57353.5%8.6%62.3
39Troy Aikman1989--2000dal367911054.8%2.1%7.97762.1%4.1%64.2
40Damon Huard1998--2008mia-nwe-kan6349204.9%1.1%7.47242%4.3%5.84
41Jim Everett1986--1997ram-nor-sdg35957665.7%2.6%8.17973.2%4.2%6.54.6
42Roger Staubach1969--1979dal254911066.1%2.5%87443.5%6.3%6.73.9
43Bert Jones1973--1982clt-ram18589476.4%3.1%8.27583.6%4.6%6.34.3
44Frank Reich1985--1998buf-car-nyj-det6858398.8%2.1%7.77393.3%4.3%6.34.4
45Jeff Hostetler1986--1997nyg-rai-was17464705.5%1.9%7.77402.3%4.1%6.34.5
46Dan Fouts1973--1987sdg45165915.9%3.2%8.36.9953.1%5.5%7.14.7
47Bill Kenney1980--1988kan17374375.9%2.5%86.9493.2%4.2%6.54.6
48Y.A. Tittle1960--1964sfo-nyg11542408.9%4.3%8.76.9232.5%6.9%5.72.7
49Mark Brunell1994--2011gnb-jax-was-nor-nyj33905994.8%1.8%7.66.9913.2%2.9%6.24.9
50Aaron Brooks2000--2006nor-rai20822415.8%1.6%7.56.9543.3%4.1%6.44.7
51Patrick Ramsey2002--2008was-nyj-den5929165.2%2.3%7.86.9243.1%3.8%5.84.2
52Scott Mitchell1992--2001mia-det-rav-cin15925406%2.1%7.76.9452.6%4.6%5.93.9
53Randy Wright1984--1988gnb7106125.4%3.4%8.36.9332.2%5.5%5.93.5
54Rich Gannon1987--2004min-was-kan-rai30434915.5%1.5%7.46.9713%3.6%6.24.6
55Earl Morrall1960--1976det-nyg-clt-mia17529927.9%4.8%8.96.9444.2%6.9%6.63.6
56Sonny Jurgensen1960--1974phi-was31546747.7%3.9%8.46.9794.5%4.9%6.84.7
57Steve DeBerg1978--1998sfo-den-tam-kan-mia-atl34752725.4%2.3%7.86.91143.2%4.9%6.44.2
58Steve Beuerlein1988--2003rai-dal-crd-jax-car-den24317645.6%2.3%7.86.8663.4%4.2%6.85
59Fran Tarkenton1961--1978min-nyg488061316.8%2.8%86.81173.6%5.5%6.54.1
60John Brodie1960--1973sfo30783786.7%3.3%8.26.8793.3%6%6.13.5
61Doug Flutie1986--2005chi-nwe-buf-sdg15209485.2%2.4%7.86.8452.9%3.9%64.3
62Johnny Unitas1960--1973clt-sdg323351076.3%3.8%8.46.8592.7%7.3%6.53.2
63Joe Namath1965--1977nyj-ram28299686.4%4%8.56.8713.3%6.8%6.53.5
64Matt Ryan2008--2011atl14832436.1%1.9%7.56.8222.4%3%6.14.8
65Craig Erickson1992--1997tam-clt-mia7625184.8%2.7%7.96.8343.2%3.9%6.54.8
66Marc Bulger2002--2009ram23758424.9%2.6%7.86.8573.1%3.3%6.85.4
67Matt Cassel2005--2011nwe-kan11769425.1%2%7.66.8303.5%3.3%5.74.3
68Tom Flores1960--1969rai-buf-kan11960408.3%3.8%8.36.8442.8%6.7%5.72.8
69Phil Simms1979--1993nyg351411025.3%2.5%7.76.7723%4.3%6.44.6
70Derek Anderson2006--2011cle-crd-car9148215.5%2.4%7.76.7322.7%4.6%5.73.6
71Michael Vick2001--2011atl-phi18889655.8%2.4%7.76.7512.8%3.4%6.34.9
72Brett Favre1991--2010atl-gnb-nyj-min776932016.3%2.2%7.66.71253.2%4.9%6.44.3
73Craig Morton1965--1982dal-nyg-den291431186.7%3.7%8.26.7822.6%6.5%6.23.4
74Steve Pelluer1985--1990dal-kan6870173.3%2.2%7.66.7262.9%4.7%6.94.8
75Dan Marino1983--1999mia658711555.7%2.4%7.76.71054.1%3.9%6.85.1
76Donovan McNabb1999--2011phi-was-min408591065.4%2%7.46.7742.9%2.6%6.15
77Dave Krieg1980--1998sea-kan-det-crd-chi-oti400421136.7%3%7.96.7983%4.4%6.54.5
78Warren Moon1984--2000oti-min-sea-kan521951085.5%2.6%7.76.61103.1%4.2%6.84.9
79Jim Kelly1986--1996buf393301106.1%3.2%86.6673.1%4.6%6.64.6
80John Hadl1962--1977sdg-ram-gnb-oti339411037%3.7%8.26.6923.3%7.8%6.12.7
81Bernie Kosar1985--1996cle-dal-mia25254674.8%1.9%7.46.6663.1%3.4%6.65.1
82Jake Delhomme1999--2011nor-car-cle-htx22822655.5%2.9%7.86.6453.1%4.2%6.64.8
83Vince Evans1977--1995chi-rai9511377.1%3.8%8.26.6572.4%6%6.33.6
84John Elway1983--1998den564391635%2.6%7.76.6922.8%3.9%6.34.6
85Drew Bledsoe1993--2006nwe-buf-dal459461025.1%1.9%7.46.6992.4%4.2%5.94
86Jason Campbell2006--2011was-rai14417323.8%1.7%7.36.6393.3%2.7%6.45.3
87Pete Liske1964--1972nyj-den-phi5170167%2.6%7.66.6232.2%8.2%5.92.3
88Jeff George1990--2001clt-atl-rai-min-was28603485.5%2.7%7.76.6853.2%2.9%6.65.4
89Alex Smith2005--2011sfo13038334.4%1.1%76.6392.9%4.3%64.1
90Jim Zorn1976--1987sea-gnb-tam21249524.9%2.9%7.86.6682.8%5.4%6.13.7
91Lynn Dickey1971--1985oti-gnb23914526.5%4.4%8.46.6763.5%6.6%74.1
92Jon Kitna1997--2011sea-cin-det-dal30104565.7%2%7.46.6862.8%4.7%6.34.3
93Eric Hipple1981--1989det11009306.3%3%7.86.6361.8%5.5%6.44
94Bob Griese1967--1980mia265591087.4%3.9%8.16.5623.5%6.4%6.43.5
95Chris Miller1987--1999atl-ram-den19789375.7%2.4%7.56.5633.6%4.2%6.34.5
96Gus Frerotte1994--2008was-det-den-cin-min-mia-ram21666585.1%2.7%7.66.5602.5%4.1%6.24.4
97Matt Hasselbeck1999--2011gnb-sea-oti35891915.1%2.4%7.56.5803%3.4%6.34.8
98Tarvaris Jackson2006--2011min-sea7239274.5%3.1%7.86.5232.8%3.4%5.84.3
99Jeff Blake1992--2005nyj-cin-nor-rav-crd-phi-chi21711425.1%2.1%7.46.5773.6%3.6%6.34.7
100Tony Eason1983--1990nwe-nyj11703355.1%2.8%7.76.5313.3%3.4%6.75.2
101Jim Harbaugh1987--2000chi-clt-rav-sdg27194784.8%2.1%7.36.5932.3%3.6%6.24.6
102Don Majkowski1987--1996gnb-clt-det12906344.8%2.8%7.76.5432.6%4.2%64.2
103Gary Hogeboom1982--1989dal-clt-crd9598315.1%2.6%7.56.5282.7%6.1%6.74
104Joe Theismann1974--1985was26988956%2.8%7.66.5592.4%5.1%6.34.1
105Randall Cunningham1985--2001phi-min-dal-rav32405986.1%2.6%7.66.5733.1%3.6%6.34.7
106Byron Leftwich2003--2010jax-atl-pit-tam10439305%1.6%7.16.5312.6%3.5%6.24.7
107Tony Banks1996--2005ram-rav-was-htx15315435.2%2.2%7.46.5522%3.7%5.94.3
108Bobby Hebert1985--1996nor-atl22331635.2%3%7.76.5553.5%5%6.24.1
109Greg Landry1968--1984det-clt-chi16100556.7%3.9%8.16.5652.5%4.7%6.34.2
110Eli Manning2004--2011nyg30095775.5%2.2%7.36.4543.7%4.5%6.74.7
111Jay Fiedler1998--2005min-jax-mia-nyj12499505%2.6%7.56.4292.5%5.9%63.4
112Stan Humphries1989--1997was-sdg18538554.4%2.3%7.46.4392.2%5.1%5.93.7
113Jim Plunkett1971--1986nwe-sfo-rai28175855.6%3.4%7.96.4823.2%7.1%6.43.2
114Elvis Grbac1994--2001sfo-kan-rav17492614.8%2.4%7.46.4393.1%4.4%6.24.3
115Richard Todd1976--1985nyj-nor21636515.2%3.6%7.96.4703.2%7%6.23.1
116Steve Grogan1975--1990nwe27457806.7%4.3%8.26.4713.5%7.2%6.83.6
117Frank Ryan1960--1970ram-cle-was15833669.3%4.4%8.26.4424%6.1%6.63.9
118Carson Palmer2004--2011cin-rai25659505.9%2.9%7.66.4593.8%3.5%6.95.3
119Shaun Hill2005--2011min-sfo-det6209185.5%1.8%7.16.4163.2%2.8%6.35.1
120Mark Rypien1988--2001was-cle-ram-phi-clt20249585.7%3.3%7.76.4472.9%3.6%6.54.9
121Bubby Brister1986--2000pit-phi-nyj-den-min14801475.7%2.3%7.36.4511.9%4.3%5.93.9
122Kerry Collins1995--2011car-nor-nyg-rai-oti-clt42478924.4%2.1%7.26.41132.7%4%6.14.3
123Steve McNair1995--2007oti-rav330681004.6%2.1%7.26.4722.6%3.4%6.44.9
124Charlie Batch1998--2011det-pit10610405.2%2.8%7.56.3373.1%3.4%6.65.1
125Bill Nelsen1963--1972pit-cle15004466.5%4.1%86.3433%7.2%6.53.4
126Charley Johnson1961--1975crd-oti-den24410687.3%4.7%8.36.3703%5.9%6.33.6
127Steve Bartkowski1975--1986atl-ram24916605.9%3.1%7.66.3733.5%5.2%6.54.3
128Sam Bradford2010--2011ram567684.1%1.5%6.96.3181.9%2.5%5.64.5
129Gary Danielson1977--1988det-cle14000424.9%2.9%7.56.3433.5%5.3%6.74.4
130Brian Sipe1974--1983cle23896606%3.2%7.66.3623%5.4%6.23.8
131Jay Schroeder1985--1994was-rai-cin-crd20854715.2%2.7%7.46.3502.7%5.3%6.64.3
132Virgil Carter1968--1976chi-cin-sdg5127215.7%3%7.56.3242.1%4.7%5.63.5
133Tommy Kramer1977--1990min-nor25651645.9%2.8%7.46.3662.9%5.7%6.23.7
134Brad Johnson1994--2008min-was-tam-dal304571024.6%2.1%7.16.2702.9%3.9%6.24.5
135Kelly Holcomb1995--2007tam-clt-cle-buf-min645395.5%3.4%7.76.2294%4.5%6.54.6
136Quincy Carter2001--2004dal-nyj6491204.7%2.2%7.16.2181.8%5.3%5.93.5
137Ryan Fitzpatrick2005--2011ram-cin-buf10936226.2%2.4%7.26.2342.9%4.5%5.93.9
138Neil O'Donnell1991--2003pit-nyj-cin-oti23399725%2%76.2582.5%2.3%6.35.4
139James Harris1969--1979buf-ram-sdg8479445.8%4.2%86.2341.8%6.6%63.1
140Brian Griese1998--2008den-mia-tam-chi19440535.2%2.8%7.46.2403.3%4.2%6.64.7
141Terry Bradshaw1970--1983pit318221257%4.3%86.2623%7.3%6.12.9
142Bill Munson1964--1979ram-det-sea-sdg-buf12940416.4%2.6%7.26.2582.8%5%6.13.9
143Steve Tensi1966--1970sdg-den5558158.5%4.4%86.1293.5%5.7%5.83.3
144Jeff Kemp1981--1991ram-sfo-sea-phi6403286.7%2.9%7.36.1261.9%5.5%6.33.8
145Ty Detmer1993--2001gnb-phi-sfo-cle-det6499184.9%2.5%7.16.1242.7%4.6%6.54.4
146Billy Wade1960--1966ram-chi11390346.1%3.5%7.66.1333.8%6.3%6.43.7
147Dave M. Brown1992--2000nyg-crd10304294.1%2.5%7.26.1421.9%4.2%5.84
148Mark Sanchez2009--2011nyj10364305.1%2%6.96.1222.9%5%6.24
149Joe Ferguson1973--1990buf-det-tam-clt30631836.4%3.1%7.46.11073%5.8%6.13.5
150Norm Snead1961--1976was-phi-min-nyg-sfo30797576.9%4.3%7.96.11143.5%6.7%6.73.7
151Dennis Shaw1970--1975buf-crd6347125.9%5.3%8.46.1342.8%8.1%6.52.9
152Vince Ferragamo1977--1986ram-buf-gnb12564357.1%3.7%7.66.1422.9%7.1%6.53.4
153Jake Plummer1997--2006crd-den30593744.7%2.5%7.16.1752.9%4.8%6.44.3
154Tommy Maddox1992--2005den-ram-nyg-pit8754275.9%3.2%7.46.1282.6%5.3%6.13.7
155Daryle Lamonica1963--1974buf-rai210821047.8%4.6%86.1373%7.3%62.8
156Kyle Orton2005--2011chi-den-kan14532364.5%1.9%6.86.1353%3.1%6.45
157Roman Gabriel1962--1977ram-phi29780875.7%2.6%7.16.1793.2%4%5.84.1
158Bob Lee1969--1980min-atl-ram5416605.9%4.8%8.16.1241.2%6.2%52.3
159David Carr2002--2010htx-car-nyg-sfo14433323.4%2.2%76.1612.7%3.4%6.24.7
160Jack Trudeau1986--1995clt-nyj-car10494253.2%2.4%7.16432.3%5.2%5.83.5
161Steve Fuller1979--1986kan-chi7454334%3.5%7.56291.9%4%6.24.5
162Danny White1976--1988dal242431245.8%4%7.76594%5.3%6.74.4
163Archie Manning1971--1984nor-oti-min23911374.4%3.2%7.461103.1%5.1%6.34.1
164Ken Stabler1970--1984rai-oti-nor305791106.6%4.6%7.96643%7.3%6.53.3
165Doug Williams1978--1989tam-was18108495.4%2.8%7.26453.1%4.8%6.54.4
166Joe Pisarcik1977--1984nyg-phi5552254.6%4.1%7.86322.1%5.7%5.73.1
167Jim McMahon1982--1996chi-sdg-phi-min-crd-gnb19260864.5%3.3%7.46402.6%3.8%6.44.8
168Milt Plum1960--1969cle-det-ram-nyg13335466.9%4.9%8.16403.1%6%6.33.7
169Ron Jaworski1974--1989ram-phi-mia-kan29859895.4%2.9%7.26793.4%4.8%6.54.4
170Rodney Peete1989--2004det-dal-phi-was-car16636554.3%3.4%7.56482.2%4.3%6.54.6
171Vinny Testaverde1987--2007tam-cle-rav-nyj-dal-nwe-car475531025.3%3.1%7.361373.3%4.5%6.74.7
172Billy Kilmer1961--1978sfo-nor-was21555886.7%3.7%7.56813.3%5.9%6.13.5
173Tim Couch1999--2003cle11131225.5%3.2%7.36402.7%4.3%64.1
174Erik Kramer1987--1999atl-det-chi-sdg16336384.9%2.4%76483.4%4.1%6.54.7
175Trent Dilfer1994--2007tam-rav-sea-cle-sfo21489685.3%2.7%7.16652%5.1%63.7
176Mike Pagel1982--1993clt-cle-ram9593224.5%2.6%7.16532.9%4.9%63.8
177Kordell Stewart1995--2005pit-chi-rav15490763.5%2.1%6.85.9542.7%5.6%5.53
178Chad Henne2008--2011mia7114143.6%1.7%6.65.9202.4%4.6%6.74.7
179Jim Hart1966--1984crd-was35156935.7%4%7.65.91032.9%5.5%6.23.8
180Vince Young2006--2011oti-phi9102354.5%3%7.15.9272.2%4.9%6.54.3
181Josh McCown2002--2011crd-det-rai-car-chi6998154.2%1.6%6.55.9362.9%5.2%6.23.9
182Mark Malone1981--1989pit-sdg-nyj10733296.3%3%7.15.8442.3%5.9%5.83.2
183Babe Parilli1960--1969rai-nwe-nyj18778647.1%4.1%7.55.8473.2%7.5%5.92.5
184Don Strock1974--1988mia-cle5913377.1%3.6%7.35.8304.5%7.3%6.63.3
185Dick Wood1962--1966sdg-nyj-rai-mia7153177.1%3.4%7.25.8282.6%7.3%5.32.1
186Shaun King1999--2004tam-crd5057195.9%2.3%6.75.8161.1%4.1%5.53.7
187Pat Haden1976--1981ram10024414.4%2.9%75.8263.1%7.1%6.43.3
188Bobby Douglass1969--1978chi-sdg-nor-gnb6493166.2%3.5%7.25.8572.1%5.8%5.12.5
189Cotton Davidson1960--1968kan-rai11451306.5%4.1%7.55.7402.9%7.2%6.33.1
190Steve Bono1985--1999min-pit-sfo-kan-gnb-ram-car10576494.6%1.8%6.45.7262.5%3.7%5.74.1
191Marc Wilson1980--1990rai-nwe14526395.8%4%7.45.7422.8%5.8%6.53.9
192Billy Joe Tolliver1989--1999sdg-atl-oti-kan-nor10760245%2.6%6.85.7533%4.1%6.14.4
193Rick Mirer1993--2003sea-chi-nyj-sfo-rai11969273.9%2.4%6.65.6521.8%4.4%5.53.5
194Steve Ramsey1970--1976nor-den6437235.4%5.9%8.15.6282.4%6.5%6.33.4
195Jacky Lee1960--1969oti-den-kan6191309%7%8.55.5294%6.9%6.63.6
196Hugh Millen1987--1995ram-atl-nwe-den644082.3%4.2%7.45.5302.4%3.6%6.85.2
197Jim Ninowski1960--1969det-cle-was-nor6953334.3%4.5%7.55.5272.6%7.4%6.22.9
198Dave Wilson1981--1988nor7007164.2%5.2%7.85.5373.1%5.5%6.23.8
199Kyle Boller2003--2011rav-ram-rai8931304.1%1.7%6.25.5362.6%4.7%5.73.6
200Joey Harrington2002--2007det-mia-atl14693274.4%2.2%6.45.5552.5%3.8%5.53.9
201Todd Blackledge1983--1989kan-pit5366225.2%3.4%6.95.5221.7%5.2%5.32.9
202Mike Tomczak1985--1999chi-gnb-cle-pit16963793.8%3.9%7.15.5593.4%5.3%6.64.2
203Mike Livingston1968--1979kan11295374.4%3.2%6.85.5522.4%5.7%6.23.7
204Danny Kanell1996--2003nyg-atl-den5328145.3%2.5%6.55.5252.2%4%4.93.2
205Steve Dils1980--1988min-ram-atl5816183.5%2.6%6.55.4292.4%3.6%5.74.1
206Jack Thompson1979--1984cin-tam5329155.3%1.8%6.15.4303.5%6.2%6.33.6
207Kent Graham1992--2001nyg-crd-pit-was7801274.4%1.6%65.4331.8%3.1%5.74.3
208David Woodley1980--1985mia-pit9203384.4%3.5%6.95.4243%7.4%6.33.1
209Randy Johnson1966--1976atl-nyg-was-gnb8329147.8%4.4%7.25.4583.2%7.6%6.33
210Rex Grossman2003--2011chi-htx-was11015304.7%3.3%6.85.4272.3%4.3%6.24.3
211Jim Miller1995--2002pit-chi6410203.9%2.9%6.65.3183%3.2%5.64.3
212Dan Pastorini1971--1983oti-rai-ram-phi19469624.6%4.2%7.15.3812.5%6.1%5.42.7
213Paul McDonald1980--1984cle5550123.8%3.4%6.85.3232.8%5.1%74.7
214George Blanda1960--1975oti-rai220291428.4%6%7.85.3793.9%8%6.12.5
215Jack Kemp1960--1969sdg-buf22256714.6%5.2%7.55.2462.2%7.1%6.23
216David Whitehurst1977--1983gnb6205216.1%5.3%7.45.1301.1%5.4%5.73.3
217Zeke Bratkowski1960--1971chi-ram-gnb8005304.7%5.5%7.55.1453.5%8.9%6.62.7
218Steve Spurrier1967--1976sfo-tam6878486.4%4.9%7.15.1532.2%5.2%5.43.1
219Joe Kapp1967--1970min-nwe6746266.6%6.2%7.75.1262.2%8.1%5.72.1
220Bob Avellini1975--1984chi7288304.2%5.9%7.55362.3%6.8%5.72.7
221Frank Tripucka1960--1963den7676135.1%5.9%7.55293.3%6.7%5.22.3
222Pete Beathard1964--1973kan-oti-crd-ram8544404.5%5.3%7.24.9342.5%7.3%5.62.4
223Gary Cuozzo1963--1972clt-nor-min-crd7688474.6%3.9%6.54.9352.9%5.7%63.5
224Al Dorow1960--1962nyj-buf5732145.7%5%6.94.8184.7%8.5%5.82.1
225Steve Walsh1989--1999dal-nor-chi-ram-tam-clt8248273.9%3.2%6.24.8342.4%4.5%5.93.9
226Mike Phipps1970--1981cle-chi10806504.5%3.7%6.44.8511.7%8.4%5.31.6
227Scott Brunner1980--1985nyg-crd6843163.7%3.7%6.34.7293%5.8%6.23.6
228Jack Concannon1964--1975phi-chi-gnb-det6270274.6%4.3%6.54.6322.5%6.8%5.12.1
229Mike Taliaferro1964--1972nyj-nwe-buf5241198.2%4.7%6.34.4412.2%7.2%5.11.9

[continue reading…]

References

References
1 Unfortunately, I excluded sack data from this study due to its general unavailability for most of the covered time period.
{ 0 comments }

These guys are pretty good.

These guys are pretty good.

After posting about SRS-style quarterback ratings on Monday, I was thinking about other things we can do with game-by-game data like that. In his QBGOAT series, Chase likes to compare QBs to the league average, which makes a lot of sense for all-time ratings — you want to reward guys who are at least above-average in a ranking like that. However, if we want seasonal value, perhaps average is too high a baseline.

Over at Football Outsiders, Aaron Schatz has always compared to “replacement level”, borrowing a concept from baseball. I like that approach, but replacement level can be hard to empirically determine. So for the purposes of this post, I wanted to come up with a quick-and-dirty baseline to which we can compare QBs.

To that end, I looked at all players who were not their team’s primary passer in each game since 2010. Weighted by recency and the number of dropbacks by each passer, they performed at roughly a 4.4 Adjusted Net Yards Per Attempt level. This is not necessarily the replacement level, but it does seem to be the “bench level” — i.e., the ANYPA you could expect from a backup-caliber QB across the league.

Using 4.4 ANYPA as the baseline, we get the following values for 2012:

QuarterbackQBYAB
Tom Brady1888.1
Peyton Manning1708.2
Matt Ryan1453.4
Drew Brees1441.8
Aaron Rodgers1337.4
Robert Griffin III1226.6
Matt Schaub1205.1
Josh Freeman1140.1
Cam Newton1128.2
Tony Romo1120.2
Ben Roethlisberger1082.8
Carson Palmer1011.9
Eli Manning1002.9
Joe Flacco914.8
Russell Wilson890.5
Matthew Stafford834.1
Andy Dalton756.9
Andrew Luck691.6
Sam Bradford616.3
Alex Smith558.5
Colin Kaepernick506.5
Ryan Fitzpatrick481.1
Philip Rivers447.7
Ryan Tannehill409.6
Brandon Weeden320.4
Michael Vick317.5
Jake Locker316.9
Jay Cutler293.8
Chad Henne217.4
Kirk Cousins156.8
Nick Foles152.5
Shaun Hill151.9
Matt Hasselbeck134.0
Kevin Kolb121.4
Blaine Gabbert92.2
Christian Ponder91.0
Mohamed Sanu87.7
Kyle Orton62.8
Matt Moore52.5
Derek Anderson30.1
Matt Flynn23.7
Dan Orlovsky17.6
Greg McElroy11.4
Tyrod Taylor9.2
Rusty Smith9.1
Chase Daniel5.6
Tyler Thigpen2.7
Graham Harrell-1.6
Terrelle Pryor-4.4
Matt Leinart-5.1
David Carr-5.9
Tim Tebow-6.3
Mark Sanchez-13.3
Charlie Batch-17.8
Kellen Clemens-22.4
Ryan Mallett-45.9
Byron Leftwich-46.6
Matt Cassel-47.7
Brad Smith-50.0
T.J. Yates-55.1
Jason Campbell-88.4
Brady Quinn-146.4
John Skelton-309.2
Ryan Lindley-382.0

If we weigh each game by how recent the results took place, we get this list:

QuarterbackWgtd QBYAB
Tom Brady1527.6
Drew Brees1205.4
Peyton Manning1202.0
Matt Ryan1129.8
Aaron Rodgers1109.4
Tony Romo961.1
Cam Newton936.6
Matt Schaub900.3
Robert Griffin III869.5
Eli Manning795.5
Ben Roethlisberger793.9
Josh Freeman790.3
Carson Palmer760.4
Russell Wilson722.9
Matthew Stafford687.5
Joe Flacco666.3
Andy Dalton520.4
Andrew Luck479.9
Sam Bradford459.9
Colin Kaepernick443.0
Alex Smith399.3
Philip Rivers384.9
Ryan Fitzpatrick324.0
Ryan Tannehill313.1
Brandon Weeden266.5
Michael Vick249.9
Jay Cutler236.8
Jake Locker192.4
Chad Henne178.7
Kirk Cousins158.7
Nick Foles150.5
Matt Hasselbeck133.1
Shaun Hill84.4
Kevin Kolb70.6
Matt Moore64.8
Kyle Orton59.8
Mohamed Sanu47.4
Matt Flynn47.4
Blaine Gabbert39.9
Dan Orlovsky26.3
Tim Tebow16.3
Derek Anderson16.3
Greg McElroy10.3
Chase Daniel5.1
Rusty Smith4.8
Tyrod Taylor4.0
Tyler Thigpen-0.8
Graham Harrell-1.4
Matt Leinart-2.8
David Carr-3.3
Terrelle Pryor-4.4
Charlie Batch-7.6
Kellen Clemens-14.0
Matt Cassel-24.2
T.J. Yates-29.7
Brad Smith-33.2
Byron Leftwich-38.3
Christian Ponder-39.4
Ryan Mallett-44.6
Jason Campbell-51.1
Mark Sanchez-91.0
Brady Quinn-113.4
John Skelton-263.6
Ryan Lindley-340.5

This kind of thing isn’t exactly the most advanced stat in the world, but it’s pretty good if you want to sort QBs into general groups based on how good they are (the assumption being that a player who never plays is implicitly a bench-level player by definition).

{ 2 comments }

Checkdowns: Biggest failed comebacks

Brady joins Marino on the failed comebacks list

Brady joins Marino on the failed comebacks list.

[UPDATE: There was an error earlier in this post. I believe it is fixed now.]

On Sunday Night, the Patriots trailed 31-3 halfway through the third quarter. But that’s when Tom Brady got hot, and New England tied the game with 6:43 left in the 4th quarter. At that moment, many fans probably had visions of the Oilers-Bills playoff game, where Buffalo came back from a 32-point deficit to win.

And while there are a lot of famous comebacks, the failed comeback is much less memorable. But in fact, this was the 4th time a team trailed by 28 points in the game only to tie or take the lead in the 4th quarter… but ultimately lose.

The table below shows all games prior to 2012 where a team trailed by at least 21 points, was trailing entering the 4th quarter, came back to tie or take the lead in the 4th quarter, but then still lost. The table is listed from the perspective of the eventual winner and shows the final points for and points allowed in the game, along with the biggest lead and the largest fourth-quarter deficit the winning team faced despite the large early lead.

YearDateBoxscoreTmOppPFPABgLdDef
199409/25/1994BoxscoreMINMIA3835280
194409/24/1944BoxscoreGNBCHI4228280
200710/21/2007BoxscoreTENHOU383625-1
200412/12/2004BoxscoreSFOARI3128250
198012/07/1980BoxscoreCINBAL343325-2
198710/25/1987BoxscoreGNBDET343324-2
198101/02/1982BoxscoreSDGMIA413824-7
199609/22/1996BoxscoreNWEJAX2825220
201012/13/2010BoxscoreBALHOU3428210
200910/11/2009BoxscoreARIHOU2821210
200901/10/2010BoxscoreARIGNB5145210
200809/14/2008BoxscoreGNBDET482521-1
200612/17/2006BoxscoreCHITAM3431210
200410/10/2004BoxscoreMINHOU3428210
200311/30/2003BoxscoreNWEIND3834210
199912/12/1999BoxscoreKANMIN3128210
199812/06/1998BoxscoreSFOCAR3128210
199511/19/1995BoxscoreDENSDG3027210
199309/12/1993BoxscoreNORATL3431210
199301/03/1994BoxscorePHISFO3734210
199111/17/1991BoxscoreNYJNWE2821210
199010/07/1990BoxscoreCINRAM3431210
198909/10/1989BoxscoreNWENYJ272421-3
198611/20/1986BoxscoreRAISDG3731210
198301/08/1984BoxscoreWASSFO2421210
198011/23/1980BoxscoreNYJHOU3128210
197909/09/1979BoxscoreWASDET2724210
197511/30/1975BoxscoreWASMIN313021-6
196011/06/1960BoxscoreBALGNB3824210
194910/23/1949BoxscoreNYGCHI3528210
194511/04/1945BoxscoreWASCRD2421210

Note that this excludes games this game between Green Bay and Pittsburgh from 1951, where the Packers held a 28-point lead and won, but actually trailed entering the 4th quarter.

{ 1 comment }

Checkdowns: Patriots Passing Game Struggles

If there was one thing you can count on in New England, it’s that the Patriots passing attack would be more efficient than their opponent’s nearly every week. From 2003 to 2011, New England averaged 6.9 net yards per pass attempt while their defense allowed 6.0 NY/A. But this season, the Patriots passing offense is struggling by New England standards while the pass defense is worse than ever. Take a look: [1]Note that the table below lists team passing yards, which already deducts sack yardage lost

YearAttYdsSkOpp_AttOpp_YdsOpp_SkNY/ANY/A ADiff
20122431758132191733116.97.5-0.7
20116125084326194703407.97.10.8
20105073847256114136367.26.40.8
20095924436185123355317.36.21.1
20085363569464743219316.16.4-0.2
20075864731215263041477.85.32.5
20065273400295183203446.15.70.4
200556441202852737033376.60.3
200448535882653834004575.81.2
200353734323261832324164.91.1
20026053577315313179345.65.60
20014823089465463497415.96-0.1
20005653181485443522295.26.1-1

Playing the Jets on Sunday is the perfect medicine for a NY/A-imbalance, but what do you make of New England’s struggles this year?

References

References
1 Note that the table below lists team passing yards, which already deducts sack yardage lost
{ 3 comments }

The original standard for postseason success.

On Wednesday, I explained the methodology for grading each quarterback in each season. Yesterday, I came up with an all-time career list of the best quarterbacks based on their regular season play. Today, a look at playoff performances.

Using the same formula, we can grade each quarterback in each game and adjust for era [1]Note that I do not have individual playoff sack data prior to 2008, so I am using pro-rated sack numbers based on team sack data.. However, it should be obvious that the sample sizes here are incredibly small, and the stats are even less likely to tell the true story when looking at just one game. Strength of schedule becomes a significant factor here, as well. But, caveats aside, there’s a lot we can do with playoff data. For example, we can rank every quarterback performance in Super Bowl history:

RkQBTmOppSBW/LAttPydTDINTCYCYPVAL
1Joe MontanaSFOMIA19W353313040611272
2Steve YoungSFOSDG29W363256043111.1264
3Troy AikmanDALBUF27W302734038112.3258
4Joe MontanaSFODEN24W292975039713.3256
5Kurt WarnerSTLTEN34W45414204479.7225
6Jim PlunkettOAKPHI15W212613032014.5219
7Phil SimmsNYGDEN21W252683032312.4216
8Doug WilliamsWASDEN22W293404135811.6211
9John ElwayDENATL33W293361133111181
10Jim McMahonCHINWE20W202560028411.6174
11Joe MontanaSFOCIN23W36357203519165
12Jake DelhommeCARNWE38L33323303258.8146
13Tom BradyNWECAR38W48354313697.7141
14Terry BradshawPITDAL13W30318412667.8140
15Mark RypienWASBUF26W33292212878.7128
16Terry BradshawPITRAM14W213092321410.2123
17Bart StarrGNBKAN1W23250212248.7121
18Terry BradshawPITDAL10W19209202009.5121
19Aaron RodgersGNBPIT45W39304303488.3118
20Brett FavreGNBNWE31W27246202688.1111
21Drew BreesNORIND44W39288203218107
22Ken StablerOAKMIN11W19180101838.7103
23Troy AikmanDALPIT30W23209102188.791
24Kurt WarnerARIPIT43L43377313297.387
25John ElwayDENNYG21L37304112706.581
26Bart StarrGNBOAK2W24202101826.579
27Joe MontanaSFOCIN16W22157101887.876
28Tom BradyNWEPHI39W33236202597.475
29Joe NamathNYJBAL3W28206001956.568
30Peyton ManningINDNOR44L45333113086.867
31Ken AndersonCINSFO16L34300222546.467
32Jeff HostetlerNYGBUF25W32222102346.966
33Bob LeeMINOAK11L9811010010.965
34Roger StaubachDALMIA6W19119201406.763
35Steve McNairTENSTL34L36214002085.661
36Eli ManningNYGNWE46W4029610302761
37Terry BradshawPITMIN9W1496101046.559
38Kurt WarnerSTLNWE36L4436512287655
39Roger StaubachDALPIT13L30228311614.653
40Jim KellyBUFNYG25L30212002056.652
41Jim PlunkettRAIWAS18W25172101746.448
42Roger StaubachDALDEN12W25183101424.845
43Brad JohnsonTAMOAK37W34215212106.245
44Earl MorrallBALDAL5W15147011026.843
45Ben RoethlisbergerPITARI43W30256112096.537
46Bob GrieseMIAMIN8W77300637.934
47Brett FavreGNBDEN32L42256312405.634
48Daryle LamonicaOAKGNB2L34208211814.932
49Fran TarkentonMINMIA8L28182011414.531
50Gary KubiakDENNYG21L448004510.225
51Troy AikmanDALBUF28W27207011595.521
52Tom BradyNWENYG46L41276212616.120
53Len DawsonKANGNB1L27211111354.219
54Trent DilferBALNYG35W25153101545.517
55Tom BradyNWESTL36W27145101545.314
56Len DawsonKANMIN4W1714211974.910
57Gary KubiakDENSFO24L32800256.87
58Frank ReichBUFWAS26L11100109.45
59Steve YoungSFODEN24W32000206.55
60Vince FerragamoRAMPIT14L25212011274.44
61Danny WhiteDALDEN12W250031.14
62Matt HasselbeckSEAPIT40L49273112344.53
63Ben RoethlisbergerPITGNB45L40263222115.12
64Bill MusgraveSFOSDG29W160065.20
65Fran TarkentonMINOAK11L35205121323.7-4
66Babe ParilliNYJBAL3W10000-0.4-5
67Zeke BratkowskiGNBKAN1W1000-1-0.8-5
68Jay SchroederWASDEN22W1000-1-0.6-6
69Pete BeathardKANGNB1L5170071.3-6
70Tony BanksBALNYG35W1000-1-0.7-6
71Eli ManningNYGNWE42W34255211824.9-8
72Bob GrieseMIAWAS7W118811443.4-8
73Peyton ManningINDCHI41W38247111844.7-10
74John ElwayDENGNB32W2212301984.3-12
75Don StrockMIAWAS17L3000-3-0.9-17
76Steve FullerCHINWE20W4000-3-0.6-23
77Ron JaworskiPHIOAK15L38291131463.8-28
78Joe TheismannWASMIA17W2314322742.8-33
79Dan MarinoMIASFO19L50318122194.1-33
80Elvis GrbacSFOSDG29W1000-30-28.2-36
81Johnny UnitasBALNYJ3L2411001652.7-37
82David WoodleyMIAWAS17L149711281.9-37
83Donovan McNabbPHINWE39L51357332494.5-40
84Norris WeeseDENDAL12L102200-18-1.6-42
85Gale GilbertSDGSFO29L63001-17-2.7-44
86Gary CuozzoMINKAN4L31601-32-9.6-46
87Johnny UnitasBALDAL5W98812-12-1.3-47
88Tom BradyNWENYG42L48266102194.1-53
89Bob GrieseMIADAL6L2313401301.3-58
90Boomer EsiasonCINSFO23L2514401782.6-65
91Jim KellyBUFDAL28L50260011823.4-66
92Stan HumphriesSDGSFO29L49275121893.7-67
93Ben RoethlisbergerPITSEA40W2112302452-67
94Tony EasonNWECHI20L6000-40-5.6-72
95Roger StaubachDALPIT10L2420423371.2-78
96Chris ChandlerATLDEN33L3521913912.5-79
97Joe KappMINKAN4L2518302391.4-81
98John ElwayDENWAS22L3825713932.2-90
99Rex GrossmanCHIIND41L2816512541.9-90
100Steve GroganNWECHI20L3017712561.6-105
101Jim KellyBUFDAL27L78202-72-9.3-107
102Joe TheismannWASRAI18L3524302731.8-112
103Craig MortonDALBAL5L2612713-2-0.1-112
104Fran TarkentonMINPIT9L2610203-33-1.3-127
105Earl MorrallBALNYJ3L177103-64-3.8-136
106Frank ReichBUFDAL27L3119412160.5-137
107Neil O'DonnellPITDAL30L49239131222.3-147
108Billy KilmerWASMIA7L2810403-48-1.6-159
109Drew BledsoeNWEGNB31L4825324741.4-178
110John ElwayDENSFO24L2610802-22-0.7-182
111Rich GannonOAKTAM37L4427225350.7-212
112Craig MortonDENDAL12L153904-157-9-214
113Jim KellyBUFWAS26L5827524300.5-269
114Kerry CollinsNYGBAL35L3911204-124-2.9-335

If you type Montana’s name into the search box, you can see that he has the 1st, 4th, 11th and 27th best performance in Super Bowl history. The best performance in a losing effort goes to Jake Delhomme, who shredded the Patriots secondary in the second half of Super Bowl XXXVIII (he began the game 1 for 9 for 1 yard). The worst performance in a winning effort, unsurprisingly, goes to Ben Roethlisberger in Super Bowl XL, although Joe Theismann against the Dolphins gets an honorable mention. Worst performance overall goes to Kerry Collins, although Craig Morton’s 4 interceptions and 39 yards on 15 attempts against his former team in Super Bowl XII could give Collins a run for his money.

What about best championship game performances in the pre-Super Bowl era?

RkQBTmOppYearW/LAttPydTDINTCYCYPVAL
1Tobin RoteDETCLE1957W192804038019304
2Sid LuckmanCHIWAS1943W262865038614.8248
3Otto GrahamCLERAM1950W33298412927.7236
4Sammy BaughWASCHI1937W33335313209.7228
5Harry NewmanNYGCHI1933L192092120410.7197
6Charlie ConerlyNYGCHI1956W101952023222.1192
7Bart StarrGNBNYG1961W171643022413.2152
8Otto GrahamCLEDET1954W121633219312.9135
9Frank RyanCLEBAL1964W182063121211.2132
10Norm Van BrocklinRAMCLE1951W61281014824.7129
11Tobin RoteSDGBOS1963W151732022613.1127
12Sid LuckmanCHINYG1941W121600016013.3125
13George BlandaHOULAC1960W313013036111.6123
14Charlie ConerlyNYGBAL1958W141871019011.6122
15Arnie HerberGNBNYG1938L141231014310.2117
16Johnny UnitasBALNYG1959W29264202677.4115
17Charlie O'RourkeCHIWAS1942L71280012818.3105

[continue reading…]

References

References
1 Note that I do not have individual playoff sack data prior to 2008, so I am using pro-rated sack numbers based on team sack data.
{ 8 comments }

Yesterday, I explained the methodology behind the formula involved in ranking every quarterback season in football history. Today, I’m going to present the career results. Converting season value to career value isn’t as simple as it might seem. Generally, we don’t want a player who was very good for 12 years to rank ahead of a quarterback who was elite for ten. Additionally, we don’t want to give significant penalties to players who struggled as rookies or hung around too long; we’re mostly concerned with the peak value of the player.

What I’ve historically done — and done here — is to give each quarterback 100% of his value or score from his best season, 95% of his score in his second best season, 90% of his score in his third best season, and so on. This rewards quarterbacks who played really well for a long time and doesn’t kill players with really poor rookie years or seasons late in their career. It also helps to prevent the quarterbacks who were compilers from dominating the top of the list. The table below shows the top 150 regular season QBs in NFL history using that formula, along with the first and last years of their careers, their number of career attempts (including sacks and rushing touchdowns), and their career records and winning percentages (each since 1950). For visibility reasons, I’ve shown the top 30 quarterbacks below, but you can change that number in the filter or click on the right arrow to see the remaining quarterbacks.
[continue reading…]

{ 21 comments }

In 2006, I took a stab at ranking every quarterback in NFL history. Two years later, I acquired more data and made enough improvements to merit publishing an updated and more accurate list of the best quarterbacks the league has ever seen. In 2009, I tweaked the formula again, and published a set of career rankings, along with a set of strength of schedule, era and weather adjustments, and finally career rankings which include those adjustments and playoff performances.

If nothing else, that was three years ago, so the series was due for an update. I’ve also acquired more data, enabling me to tweak the formula to better reflect player performance. But let’s start today with an explanation of the methodology I’m using. To rank a group of players, you need to decide which metric you’re ordering the list by. I’ll get to all of the criteria I’m not using in a little bit, but the formula does use each of the following: pass attempts, passing touchdowns, passing yards, interceptions, sacks, sack yards lost, fumbles, fumbles recovered, rush attempts, rushing yards and rushing touchdowns. Most importantly, the formula is adjusted for era and league.

Two of the best quarterbacks ever.

So where do we begin? We start with plain old yards per attempt. I then incorporate sack data by removing sack yards from the numerator and adding sacks to the denominator [1]I have individual sack data for every quarterback since 1969. For seasons before then, I have team sack data going back to 1949. For seasons before 1950, I ignored sacks; for seasons between 1950 … Continue reading. To include touchdowns and pass attempts, I gave a quarterback 20 yards for each passing touchdown and subtracted 45 yards for each interception. This calculation — (Pass Yards + 20 * PTD – 45 * INT – Sack Yards Lost) / (Sacks + Pass Attempts) forms the basis for Adjusted Net Yards per Attempt, one of the key metrics I use to evaluate quarterbacks.

For purposes of this study, I did some further tweaking. I’m including rushing touchdowns, because our goal is to measure quarterbacks as players. There’s no reason to separate rushing and passing touchdowns from a value standpoint, so all passing and rushing touchdowns are worth 20 yards and are calculated in the numerator of Adjusted Net Yards per Attempt. To be consistent, I also include rushing touchdowns in the denominator of the equation. This won’t change anything for most quarterbacks, but feels right to me. A touchdown is a touchdown.
[continue reading…]

References

References
1 I have individual sack data for every quarterback since 1969. For seasons before then, I have team sack data going back to 1949. For seasons before 1950, I ignored sacks; for seasons between 1950 and 1969, I gave each quarterback an approximate number of sacks, giving him the pro-rated portion of sacks allowed by the percentage of pass attempts he threw for the team. While imperfect, I thought this “fix” to be better than to ignore the data completely, especially for years where one quarterback was responsible for the vast majority of his team’s pass attempts.
{ 13 comments }

Quarterback wins over Pythagoras

No, this article isn’t an article about quarterbacks squaring off against ancient Greek mathematicians. Today, we’re going to look at quarterback win-loss records and see how they compare to their Pythagorean win-loss records.

Over 30 years ago, Bill James wrote that, on average, baseball teams’ true strengths could be measured more accurately by looking at runs scored and runs allowed than by looking at wins and losses. Since then, sports statisticians have applied the same thinking to all sports. The formula to calculate a team’s Pythagorean winning percentage is always some variation of:

(Points Scored^2) / (Points Scored ^2 + Points Allowed^2)

With the exponent changing from 2 to whatever number best fits the data for the particular sport. In football, that number is 2.53. We can look, for example, at the Pythagorean records for each team in the league last season, and line it up against their actual record:

YearTmRecordWin%PFPAPyth WinsDiff
2011KAN7-90.4382123383.763.24
2011GNB15-10.93856035912.082.92
2011DEN8-80.5003093905.712.29
2011OAK8-80.5003594336.141.86
2011NWE13-30.81351334211.781.22
2011NYG9-70.5633944007.851.15
2011ARI8-80.5003123486.91.1
2011TAM4-120.2502874943.230.77
2011TEN9-70.5633253178.250.75
2011NOR13-30.81354733912.330.67
2011BAL12-40.75037826611.340.66
2011ATL10-60.6254023509.390.61
2011SFO13-30.81338022912.520.48
2011CIN9-70.5633443238.640.36
2011PIT12-40.75032522711.40.6
2011MIA6-100.3753293138.5-2.5
2011MIN3-130.1883404495.3-2.3
2011PHI8-80.5003963289.87-1.87
2011CAR6-100.3754064297.44-1.44
2011SEA7-90.4383213158.19-1.19
2011IND2-140.1252434303.05-1.05
2011HOU10-60.62538127811.03-1.03
2011SDG8-80.5004063778.75-0.75
2011CLE4-120.2502183074.74-0.74
2011WAS5-110.3132883675.62-0.62
2011DAL8-80.5003693478.62-0.62
2011BUF6-100.3753724346.46-0.46
2011NYJ8-80.5003773638.38-0.38
2011CHI8-80.5003533418.35-0.35
2011STL2-140.1251934072.1-0.1
2011JAX5-110.3132433295.08-0.08
2011DET10-60.62547438710.01-0.01

[continue reading…]

{ 2 comments }
Next Posts