≡ Menu

On Tuesday, I looked at which receivers produced the most Adjusted Catch Yards over the baseline of worst starter. Yesterday, I used that data to help identify which receivers produced their numbers in the most pass-happy offenses. Today, instead of measuring wide receivers by how often their teams passed, I want to measure them by how well they passed.

Some teams are very efficient at passing because they have great wide receivers: to be clear, today’s post doesn’t prove anything about which way the causation arrow runs. But I do think it’s worth quantifying the reality that receivers produce their numbers in very disparte environments. Let’s use Joey Galloway as an example. Galloway, longtime readers will recall, was a favorite of an early iteration of Doug Drinen’s attempts at ranking wide receivers. For similar reasons, Galloway comes out “very good” in this system, if good means producing numbers while playing for bad passing offenses (a proxy, one could argue, for playing with bad quarterbacks).

Galloway produced 2,071 Adjusted Catch Yards above the baseline in his career, good for an unremarkable 84th place on Tuesday’s list. But let’s look at the 8 seasons that get Galloway there: [continue reading…]

{ 11 comments }

Yesterday, I looked at which receivers produced the most Adjusted Catch Yards over the baseline of the worst starter. Today, I want to use that data to help identify which receivers put up their numbers in the most pass-happy offenses.

Let’s use Calvin Johnson as an example. He’s been with the Lions for each season of his career, and Detroit has been very pass-happy throughout his career. Last year, Detroit averaged averaged 40.56 dropbacks (pass attempts plus sacks) per game, while the league average was 37.29 dropbacks per game. So Detroit passed 108.8% as often as the average team.

In 2013, Detroit’s ratio to the league average was 108.2%, but it was 129.8% in 2012. To measure pass-happiness as it pertains to Johnson, we can’t just take Detroit’s average grade from ’07 to ’14; instead, we need to assign more weight to Johnson’s best years. Johnson gained 1,358 ACY over the baseline in 2012, which represents 29% of his career value of 4,721 ACY over the baseline. As a result, Detroit’s 129.8% ratio in 2012 needs to count for 29% of Johnson’s career pass-happy grade.

If we do this for each of the players in yesterday’s top 100, here are the results. [continue reading…]

{ 13 comments }

Brown stuck the lanning.

Brown stuck the lanning.

Adjusted Catch Yards are simply receiving yards with a 5-yard bonus for each reception and a 20-yard bonus for each receiving touchdown. In 2014, Antonio Brown led the NFL with 2,603 Adjusted Catch Yards, the 5th highest total in NFL history. That was the result of a whopping 129 receptions for 1,698 receiving yards (both of which led the league) and 13 touchdowns.

Brown was dominant in 2014, and he led the NFL in more advanced systems, too. But today, I wanted to do something relatively simple. How do we compare Brown’s 2014 to say, three Packers greats from years past?

In 1992, Sterling Sharpe had 108 catches for 1,461 yards and 13 touchdowns. Those are pretty great numbers for 1992, although they don’t leap off the page the way Brown’s 2014 stat line does. If we go back farther, Billy Howton in 1956 had 55 receptions for 1,188 yards and 12 touchdowns. Like Brown, that was good enough to lead the NFL in two of the three major categories, and rank 2nd in the third. And 15 years earlier, Don Hutson caught 58 passes for 738 yards and 10 touchdowns. How do we compare that statline to Brown’s?

Here’s what I did.

1) Calculate each player’s Adjusted Catch Yards. For Brown, that’s 2,603. For Sharpe, Howton, and Hutson, it’s 2,261, 1,703, and 1,228, respectively.

2) Next, calculate the Adjusted Catch Yards for every other player in the NFL. Then, determine the baseline in each year, defined as the number of ACY by the Nth ranked player, where N equals the number of teams in the league. For Brown, that means using 1,398 Adjusted Catch Yards, the number produced by the 32nd-ranked player in ACY in 2014. For Sharpe, we use 1,078 ACY, the number gained by the 28th-ranked player in ’92. For Howton, it’s just 797, the number of ACY for the 12th-ranked player (keep in mind that ’56 was a very run-heavy year). And finally, for Huston, we use the 10th-ranked player from 1941, who gained only 413 Adjusted Catch Yards.

3) Next, we subtract the baseline from each player’s number of Adjusted Catch Yards. So Brown is credited with 1,205 ACY over the baseline, Sharpe gets 1,183 ACY over the baseline, Howton is 906 ACY over the baseline, and Hutson is 815 ACY over the baseline.

4) Finally, we must pro-rate for non-16 game seasons. For Brown and Sharpe, we don’t need to do anything, so Brown wins, 1,205 to 1,183. Howton played in a 12-game season, so we multiply his 906 by 16 and divide by 12, giving him 1,208 ACY, narrowly edging Brown. And in 1941, the NFL had an 11-game slate; multiply 815 by 16 and divide by 11, and Hutson is credited with 1,185 ACY.

As you can see, it wasn’t a coincidence I chose those three Packers seasons to compare to Brown. Those four seasons are the 19th-through-22nd best seasons of all time by this metric, and stand out as roughly equally dominant for their eras (both Sharpe and Hutson won the triple crown of receiving in their years).

This is not my preferred method of measuring wide receiver player, but it’s my favorite “simple” one. I put simple in quotes, of course, since there’s a lot of programming power behind generating these numbers. But at a high level, it’s simple: we combine the three main receiving stats into one, we adjust for era because the game has changed so much, and we pro-rate for years where the league didn’t play 16 games. Nothing more, nothing less. [continue reading…]

{ 29 comments }

The GOAT

The GOAT

On Wednesday, we looked at the most dominant quarterbacks in fantasy history. Yesterday, we did the same for running backs. Today, we look at wide receivers, using the methodology described over the two previous days.

I am using the following scoring system throughout this series: 1 point per 20 yards passing, 1 point per 10 yards rushing/receiving, 4 points per passing TD, 6 points per rushing/receiving TD, 0.5 points per reception.

There are four seasons that have topped 200 points of VBD in wide receiver history: Elroy Hirsch, 1951; Wes Chandler, 1982; and Jerry Rice, 1987 and 1995. In ’95, Rice set the still-standing record with 351.5 fantasy points, courtesy of 122 catches, 1,848 receiving yards, and 15 touchdowns (he also rushed for 36 yards and a touchdown). Rice averaged 21.97 FP/G that year, while the baseline of WR32 was 9.15 FP/G. Therefore, Rice was 12.82 FP/G above the baseline for 16 games, which comes out to 205.1 points of VBD. [continue reading…]

{ 19 comments }

On Saturday, we looked at the top passing performers against each franchise. Yesterday, we did the same thing but with rushing statistics. Today, we revive a post from two years ago and complete the series with a look at the top receiving producers against each franchise (all data beginning in 1960).

Let’s begin with receptions. In the past two seasons, Jason Witten has emerged as the number one franchise nemesis for both Washington and New York, eliminating Art Monk and Michael Irvin, respectively, from the tops of those record books. Witten was already the top guy against the Eagles, making him the career leader in receptions against each of the Cowboys three NFC East rivals.

Other non-surprising news: Jerry Rice is the top man against the Falcons, Saints, and Rams, with his numbers against Atlanta being particularly mind-blowing. Tim Brown is number one against his old AFC West teams, and was also number one against the Seahawks until Larry Fitzgerald just passed him. Andre Reed takes the top spot against the Dolphins/Colts/Jets (Marvin Harrison is #1 against the Patriots), Hines Ward has more catches than anyone against the Browns/Bengals/Ravens, while Cris Carter is number one against all four of his old NFC Norris rivals. [continue reading…]

{ 16 comments }

Weekend Trivia: Yards per Reception Leaders

Do you know who led the NFL in yards per reception last year?  Or in any season?  Unlike certain rate stats, YPR tends to fly under the radar, at least with respect to questions like who led the league in a given season.

One reason for that is the leader is often a part-time player.  Last year, DeSean Jackson had the top YPR average in the league at 20.9, and he also ranked a respectable 13th in receiving yards. But in 2013, that honor went to New Orleans rookie Kenny Stills, who averaged 20 yards per catch but ranked just 61st with 641 receiving yards.

That leads us to today’s trivia question: Can you name the last player to lead the league in both yards per reception and in receiving yards? [continue reading…]

{ 5 comments }

On Tuesday, I looked at the fantastic rookie class of wide receivers that entered the NFL last year. But in that post, I focused on receiving yards; in fact, the group was even more incredible when it comes to receiving touchdowns.

Rookie wide receivers caught an astounding 92 touchdowns last year, highlighted by Odell Beckham and Mike Evans each snatching a dozen scores. In addition, Kelvin Benjamin (9), Martavis Bryant (8), Jordan Matthews (8), Sammy Watkins (6), Allen Hurns (6), John Brown (5) and Jarvis Landry (5) each caught at least five touchdowns.

Let’s put that number in perspective. Second-year wide receivers caught just 43 touchdowns last year, while third-year and fourth-year wideouts each caught 59 touchdowns. Players from the class of 2010 caught 72, the second highest amount of any class last year. Take a look: [continue reading…]

{ 2 comments }

The 2014 Class of Rookie Wide Receivers

In December, I provided a quick look at rookie receiving production, and noted that an unusually large amount of receiving yards had come from first-year players. In that study, I lumped all rookies together, but today, the focus will be on only wide receivers.

And the 2014 season was an incredible one for rookie wide receivers. Odell Beckham was unsurprisingly named the Offensive Rookie of the Year by the AP, with a rookie-high 1,305 receiving yards. Tampa Bay’s Mike Evans and Carolina’s Kelvin Benjamin each topped 1,000 yards, while Sammy Watkins (982), Jordan Matthews (872), and Jarvis Landry (758) all had seasons that would stand out as special in many other years.

The depth of the class was impressive, too: John Brown (696), Allen Hurns (677), Taylor Gabriel (621), Brandin Cooks (550), Martavis Bryant (549), Allen Robinson (548) all topped 500 yards, while Davante Adams, Donte Moncrief and Marqise Lee all hit the 400-yard mark.

Collectively, rookie wide receivers recorded 12,611 receiving yards last year, the most of any class year in the NFL in 2014. The graph below shows the number of receiving yards from wide receivers from each class (i.e., 1st year, 2nd year, 3rd year, etc.) in the NFL in 2014: [continue reading…]

{ 3 comments }

Trivia: St. Louis Rams and Receiver Turnover

From 2000 to 2008, Torry Holt led the Rams in receiving yards in every season. But since then, St. Louis has gone to the other extreme: in 2009, the leading receiver was Donnie Avery, followed by Danny Amendola in ’10, Brandon Lloyd in ’11, Chris Givens in ’12, Jared Cook in ’13, and, believe it or not, Kenny Britt in 2014. That’s seven different leading receivers for St. Louis over the last seven years. If that continues in 2015, the Rams will become just the 4th team since 1950 to have eight different leading receivers in eight seasons.

Now, no team has ever done it in nine straight years. So, today’s trivia question: Can you guess any of the three teams to run this streak for eight seasons? [continue reading…]

{ 2 comments }

Good at catching footballs, in the event his team throws one

Good at catching footballs, in the event his team throws one

The Houston Texans finished 31st in pass attempts in 2014, ahead of only the Seattle Seahawks. The Texans were not exactly the beneficiaries of stellar quarterback play, either: Ryan Fitzpatrick handled 64% of the team’s pass attempts, with Case Keenum, Ryan Mallett, and Tom Savage taking the rest.

As a result, the 1,210 yards DeAndre Hopkins gained in 2014 is a lot better than it sounds. Houston threw for just 3,460 yards last year (excluding sacks), which means Hopkins gained 35% of all Texans receiving yards. Antonio Brown led the NFL with 1,698 receiving yards, but even that was just 34% of all Steelers receiving yards.

The table below shows the top 53 leaders in percentage of team receiving yards: [continue reading…]

{ 2 comments }

Brown was number one in 2014

Brown was number one in 2014

On Monday, I noted that Pittsburgh wide receiver Antonio Brown led the NFL in True Receiving Yards for the second straight season. He also, by the slimmest of margins, your leader in Adjusted Catch Yards per Attempt, too.

On October 1st, I looked at the leaders in Adjusted Catch Yards per Team Pass Attempt; at the time, Jordy Nelson had a big lead on the rest of the NFL, although Brown was in second place. You can read the fine details of the system in that post, but the short version is:

  • Begin with each player’s number of receiving yards. Add 9 yards for every first down gained, other than first downs that resulted in touchdowns, to which we add 20 yards. For Brown, this gives him 2,624 Adjusted Catch Yards (1,698 receiving yards, 87 first downs, 13 touchdowns).
  • Divide that number by the number of team pass attempts, including sacks, by that player’s offense. Pittsburgh recorded 645 dropbacks in 2014, which means Brown averaged 4.07 ACY/TmAtt. Jordy Nelson (1519/71/13) had 2,301 Adjusted Catch Yards and the Packers had 566 team pass attempts. That translates to .. 4.07 ACY/TmAtt, too. But go to three decimal places, and Brown (4.068 to 4.065) becomes your winner.
  • I have also included a column for Adjusted Catch Yards per Estimated Team Dropback; here, we use the same formula, but multiply the numerator by 16, and the denominator by the number of games played by the receiver. Let’s use Odell Beckham as an example. The Giants wide receiver finished with 1,959 ACY (1305/58/12) and New York had 637 dropbacks, giving Beckham 3.08 ACY/TmAtt. But if we adjust for the fact that Beckham missed four games, he gets credited with 4.10 ACY/EstTmAtt, which is the highest rate in the NFL.

The table below shows the top 50 receivers in ACY/TmAtt: [continue reading…]

{ 5 comments }
Brown was number one in 2014

Brown was number one in 2014

You may recall that in 2013, Antonio Brown led the NFL in True Receiving Yards, which felt controversial at the time. Remember, Calvin Johnson and Josh Gordon were the runaway choices by the Associated Press as the top receivers in the NFL; in addition, A.J. Green also received more votes, and Demaryius Thomas finished with as many votes as Brown.

Well, Brown has done it again, but I doubt it will surprise many people this time around. Brown led the NFL in receptions and receiving yards, and received 49 of 50 first-team All-Pro votes. Regular readers are familiar with the concept of True Receiving Yards, but let’s walk through the system using Brown and Dez Bryant, who jumps from 8th in receiving yards to 4th in True Receiving Yards. [continue reading…]

{ 4 comments }

The Steve Smith Postseason Post

Today’s guest post comes from Adam Harstad, who is also part of the Smitty Fan Club. You can follow Adam on twitter at @AdamHarstad.


One of the greatest playoff receivers ever

Smith considers letting the chip roll off his shoulder.

IS STEVE SMITH THE GREATEST POSTSEASON WR IN HISTORY?

Prior to this last weekend’s slate of games, I remarked to several friends what a treat it was that we got to watch Calvin Johnson, Larry Fitzgerald, and Steve Smith all playing on the same weekend. In addition to being three of the best receivers of the last decade, all three could lay claim to the best per-game postseason numbers in history, depending on where you set the cut-offs.

Calvin Johnson had only appeared in one postseason game prior to this season, but he made it count with 12/211/2 receiving in a losing effort. Calvin was actually the fourth player in history to top 10 receptions, 200 yards, and 2 touchdowns in a single playoff game, [1]Oddly, all four receivers to reach those marks were active this past weekend; in addition to Calvin Johnson, they were Reggie Wayne, Steve Smith, and T.Y. Hilton. but each of the three previous have played additional games to bring their per-game numbers down. Among players who appeared in at least one playoff game, Calvin’s 211-yard “average” was the best by a mile.

If you moved the cutoff to 6 games, Larry Fitzgerald’s postseason averages took over the spotlight. Following the 2008 NFL season, Fitzgerald had arguably the greatest postseason run by a wide receiver, hauling in 6/101/1, 8/166/1, 9/152/3, and 7/127/2 in his four games, including what would have been the Super Bowl-winning touchdown and a likely MVP performance if not for some heroics from Ben Roethlisberger and Santonio Holmes. Fitzgerald followed that up with a strong showing in the 2009 playoffs, catching 12/159/2 over two games. All told, Fitzgerald had 53/705/9 receiving in just six postseason appearances, for a per-game average of 8.8/118/1.5. [continue reading…]

References

References
1 Oddly, all four receivers to reach those marks were active this past weekend; in addition to Calvin Johnson, they were Reggie Wayne, Steve Smith, and T.Y. Hilton.
{ 1 comment }

Rookie Receivers and the 2014 Season

Odell Beckham is ridiculous. Period.

Mike Evans, in just about any other year, would be considered the best rookie wide receiver in the NFL. Players like Kelvin Benjamin and Sammy Watkins would stand out in most years, too: both have over 25% of their team’s receiving yards.

Jordan Matthews has 767 receiving yards, which is only considered unimpressive against when compared against the above backdrop. Ditto Jarvis Landry and his 79 receptions. Martavis Bryant has seven touchdowns. The Jaguars have three rookie receivers playing well. And on and on we could go (just as I did in late October, and as Bill Barnwell did after week twelve).

Through 16 weeks of the 2014 season, rookies have been responsible for 12.6% of all receptions in the NFL, 12.7% of all receiving yards, and 13.7% of all touchdowns. As it turns out, that does make the 2014 class a very special one. The table below shows the percentage of all receptions, receiving yards, and receiving touchdowns by rookies in each year (other than 1987) since 1970: [continue reading…]

{ 2 comments }

Guest Post: Is Reggie Wayne a Hall of Famer?

Bryan Frye is back with another fun guest post.  Bryan, as you may recall, owns and operates his own great site at http://www.thegridfe.com/, where he focuses on NFL stats and history.  You can view all of Bryan’s guest posts at Football Perspective at this link.


A future HOFer?

A future HOFer?

Reggie Wayne has been in the news recently because Chuck Pagano called a pair of late-game pass plays in order to stretch Wayne’s streak of consecutive games with at least three receptions to 81 games. [1]That number has since grown to 82. Frankly, I don’t care to criticize either of them for that. What I do want to do is acknowledge an impressive record from a great player and discuss whether or not he is likely to join fellow greats in the Pro Football Hall of Fame. [2]And yes, it is a very impressive streak, regardless of how it was achieved. According to Pro Football Reference, the second longest such streak is Cris Carter’s 58 from 1993-1997.

Hall of Fame voters don’t seem to care too much about advanced stats, so I won’t bother covering anything beyond simple box score numbers. [3]However, if you do want a more in depth look at receiving stats, check out Chase’s series on the greatest wide receivers of all time. What voters do seem to care about are counting stats and a good story, or a combination thereof. Without any more ado, let’s get into the stats and the narrative.

The Stats

Currently ranks 7th all-time in receptions, 8th all-time in receiving yards, and 22nd all-time in receiving touchdowns. I am making the assumption that he will play a few more years at a diminishing level until he retires. That will leave us with a few questions about his statistical merits.

[continue reading…]

References

References
1 That number has since grown to 82.
2 And yes, it is a very impressive streak, regardless of how it was achieved. According to Pro Football Reference, the second longest such streak is Cris Carter’s 58 from 1993-1997.
3 However, if you do want a more in depth look at receiving stats, check out Chase’s series on the greatest wide receivers of all time.
{ 19 comments }

Average Air Yards per Reception, 2013 and 2014

In 2013, Kenny Stills saw his average reception come 13.9 yards past the line of scrimmage, the farthest amount of yards in the air per catch of any receiver in the NFL. He’s the deep threat in the Saints offense, and he’s being utilized in a similar way this year, with his average catch from Drew Brees coming 12.8 yards downfield. When it comes to the top deep threats in the NFL, Stills and Arizona’s Michael Floyd stand out. Cardinals head coach Bruce Arians loves the vertical passing game, and Floyd has been the perfect weapon: he averaged a healthy 11.7 air yards per catch in 2013, but that number has spiked to 16.5 in 2014!

But not every player’s role is so static. In 2013, the Bengals used A.J. Green (average reception 10.5 yards in the air) and Marvin Jones (9.6) as deep threats, while Tyler Eifert (5.6), Mohamed Sanu (4.3), and Jermaine Gresham (4.2) were used on short/intermediate routes. But Jones will miss all of 2014 due to a foot injury, while Green has been limited to just 43% of the Bengals offensive snaps to date (and he was playing injured for a percentage of those plays, too). As a result, Sanu’s air yards per catch has jumped from 4.3 to 8.4, and his yards per reception has increased from 9.7 to 15.2.

Similarly, Emmanuel Sanders has seen his role change in 2014, as a result of switching teams. Last year, in Pittsburgh, Todd Haley’s offense called for lots of short routes for his wide receivers, but even among the wide receiver group, Sanders (6.3) had the shortest air yards per catch. Eric Decker, meanwhile, had his average reception come 10.8 yards downfield while playing with Peyton Manning. This year, Sanders — taking over Decker’s role — has averaged 10.3 yards in the air per catch.

The graph below shows wide receiver air yards in 2014 (on the X-axis) and 2013 (on the Y-axis): [continue reading…]

{ 1 comment }

Nelson has (still) been the league's best receiver in 2014

Nelson has (still) been the league’s best receiver in 2014

On October 1st, I looked at the leaders in Adjusted Catch Yards per Team Attempt. Today, I re-ran the numbers, which are through week 7 but also include the Broncos/Chargers game from Thursday night.

The formula is simple: Begin with receiving yards; add 9 yards for each first down reception, and 11 additional yards if that first down went for a touchdown. Then, divide that number by the player’s team’s number of pass attempts (including sacks). You can read more about the methodology here.

One player worth highlighting is Dez Bryant. Chances are, you’ve heard lots about DeMarco Murray and the Cowboys offensive line; you’ve also probably read something about the efficient season Tony Romo is having, and the shockingly decent performance from the Dallas defense. But Bryant is having a remarkably efficient year, too. The Cowboys are the second most run-heavy team in the NFL; as a result, Bryant ranks 9th with 590 yards through seven games, but he’s been much more productive than that on a per-attempt basis. [continue reading…]

{ 9 comments }

Nelson has been the league's best receiver in 2014

Nelson has been the league's best receiver in 2014

I have used the concept of Adjusted Catch Yards for a long time; that metric is the base statistic in my Greatest Wide Receivers Ever post. ACY, you may recall, is simply receiving yards with a 5-yard bonus for receptions and a 20-yard bonus for touchdowns. Why a 5-yard yard bonus for catches?

We want to give receivers credit for receptions because, all else being equal, a receiver with more receptions is providing more value because he’s likely generating more first downs.

For the last 15 years, we have data on the number of first downs a receiver produces. But this summer, we added a bit of crucial information: we now know that the value of a first down is about 9 yards. As a result, Adjusted Catch Yards can be modified to be:

Receiving Yards + 9 * First Downs + 11 * Touchdowns

Why is the variable on touchdowns changed to 11? Because a touchdown is a first down; mathematically, this is the same as keeping the value of a touchdown at 20 but changing the first downs variable to be “first downs that did not result in a touchdown.”

This year, Jordy Nelson has caught 33 passes for 459 yards and 3 touchdowns, with 24 of those catches going for first downs (and, of course, 21 going for first downs and not being a touchdown). As a result, Nelson has produced 708 Adjusted Catch Yards this year. But we don’t want to just rank receivers by Adjusted Catch Yards. One thing we can do is rank them on a per-attempt basis; while not as advanced as True Receiving Yards, this provides a relatively simple metric that everyone can understand. We start with receiving yards; then we add bonuses for first downs and touchdowns, and finally we divide the level of production by team pass opportunities. [continue reading…]

{ 8 comments }

Over the last three seasons, Calvin Johnson has caught 5,137 yards of passes. That’s an incredible amount, and the most by a player over any three-year span in NFL history. That stat by itself isn’t proof of Johnson’s greatness – after all, Detroit has thrown 2,040 passes over the last three years, also the most in any three-year span in football history. But records are not just about greatness: records are a function of era, teammates, and many more elements than pure ability.

So can Calvin Johnson break Jerry Rice’s career receiving yards record? The odds are very long that Johnson will go down in history as a better receiver than Rice, but his odds at breaking his receiving yards record – almost by definition – are a little higher. The man known as Megatron has 9,328 career receiving yards, the third most of any player through his age 28 season. That gives him a 1,462-yard lead on Rice at this age, although Johnson will have to keep up his outstanding pace for a very long time if he wants to capture the record. As the graph below shows, Johnson has had an edge on Rice in career receiving yards through every age of his career to date, but it was Rice’s work in his thirties that separated the GOAT from the pack: [continue reading…]

{ 18 comments }

James Lofton is the Yards Per Catch King

Yesterday, we looked at which quarterbacks were the best at yards per completion after adjusting for league average. Today, we’ll do the same thing for wide receivers and yards per completion.

Lofton tries to hide from the creamsicle uniforms.

Lofton tries to hide from the creamsicle uniforms.

A small tweak is necessary to the formula. You can skip down to the results section if you don’t care about the math, but I suppose most of my readers want to know what goes in the sausage. We can’t just use league-wide yards per completion rates, since that average includes receptions by non-wide receivers. One way around this is to calculate the league average YPC for wide receivers only; that’s easy to do for 2013, but less easy to do for the earlier years of NFL history when the distinction among the positions was not so clear. So, after playing around with a few different methods, I’ve decided to instead use 120% of the league average YPC rate, and give wide receivers credit for their yards over expectation using that inflated number.

For example, in 1983, James Lofton caught 58 passes for 1,300 yards for the Packers, a 22.4 YPC average. That year, the average reception went for 12.63 yards; 120% of that average is 15.2, which means we would give Lofton credit only for his yards over the product of 15.2 and 58, or 879. Since Lofton actually had 1,300 yards, he gets credit for 421 yards over expectation.

The next year, Lofton caught 62 passes for 1,361 yards (22.0). Since the average reception went for 12.66 yards, Lofton gets credit for his yards over (120% * 12.66 * 62), or 942. Lofton therefore is credited with 419 yards over expectation, nearly identical to his performance in the prior year. In fact, those were the 10th and 11th best season in NFL history by this method. [continue reading…]

{ 10 comments }
The core of the Manning era Colts

Presumably the picture that caused the NFL to consider eliminating the Pro Bowl.

Last week, I looked at the top receivers and the quarterbacks who threw it to them. Today, we flip that question around and look at which receivers the top quarterbacks threw to. I used the exact same methodology from the previous post, so please read that for the fine details.

For Peyton Manning, 20% of his career passing yards came via Marvin Harrison, and another 16% came from Reggie Wayne.  Both of those numbers will decline the longer Manning plays, of course, but for now, those players dominate his list (Dallas Clark is third at seven percent). That’s a pretty stark departure from other quarterbacks such as say, I dunno, Tom Brady.  For the Patriots signal caller, Wes Welker is his top man (13%), followed by Deion Branch (9%), Troy Brown (7%), Rob Gronkowski (7%), and then Randy Moss (5%).

The table below lists the top 7 receivers for each of the 200 quarterbacks with the most passing yards since 1960. The list is sorted by the quarterback’s career passing yards, and I have removed the percentage sign from the table to enable proper sorting.  For example, here’s how to read Brett Favre’s line.  He’s the career leader in passing yards, and played from 1992 to 2010.  His top receiver was Donald Driver (9%), followed by Antonio Freeman (9%), Robert Brooks (6%), Sterling Sharpe (5%), Bill Schroeder (5%), Ahman Green (4%), and William Henderson. [continue reading…]

{ 12 comments }

Johnson's target ratio is no joking matter

Johnson's target ratio is no joking matter.

Yards per Route Run, a metric tabulated by Pro Football Focus, is one of my favorite statistics to use to examine wide receiver performance.  To me, it’s the wide receiver version of yards per pass, as it takes production and divides that by opportunity.  However, there are some folks who prefer Yards per Target to YPRR, under the idea that a target is a better way to define an opportunity than a route.

Which view is correct?  Fortunately for our analysis, Yards per Route Run can be broken down into two metrics: Yards per Target and Targets per Route Run.  In other words, YPRR already incorporates Yards per Target, but it adjusts that statistic for Targets Per Route Run.  This makes it very easy for us to compare the two statistics: essentially, the question boils down to how valuable it is to know a receiver’s number of Targets per Route Run.

For example, Kenny Stills had the most extreme breakdown of any player in the NFL in 2013. He was off-the-charts good in yards per target (13.9), but saw targets on just 9% of his routes run last year. As a result, Stills averaged just 1.29 yards per route run, a pretty unimpressive figure.

Steve Johnson was the anti-Stills. While Johnson had the worst year of his career since becoming a Bills starter, he still managed to pull down targets on 25% of his snaps. However, he averaged only 6.3 yards target, leaving Johnson with a poor 1.56 yards per route run average. Of course, when comparing Stills’ numbers to Johnson’s, one might note that Johnson was playing with EJ Manuel and Thaddeus Lewis while Stills was playing with Drew Brees, which provides some explanation for the drastic differences between the two receivers in yards per target. [1]I suppose one counter to that would be that Stills was competing with Jimmy Graham, Marques Colston, and the Saints obsession with throwing passes to running backs, while Johnson was competing with … Continue reading But putting the quarterbacks issue aside, the question today is a more global one.

Since the only difference between YPRR and Y/T is the metric “targets per route run,” it’s worth asking: is Targets Per Route Run a metric worth looking at? Is it more useful than Yards per Target? Well, the word “useful” will mean different things to different people. What I’m curious about is the stickiness of each metric. And there is a pretty clear answer to that question.

Among the three metrics — YPRR, Y/T, and TPRR — it’s Targets Per Route Run that’s the most consistent from year to year. From 2007 to 2012, there were 344 wide receivers who saw at least 40 targets in Year N, and then played for the same team and saw at least 40 targets in Year N+1. [2]While there are some issues with survivorship bias here, I’m not sure (1) how to get around them, and (2) that those concerns bias the results in a way that’s more biased towards one of … Continue reading [continue reading…]

References

References
1 I suppose one counter to that would be that Stills was competing with Jimmy Graham, Marques Colston, and the Saints obsession with throwing passes to running backs, while Johnson was competing with Scott Chandler, Robert Woods, and Fred Jackson for targets.
2 While there are some issues with survivorship bias here, I’m not sure (1) how to get around them, and (2) that those concerns bias the results in a way that’s more biased towards one of the variables we’re examining than the others.
{ 28 comments }

One of my first posts at Football Perspective was one of my favorites: the top receivers and the men who threw it to them. I like referencing that post from time to time, so I decided to update the numbers through the 2013 season.

I looked at all regular season games since 1960 [1]Sorry, Don Hutson., and calculated the percentage of passing yards produced from each quarterback. Then, I assigned that percentage to the number of receiving yards for each receiver. For example, in this Raiders game from 1995, Vince Evans threw for 75% of the Raiders passing yards, and Jeff Hostetler was responsible for the other 25%. Therefore, since Tim Brown gained 161 yards, 121 of those yards are assigned to the “Brown-Evans” pairing and 40 to the “Brown-Hostetler” pairing. Do this for every game since 1960, and you can then assign the percentage of career receiving yards each receiver gained from each quarterback.

For example, 32% of Brown’s yards came from Rich Gannon, 26% from Hostetler, 12% from Jeff George, and 9% from Jay Schroeder. That breakdown isn’t too unique: in fact, of the six receivers with the most receiving yards since 1960, all six (including Brown) gained between 29% and 37% of their career receiving yards from their top quarterback.

The table below lists the top 7 quarterbacks for each receiver, although I only included quarterbacks who were responsible for at least five percentage of the receiver’s yards. It includes the 200 players with the most receiving yards since 1960. [continue reading…]

References

References
1 Sorry, Don Hutson.
{ 16 comments }

Friend-of-the-program Matt Waldman had some thoughts on the topic of wide receiver size, and then asked if I could contribute with some data. Matt posted our joint effort on his Matt’s site, but I’m reproducing it below for the Football Perspective readers. On twitter, some asked if I could do a separate study on wide receivers and weight rather than height. I’ll put that on the to-do list.


Matt Waldman: Stats Ministers and Their Church

I’m a fan of applying analytics to football. Those who do it best possess rigorous statistical training or are disciplined about maintaining limits with its application. Brian Burke wrote that at its core, football analytics is no different than the classic scientific method. Perhaps unsurprisingly, there are some bad scientists out there, who behave more like religious zealots than statisticians. I call them Stats Ministers. They claim objectivity when their methodology and fervor is anything but.

Stats Ministers scoff at the notion that anyone would see value in a wide receiver under a specific height and weight. They love to share how an overwhelming number of receivers above that specific height and weight mark make up the highest production tiers at the history of the position, but that narrow observation doesn’t prove the broader point that among top-tier prospects, taller wide receivers fare better than shorter ones. In fact, what the Stats Ministers ignore is that a disproportionately high number of the biggest busts were above a certain height and weight, too. Having a microphone does not mean one conducted thoughtful analysis: it could also mean one has a bully pulpit where a person with less knowledge and perspective of the subject will look at the correlation and come to the conclusion that it must be so.

However, correlation isn’t causation. Questioning why anyone would like a smaller wide receiver based on larger number of top wide receivers having size is an example of pointing to faulty ‘data backed’ points. Pointing to historical data can only get you so far: it’s not that different than the reasoning that led to Warren Moon going undrafted. That’s an extreme comparison, of course, but the structure of the argument is the same: there were very few black quarterbacks who had experienced any sort of success in the NFL, so why would Moon? Sometimes you have to shift eras to see in a clear light what “correlation isn’t causation” really looks like.

It was overwhelmingly obvious that Moon could play quarterback if you watched him. But if you’re prejudiced by past history rather than open to learning what to study on the field, then it isn’t overwhelmingly obvious. Data can help define the boundaries of risk, but when those wielding the data want to eliminate the search for the exceptional they’ve gone too far. Even as we see players get taller, stronger, and faster, wide receivers under 6’2″, 210 pounds aren’t the exception.

Analytics-minded individuals employed by NFL teams — who have backgrounds in statistics – don’t follow this line of thoughts. Those with whom I spoke acknowledged that there is an effective player archetype of the small, quick receiver. They recognize the large number of size of shorter/smaller receivers who have been impact players in the NFL that make the size argument moot: Isaac Bruce, Derrick Mason, Wes Welker, Marvin Harrison, DeSean Jackson, Torry Holt, Steve Smith, Jerry Rice, Tim Brown, Antonio Brown, Pierre Garcon, Victor Cruz, and Reggie Wayne are just a small sample of players who did not match this 6-2, 210-pound requirement.

This size/weight notion and discussion of “calibration” or what I think they actually mean–reverse regression–is also a classic statistical case of overfitting. There are too many variables and complexities to the game and the position to throw up two data points like height and weight and derive a predictive model on quality talent among receivers. The only fact about big/tall receivers is that they tend to have a large catch radius. Otherwise, there is no factual basis to assume that these players have more talent and skill.

The dangerous thing about this type of thinking is that many of these “Stats Ministers” were trained using perfect data sets in the classroom and their math is reliant on “high fit” equations. When they tackle a real world environment like football they still expect these lessons to help them when it won’t. However, there are plenty of people who are reading and buying into what they’re selling. I showed my argument above to Chase Stuart and asked him to share his thoughts. Here’s his analysis:

Chase Stuart: Analysis of the Big vs. Small WR Question

We should begin by first getting a sense of the distribution of height among wide receivers in the draft. The graph below shows the number of wide receivers selected in the first two rounds of each draft from 1970 to 2013 at each height (in inches):

wr draft ht

The distribution is somewhat like a bell curve, with the peak height being 6’1, and the curve being slightly skewed thereafter towards shorter players (more 6’0 receivers than 6’2, more 5’11 receivers than 6’3, and so on).

Now, let’s look at the number of WRs who have made three Pro Bowls since 1970:

wr pro bowl ht

The most common height for a wide receiver who has made three Pro Bowls since the AFL-NFL merger is 72 inches. And while Harold Jackson is the only wide receiver right at 5’10 to make the list, players at 71 and 69 inches are pretty well represented, too. I suppose it’s easy to forget smaller receivers, so here’s the list of wide receivers 6′0 or shorter with 3 pro bowls:

Mel Gray
Mark Duper
Mark Clayton
Gary Clark
Steve Smith
Wes Welker
Harold Jackson
Charlie Joiner
Cliff Branch
Lynn Swann
Steve Largent
Stanley Morgan
Henry Ellard
Anthony Carter
Anthony Miller
Paul Warfield
Drew Pearson
Wes Chandler
Irving Fryar
Tim Brown
Sterling Sharpe
Isaac Bruce
Rod Smith
Marvin Harrison
Hines Ward
Donald Driver
Torry Holt
Reggie Wayne
DeSean Jackson

Recent history

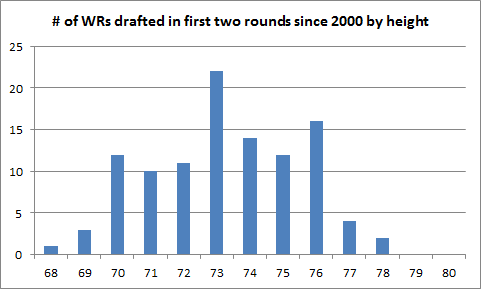
Now, let’s turn to players drafted since 2000. This next graph shows how many wide receivers were selected in the first two rounds of drafts from ’00 to ’13, based on height:

As you can see, the draft is skewing towards taller wide receivers in recent years. Part of that is because nearly all positions are getting bigger and taller (and faster), but the real question concerns whether this trend is overvaluing tall wide receivers.

It’s too early to grade receivers from the 2012 or 2013 classes, so let’s look at all receivers drafted in the first round between 2000 and 2011. There were 21 receivers drafted who were 6’3 or taller, compared to just 14 receivers drafted who stood six feet tall or shorter. On average, these taller receivers were drafted with the 13th pick in the draft, while the set of short receivers were selected, on average, with the 21st pick.

So we would expect the taller receivers to be better players, since they were drafted eight spots higher. But that wasn’t really the case. Both sets of players produced nearly identical receiving yards averages:

TypeRookieYear 2Year 3
Short535669709
Tall567676720

Taller wide receivers have fared ever so slightly better than shorter receivers. But once you factor in draft position, that edge disappears. If you look at the ten highest drafted “short” receivers, they still were drafted later (on average, 17th overall) than the average “tall” receiver. But their three-year receiving yards line is better, reading 563-694-790. In other words, I don’t see evidence to indicate that shorter receivers, once taking draft position into account, are worse than taller receivers. If anything, the evidence points the other way, suggesting that talent evaluators are more comfortable “reaching” for a taller player who isn’t quite as good. Players like Santana Moss, Lee Evans, Percy Harvin, and Jeremy Maclin were very productive shorter picks; for some reason, it’s easy for some folks to forget the success of those shorter receivers, and also forget the failures of taller players like Charles Rogers, Mike Williams, Jonathan Baldwin, Sylvester Morris, David Terrell, Michael Jenkins, Reggie Williams, and Matt Jones.

But that’s just one way of answering the question. What I did next was run a regression using draft value using the values from my Draft Value Chart and height to predict success. If the draft was truly efficient — i.e., if height was properly being incorporated into a player’s draft position–then adding height to the regression would be useless. But if height was being improperly valued by NFL decision makers, the regression would tell us that, too.

To measure success, I used True Receiving Yards by players in their first five seasons. I jointly developed True Receiving Yards with Neil Paine (now of 538 fame), and you can read the background about it here and here.

The basic explanation is that TRY adjusts receiver numbers for era and combines receptions, receiving yards, and receiving touchdowns into one number, and adjusts for the volume of each team’s passing attack. The end result is one number that looks like receiving yards: Antonio Brown, AJ Green, Josh Gordon, Calvin Johnson, Anquan Boldin, and Demaryius Thomas all had between 1100 and 1200 TRY last year.

First, I had to isolate a sample of receivers to analyze. I decided to take 20 years of NFL drafts, looking at all players drafted between 1990 and 2009 who played in an NFL game, and their number of TRYs in their first five seasons. (Note: As will become clear at the end of this post, I have little reason to think this is an issue. But technically, I should note that I am only looking at drafted wide receivers who actually played in an NFL game. So if, for example, height is disproportionately linked to players who are drafted but fail to make it to an NFL game, that would be important to know but would be ignored in this analysis.)

To give you a sense of what type of players TRY likes, here are the top 10 leaders (in order) in True Receiving Yards accumulated during their first five seasons among players drafted between 1990 and 2009:

Randy Moss
Torry Holt
Marvin Harrison
Larry Fitzgerald
Chad Johnson
Calvin Johnson
Keyshawn Johnson
Anquan Boldin
Herman Moore
Andre Johnson

First, I ran a regression using Draft Pick Value as my sole input and True Receiving Yards as my output. The best-fit formula was:

TRY through five years = 348 + 131.3 * Draft Pick Value

That doesn’t mean much in the abstract, so let’s use an example. Keyshawn Johnson was the first pick in the draft, which gives him a draft value of 34.6. This formula projected Johnson to have 4,890 TRY through five years. In reality, he had 4,838. The R^2 in the regression was 0.60, which is pretty strong: It means draft pick is pretty strongly tied to wide receiver production, a sign that the market is pretty efficient.

Then I re-ran the formula using draft pick value *and* height as my inputs. As it turns out, the height variable was completely meaningless. The R^2 remained at 0.60, and the coefficient on the height variable was not close to significant (p=0.53) despite a large sample of 543 players.

In other words, NFL GMs were properly valuing height in the draft during this period.

In case you’re curious, the 15 biggest “overachievers” as far as TRY relative to draft position were, in order: Marques Colston, Santana Moss, Brandon Marshall, Darrell Jackson, Terrell Owens, Anquan Boldin, Antonio Freeman, Chad Johnson, Coles, Mike Wallace, Greg Jennings, Chris Chambers, Marvin Harrison, Hines Ward, and Steve Johnson.

In this sample, about 50% of the players were taller than 6-0, and only about 30% of the receivers were 5-11 or shorter. We shouldn’t necessarily expect to see a bunch of short overachievers, but I’m convinced that height was properly valued by NFL teams in the draft at least over this 20-year period. There may be fewer star receivers who are short, but that’s only because there are fewer star receiver prospects who are short. Once an NFL team puts a high grade on a short prospect, that’s pretty much all we need to know.

Of the 33 players drafted in the top 15, just one-third of them were six feet or shorter. As a group, there were a couple of big overachievers (Torry Holt, Lee Evans), some other players who did very well (Joey Galloway, Terry Glenn, and Donte Stallworth), and a few big busts (Desmond Howard, Ted Ginn, Troy Edwards, and Peter Warrick). Ike Hilliard and Mike Pritchard round out the group. But I see nothing to indicate that short receivers who are highly drafted do any worse than tall receivers who are highly drafted. It’s just that usually, the taller receiver is drafted earlier.
wr draft 2000 2013 ht

Waldman: Why the Exceptional is Valuable

Chase’s analysis echoes what I have heard from those with NFL analytics backgrounds: There are too many variables to consider with raw stats to indicate that big receivers are inherently better than small receivers and there are viable archetypes of the effective small receiver.

What concerns me about the attempts to pigeonhole player evaluation into narrower physical parameters is that if taken too far one might as well replace the word “talent” in the phrase “talent evaluation” and use “athletic” or “physical” in its place. I may be wrong, but I get the sense that some of these Stats Ministers–intentionally or otherwise–dislike the exceptional when it comes to human nature. They’re seeking a way to make scouting a plain of square holes where the square pegs fit neatly into each place.

The problem with this philosophy is that once a concept, strategy, or view becomes the “right way” it evolves into the standard convention. Once it becomes conventional, it’s considered “safe.” However this is not true in the arena of competition. If you’re seeking the conventional, you’ve limited the possibilities of finding and creating environments for the exceptional to grow.

Many players who didn’t match the ideal size for their positions and had success were difference makers on winning teams–often Super Bowl Champions. I’d argue that exceptions to the rule that succeed are often drivers of excellence:

  • Russell Wilson didn’t meet the faulty “data backed” physical prototypes for quarterback and picking this exception to the rule in the third round earned them exceptional savings to acquire or keep other players for a Super Bowl run.
  • Rod Smith was too short, too slow, a rookie at 25, and not even drafted. But like a lot of his peers I mentioned above, his production was a huge factor for his team becoming a contender. The fact he was the exception to the rule freed Denver to acquire other pieces to the puzzle.
  • Joe Montana was too small, threw a wobbly ball, and was a third-round pick who was more of a point guard than full-fledged pocket passer, but he was just the type of player Bill Walsh was seeking in an offense that changed the entire course of the game. But at the time, the west coast offense was the exception to the rule that turned the league upside down.
  • Buddy Ryan and the Bears drafted a bunch of defenders that didn’t meet physical prototypes for traditional roles in a 4-3, but the 46 defense took Chicago to Super Bowl dominance.
  • Drew Brees, Darren Sproles, and Marques Colston were exceptions to the rule. The Saints offense has been the driver for this team’s playoff and Super Bowl appearances.

I could name more, but the point isn’t to list every player. Why should I? Players who become top starters in the NFL are by very definition the exception to the rule. The only thing height gives a wide receiver is potential position on a target due to wing span, but it doesn’t help hand-eye coordination, body position, route running, comfort with physical contact, and understanding of a defense.

There are also smaller players with good arm length, leaping ability, quickness, and strength to earn similar, if not better position on a target. Even when the smaller receivers lack the same caliber of physical measurements as the bigger players, if they possess all of the other traits of a good receiver that these big athletes lack then size doesn’t matter.

There are legitimate archetypes for smaller, quick receivers with change of direction. However, there are social biases with these correlations that filter out players from the earliest stages of the game. These biases include the idea that the vast majority of these types of players are in the highest levels of football so anything different should be discouraged at the high school and college level–think white wide receivers, running backs, and cornerbacks as examples.

Players who succeed in defying these social biases and also possess the skill and persistence to overcome them. I’ve shown this video before, but physicist Neil deGrasse Tyson makes a strong point against “data backed” arguments of this nature when he answered a question posed about the small number of female and black scientists in the world. Harvard President Lawrence Summers hazarded a guess that it was genetics. Tyson’s answer is a great example why correlation isn’t causation.

The greatest irony about this specific crowd of data zealots is that they are often the first to complain about coaching tendencies that have same biases.

Maybe rookie receivers with the dimensions of Paul Richardson – or for that matter Jeremy Gallon or Odell Beckham – don’t become productive fantasy options or football players as often as bigger players based on correlating data. However, pointing to past history and scoffing at the wisdom of making an investment is like stating that it was a fact in the 15th century that dragons lie at the edge of the flat world we live in.

If you’re going to avoid investing in a player–or encourage others to do so–use good reasoning. Looking at the data is helpful, but the NFL isn’t a perfect data set. There are some data analysts writing about football that derive ideas reliant on a lot of highly fit equations that don’t work in a real world situation. However, they expect perfection and it’s not going to happen. They also behave as if data only tells the truth–and when that data lacks a fit, context, or proper application, it’s a little scary.

I want to see analytics succeed in the NFL, but like film study it’s not the answer. These two areas–when executed well–can contribute to the answer. However, the NFL–beyond some individual cases–hasn’t made significant advances in either area.

I suppose when you have a monopoly in the marketplace combined with a socialistic system for spreading the wealth owners don’t have significant motivation to become innovative with player evaluation. If they did, they’d be spending more money on making these processes rather than cycling through coaches and GMs every 3-5 years.

{ 20 comments }

Gordon smoked the defensive back on this play

Gordon smoked the defensive back on this play.

Josh Gordon led the league with 1,646 receiving yards last year. That’s impressive: perhaps even more impressive is that he did it on “only” 159 targets, meaning he averaged 10.35 yards per target. [1]That’s the most of any receiver with over 130 targets. It’s the second most among players with 100 targets, behind DeSean Jackson‘s 10.6 average on 126 targets. It’s the … Continue reading But the most impressive part, of course, was that he did it for the Browns. You know, the Browns, quarterbacked by a three-headed monster of Jason Campbell, Brandon Weeden, and Brian Hoyer, each of whom managed to average a around the same mediocre 6.4 yards per attempt.

Here’s another way to think of it. While Jordan Cameron was somewhat efficient (7.7 yards per target), the other three Browns to finish in the top five in Cleveland targets were Greg Little (4.7 yards per target), Chris Ogbonnaya (4.6), and Davone Bess (4.2!). And here’s yet another way to think of it: the Browns threw 681 passes last year and gained 4,372 passing yards. But 1,646 of those yards came on the 159 passes intended for Gordon. Remove those plays, and Cleveland averaged just 5.22 yards per pass attempt on passes to all other Browns last year.

That means Cleveland averaged 5.13 more yards per target on passes to Gordon in 2013 than on passes to everyone else. That’s insane, particularly over 159 targets. How insane? If we multiply those two numbers, we get a “value relative to teammates” metric: Gordon gained 816 more yards on his targets than the other Browns averaged per target. Now, in the abstract, maybe 816 doesn’t mean much to you. But it’s the most of any player since at least 1999. The table below shows the top 75 wide receivers in value relative to teammates: the columns should be self-explanatory, and the “ROT Y/A” shows the yards per attempt on passes to the rest of the team. As always, it’s fully sortable and searchable; by default, it displays only the top 25 receivers, but you can switch that by clicking on the dropdown box to the left. [continue reading…]

References

References
1 That’s the most of any receiver with over 130 targets. It’s the second most among players with 100 targets, behind DeSean Jackson‘s 10.6 average on 126 targets. It’s the third most among players with more than 60 targets, behind Jackson and Doug Baldwin (10.7, 73). And it’s the fourth most among players with at least 40 targets, behind Jackson, Baldwin, and Kenny Stills (12.8, 50).
{ 5 comments }

Analyzing the leaders in targets in 2013

Comparing wide receivers across teams is tricky. Pierre Garcon led the NFL in targets, [1]All target data comes courtesy of Footballguys.com. but that’s partially because Washington didn’t have much help at wide receiver. [2]And in the offseason, Washington signed DeSean Jackson and Andre Roberts Vincent Jackson was 2nd in percentage of team targets (we’ll get to who was first in a few minutes) for a similar reason: Jackson is a very good receiver, but Tampa Bay had limited weapons in 2014. [3]And in the 2014 NFL Draft, the Bucs added Texas A&M wide receiver Mike Evans and Washington tight end Austin Seferian-Jenkins. At least in theory, the high target numbers for Garcon and Jackson should be considered in light of the fact that both teams had below-average passing offenses.

The flip side of that coin is a player like Demaryius Thomas. In 2012, while “competing” with another very good receiver in Eric Decker, Thomas saw 24.2% of Denver targets.  Last year, with the addition of Wes Welker and a breakout season from Julius Thomas, Thomas saw just 21.2% of Broncos targets. But the team’s passing game was better, so arguably Thomas should receive a “bump” in his target percentage because he played for a great offense.

That’s just in theory. The unspoken elephant in the analysis is the quarterback. It’s not just a player’s supporting cast of weapons that determines whether his team has a good or bad passing attack: Thomas obviously benefited greatly from playing with Peyton Manning, too. Regular readers may recall that last year, for each team’s leader in targets, I compared their target percentage (defined as targets divided by all team targets) to their team’s passing efficiency (defined by Adjusted Net Yards per Attempt). I thought it would be fun to perform the analysis again, even if it may make more sense in theory than in practice. Take a look: the Y-axis shows percentage of team targets, and the X-axis respects Team ANY/A. In theory, the best WR1s should be up and to the right, with the worst WR1s (or tight ends masquerading as WR1s) in the bottom left corner of the chart.

[continue reading…]

References

References
1 All target data comes courtesy of Footballguys.com.
2 And in the offseason, Washington signed DeSean Jackson and Andre Roberts
3 And in the 2014 NFL Draft, the Bucs added Texas A&M wide receiver Mike Evans and Washington tight end Austin Seferian-Jenkins.
{ 7 comments }

Over the last three years, Calvin Johnson has 5,137 receiving yards in 46 games.  That’s an average of 111.7 receiving yards per game, the most by any player over a three-year stretch in NFL history.  That mark comes with a bit of an asterisk, of course, as the Lions have attempted 2,040 passes since the start of the 2011 season, also an NFL record; that’s why I like using True Receiving Yards and various other WR Ranking Systems rather than just raw receiving yards.

But hey, trivia is trivia, and Johnson is the current record holder.  But prior to 2013, do you know who held the record for receiving yards per game over a three-year stretch? The answer is not Jerry Rice, or else this would be a really lame trivia question.  Rice averaged 101.0 receiving yards per game from 1993 to 1995, and is one of just three players to average over 100 receiving yards per game for a three-year stretch.  Megatron also averaged 101.4 receiving yards per game from 2010 to 2012, but he only became the 3-year king after the conclusion of the 2013 season.

Trivia hint 1 Show


Trivia hint 2 Show


Trivia hint 3 Show


Click 'Show' for the Answer Show


I suspect you’ll also be surprised to see who would is number 4 on the list of most receiving yards per game over a three-year span (counting each player only once, of course).

Trivia hint 1 Show


Trivia hint 2 Show


Trivia hint 3 Show


Click 'Show' for the Answer Show
[continue reading…]

{ 7 comments }

Green is poised for another monster year

Green is poised for another monster year.

Last year, at Footballguys.com, I looked at the best starting point for wide receiver projections. Well, I’ve re-run the numbers and come up with the best starting point for wide receiver projections in 2014.

The general philosophy is that receiving yards can be re-written using the following formula:

Receiving yards = (Receiving Yards/Target) x (Targets/Team_Pass_Att) x Team_Pass_Att.

Since each of those variables regress to the mean in different ways, we can get a more accurate projection of future receiving yards by projecting each of those three variables than by simply looking at past receiving yards. For example, here are the best fit formulas for each of those metrics:

Future Pass Attempts = 36 + (450 x Pass_Attempts/Play) + (0.255 x Offensive Plays)

Future Percentage of Targets = 6.2% + 71.3% x Past Percentage of Targets

Future Yards/Target = 5.5 + 0.29 x Past Yards/Targets

If you take a look at the three coefficients, the number of offensive plays run from year to year and the yards per target averages are not very sticky; both have coefficients of less than 0.3, which indicates a significant amount of regression to the mean. Meanwhile, percentage of targets is much, much sticker, at 71%. [1]Pass attempts per play can’t be analyzed the same way, at least using the formulas presented here, but it does look as though the pass-heaviness of an offense is moderately sticky, too. And … Continue reading

As a result, this regression really likes players like A.J. Green (5th in receiving yards in 2013, projected to be 1st in 2014), Andre Johnson (7th, 2nd) and Vincent Jackson (14th, 6th). To find out who else this metric likes and dislikes, and for a more thorough analysis, you can read the full article here.

References

References
1 Pass attempts per play can’t be analyzed the same way, at least using the formulas presented here, but it does look as though the pass-heaviness of an offense is moderately sticky, too. And that would be even more true if we accounted for game scripts, I suppose.
{ 0 comments }

Turnover Among Targets, Part II

Yesterday, I looked at team turnover in the passing game for every team in 2013. You can review the pretty complicated [1]While I admit to it being complicated, I think the added value in accuracy is worth the added layer of complexity; frankly, I can’t think of a simple way to calculate turnover that really … Continue reading formula in that post, but the short version is to give each player credit for the lower of two values: his percentage of team receiving yards in Year N and his percentage of team yards in Year N-1. Today, I use that same concept to analyze team passing for every year since the merger.

And the team with the greatest receiving turnover in NFL history (even including pre-1970 teams) is the 1989 Detroit Lions. Take a look at the players who caught passes for Detroit in 1988:

Receiving
No. Age Pos G GS Rec Yds Y/R TD Y/G
82 Pete Mandley 27 PR/WR 15 14 44 617 14.0 4 41.1
33 Garry James 25 RB 16 16 39 382 9.8 2 23.9
80 Carl Bland 27 wr 16 2 21 307 14.6 2 19.2
89 Jeff Chadwick 28 WR 10 8 20 304 15.2 3 30.4
83 Gary Lee 23 KR/wr 14 6 22 261 11.9 1 18.6
30 James Jones 27 FB 14 14 29 259 8.9 0 18.5
87 Pat Carter 22 TE 15 14 13 145 11.2 0 9.7
49 Tony Paige 26 rb 16 2 11 100 9.1 0 6.3
81 Stephen Starring 27 6 0 5 89 17.8 0 14.8
38 Scott Williams 26 11 0 3 46 15.3 0 4.2
81 Mark Lewis 27 te 3 3 3 32 10.7 1 10.7
41 Paco Craig 23 8 0 2 29 14.5 0 3.6
26 Carl Painter 24 12 0 1 1 1.0 0 0.1
Team Total 26.2 16 213 2572 12.1 13 160.8

[continue reading…]

References

References
1 While I admit to it being complicated, I think the added value in accuracy is worth the added layer of complexity; frankly, I can’t think of a simple way to calculate turnover that really captures what analysts value.
{ 11529 comments }

Turnover Among Targets, Part I

Cam may need to really be Superman in 2014

Cam may need to really be Superman in 2014.

The Carolina Panthers have experienced a lot of turnover this offseason. Steve Smith (Baltimore), Ted Ginn (Arizona), Domenik Hixon (Chicago), and Brandon LaFell (New England) are all gone. Those four players were the only wide receivers to catch a pass for Carolina in 2013, and they accounted for 59% of the Panthers receiving yards. last year. What does this mean for Cam Newton? Last August, a couple of star quarterbacks appeared to be going through some similarly significant turnover among their targets.

Tom Brady lost four of his top five targets from 2012 and the fifth was Rob Gronkowski; in retrospect, most people underestimated how big of an impact this would have on Brady’s numbers. Meanwhile, Ben Roethlisberger’s receivers were a big question mark entering the season, but a monster year from Antonio Brown prevented Roethlisberger’s numbers from tanking. As it turned out, Roethlisberger didn’t wind up having much turnover, but the quarterback who experienced the second-most turnover wound up winning the Comeback Player of the Year award.

For Carolina, I think some of the departures have been overblown. The defense should again be one of the best in the NFL, and it’s not as though the passing game was outstanding last year. Greg Olsen led the team in receptions, receiving yards, and receiving touchdowns last year, and he’ll be back in 2014. In addition, the Panthers averaged 7.4 yards per attempt on passes to Greg Olsen last year and 7.1 yards per attempt (the league average) on passes to all other players. Carolina signed Jerricho Cotchery, Jason Avant, Tiquan Underwood, and Joe Webb, should draft a receiver or two in May, and has a potential sleeper in Marvin McNutt. I think they’ll be just fine, mostly because that’s all the passing game was last year.

Since it’s still a bit early to figure out exactly how the Panthers passing game will look in 2014, I thought we could use some time this weekend to review some history. Which teams have experienced the most turnover among their targets? And how do we even measure such a thing? [continue reading…]

{ 2 comments }
Next Posts Previous Posts