
I’ve published the Game Scripts data from every game this year at the 2014 Game Scripts page, available here. What would it look like if we plotted Game Script score (on the X-Axis) against Pass Ratio (on the Y-Axis) for every game this year? Something like this:

As you move from a more negative Game Script to a more positive one, the expected Pass Ratio decreases. But the relationship is not purely linear: in extreme cases, the Pass Ratios tend to move a bit more towards league average, and I think that trend is probably even stronger than it might appear on this graph. In any event, you can derive a best-fit polynomial equation from that data, which could give us an expected Pass Ratio.
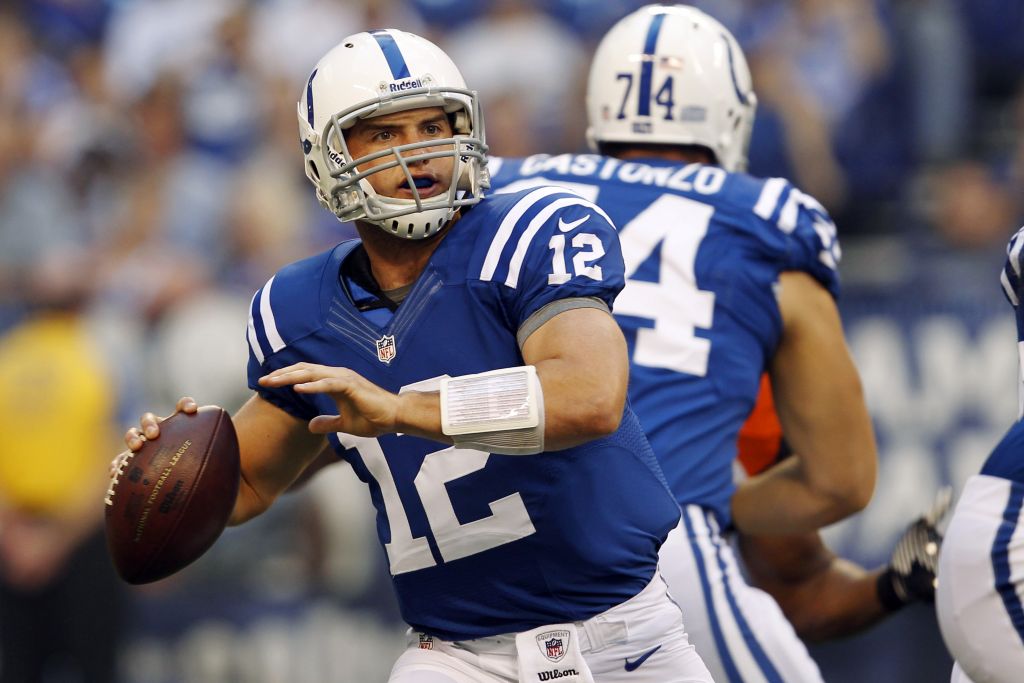
Luck’s Colts have been very pass-heavy in 2014
If we perform that calculation for every game this year, we can derive season grades. Let’s look at the Colts line in the table below. In 7 games this year, Indianapolis has an average Game Script of +7.9, which happens to be the highest in the NFL (the table is fully sortable). Based on how each game has unfolded, Indianapolis would be expected to pass on just 52.7% of all plays if it was an average team; however, the Colts have passed on 59.4% of all plays. That means the Colts have passed 6.7% above expectation, the second highest rate in the NFL this year. The table below lists that data for each team through week 7:
| Rk | Team | G | Avg GS | Exp | Act | Diff |
|---|---|---|---|---|---|---|
| 1 | NOR | 6 | -0.1 | 58.4% | 65.5% | 7.0% |
| 2 | IND | 7 | 7.9 | 52.7% | 59.4% | 6.7% |
| 3 | ATL | 7 | -0.4 | 60.7% | 66.5% | 5.8% |
| 4 | CHI | 7 | -1.1 | 59.5% | 64.8% | 5.4% |
| 5 | DEN | 6 | 7.0 | 53.3% | 58.6% | 5.3% |
| 6 | DET | 7 | 4.1 | 55.4% | 59.9% | 4.4% |
| 7 | PHI | 6 | 3.6 | 56.1% | 60.5% | 4.3% |
| 8 | JAX | 7 | -5.2 | 61.9% | 65.8% | 4.0% |
| 9 | OAK | 6 | -6.3 | 63.1% | 66.3% | 3.2% |
| 10 | NWE | 7 | 3.3 | 55.9% | 58.7% | 2.8% |
| 11 | WAS | 7 | -1.5 | 59.8% | 62.5% | 2.7% |
| 12 | TAM | 6 | -11.4 | 62.4% | 64.3% | 1.9% |
| 13 | GNB | 7 | 5.5 | 55.5% | 56.9% | 1.4% |
| 14 | PIT | 7 | 0.0 | 58.5% | 59.4% | 0.9% |
| 15 | SDG | 7 | 5.9 | 54.4% | 55.1% | 0.7% |
| 16 | CAR | 7 | -5.1 | 61.6% | 61.9% | 0.3% |
| 17 | BUF | 7 | -2.1 | 60.3% | 60.7% | 0.3% |
| 18 | MIA | 6 | 1.1 | 57.9% | 58.1% | 0.2% |
| 19 | ARI | 6 | 0.9 | 58% | 58.1% | 0.1% |
| 20 | STL | 6 | -1.5 | 59.6% | 59.6% | 0.0% |
| 21 | BAL | 7 | 6.7 | 54.6% | 54.6% | 0.0% |
| 22 | CIN | 6 | 1.0 | 57.6% | 56.6% | -1.0% |
| 23 | TEN | 7 | -2.9 | 60.5% | 59.1% | -1.4% |
| 24 | MIN | 7 | -4.8 | 61.2% | 58% | -3.3% |
| 25 | SEA | 6 | 1.5 | 57.4% | 54.1% | -3.3% |
| 26 | SFO | 7 | 0.3 | 58.2% | 54.4% | -3.8% |
| 27 | KAN | 6 | 0.8 | 58.1% | 52.9% | -5.2% |
| 28 | NYJ | 7 | -5.4 | 62.2% | 56.9% | -5.3% |
| 29 | NYG | 7 | -2.4 | 60.2% | 54.1% | -6.0% |
| 30 | CLE | 6 | -0.4 | 59% | 50.5% | -8.5% |
| 31 | DAL | 7 | 0.6 | 57.8% | 49.1% | -8.7% |
| 32 | HOU | 7 | -0.2 | 58.8% | 48.9% | -9.9% |
- On the legs of DeMarco Murray, the Cowboys have been very run-heavy this year. But Dallas hasn’t even been the most run-heavy team in Texas; that honor belongs to Arian Foster and the Houston Texans.
- Dallas, despite the gaudy 6-1 record, is just barely above average when it comes to Game Script. A -17.5 in week 1 is still skewing things for the Cowboys, and the -5.6 posted in the comeback win against the Rams two weeks later doesn’t help things much, either.
- Both New York teams are among the five most run-heavy teams in the NFL. The Giants are a bit tougher to understand: New York has invested significantly in the passing game, but is focused on being a run-heavy team. Cleveland checks in as the 3rd most run-heavy team in the NFL so far this year, which jives with what I’ve seen watching the games.
We can also run the same numbers but look at the defenses To the surprise of none of our regular readers, the Jets are the defense that teams are least likely to run against (and, conversely, most likely to throw against). Opponents against the Jets have an average Game Script of +5.4; that would make you think they would throw on only 54.8% of all pass plays, but in fact, Jets opponents have passed on 61.6% of all plays. Teams pass 6.9% more often than they “should” if New York was equally strong against both the run and the pass. Alas, we know that is not the case.
| Rk | Team | G | Avg GS | Exp | Act | Diff |
|---|---|---|---|---|---|---|
| 1 | NYJ | 7 | 5.4 | 54.8% | 61.6% | 6.9% |
| 2 | SFO | 7 | -0.3 | 58.7% | 64% | 5.2% |
| 3 | JAX | 7 | 5.2 | 55% | 59.3% | 4.3% |
| 4 | DEN | 6 | -7 | 63.6% | 67.5% | 4% |
| 5 | BUF | 7 | 2.1 | 57% | 60.8% | 3.8% |
| 6 | CAR | 7 | 5.1 | 55.2% | 58.9% | 3.6% |
| 7 | ARI | 6 | -0.9 | 59.4% | 62.7% | 3.3% |
| 8 | DET | 7 | -4.1 | 61.7% | 64% | 2.2% |
| 9 | BAL | 7 | -6.7 | 61.8% | 63.5% | 1.7% |
| 10 | MIN | 7 | 4.8 | 55.4% | 57.1% | 1.7% |
| 11 | MIA | 6 | -1.1 | 59.2% | 60.9% | 1.6% |
| 12 | HOU | 7 | 0.2 | 58.3% | 59.7% | 1.5% |
| 13 | CIN | 6 | -1 | 59.2% | 60.5% | 1.3% |
| 14 | TAM | 6 | 11.4 | 53.2% | 54.4% | 1.1% |
| 15 | DAL | 7 | -0.6 | 59.1% | 59.9% | 0.7% |
| 16 | KAN | 6 | -0.8 | 59% | 59.7% | 0.7% |
| 17 | CHI | 7 | 1.1 | 57.8% | 58.2% | 0.5% |
| 18 | NOR | 6 | 0.1 | 58.7% | 59.2% | 0.4% |
| 19 | IND | 7 | -7.9 | 63.9% | 63.9% | 0% |
| 20 | WAS | 7 | 1.5 | 57.2% | 56.9% | -0.3% |
| 21 | PIT | 7 | 0 | 58.7% | 58.2% | -0.6% |
| 22 | NYG | 7 | 2.4 | 56.7% | 56.1% | -0.7% |
| 23 | TEN | 7 | 2.9 | 56.5% | 54.6% | -1.9% |
| 24 | SEA | 6 | -1.5 | 59.8% | 57.8% | -2% |
| 25 | SDG | 7 | -5.9 | 62.6% | 60.5% | -2.1% |
| 26 | PHI | 6 | -3.6 | 60.8% | 58.4% | -2.4% |
| 27 | CLE | 6 | 0.4 | 58.2% | 55.1% | -3.1% |
| 28 | NWE | 7 | -3.3 | 61.1% | 56.2% | -4.8% |
| 29 | ATL | 7 | 0.4 | 55.6% | 50.7% | -4.9% |
| 30 | GNB | 7 | -5.5 | 61% | 53.4% | -7.6% |
| 31 | STL | 6 | 1.5 | 57.5% | 49.8% | -7.8% |
| 32 | OAK | 6 | 6.3 | 53.9% | 46.1% | -7.8% |
On the other hand, teams really like running against Green Bay, St. Louis, and Oakland. The Raiders are not only a team that tends to have negative Game Scripts, but Oakland’s run defense is really bad, too. That’s a recipe for roughly a zillion carries for opposing backs. Oakland has allowed 217 opposing rush attempts this year, the most of any team through six games since 2010.
What stands out to you in these tables? Leave your thoughts in the comments.