≡ Menu

Last year, I introduced the first edition of the College Football SRS Ratings after five weeks.  And while it’s too early to put too much weight on these ratings, they help to at least begin framing the discussion of which are the most impressive teams in college football.  As a reminder, here is the methodology:

1) For each game not played at a neutral site, 3 points are given to the road team. After that adjustment, all wins and losses of between 7 and 24 points are recorded exactly as such. This means that a 24-10 road win goes down as +17 for the road team, -17 for the home team.

2) With one exception, wins of 7 or fewer points are scored as 7-point wins and losses of 7 or fewer points are scored as 7 point losses. So a 4-point home win goes down as +7 (and not a 1) and a 1-point home loss is a -7 (and not a -4). The one exception is that road losses of 3 or fewer (and home wins of 3 or fewer) are graded as ties. So a 21-20 home victory goes down as a 0 for both teams.

3) Wins/Losses of more than 24 points are scored as the average between the actual number and 24. This is to avoid giving undue credit to teams that run up the score. So a 75-point home win goes down as a 48-point win.

Once we have a rating for each team in each game, we then adjust each result for strength of schedule. This is an iterative process, where we adjust the ratings hundreds of times (to adjust for SOS, you have to adjust for the SOS of each opponent, and the SOS of each opponent’s opponent, and so on.) in Excel. Then we produce final ratings, where the SRS rating is the sum of the Margin of Victory and Strength of Schedule in every week.

After five weeks, what are the results? As usual, the table is fully searchable (type “-0” for example, to see a list of undefeated teams, SEC to see all SEC teams, or ACC-Coas if you really want to see how the ACC Coastal is doing). Right now, the number one team is Alabama.  Despite the Crimson Tide already having one loss, Bama has an average (adjusted) Margin of Victory of 17.6 points per game against an average opponent that is 39.9 points better than average (average includes all football teams at all levels, so all FBS teams will have a positive grade). Below are the ratings for all 128 FBS teams. [continue reading…]

{ 2 comments }

On Monday, I looked at the SOS-adjusted Adjusted Net Yards per Attempt ratings of every quarterback and defense in the NFL in 2014. And just like last year, I want to follow that post by looking at the best and worst games of the year, from the perspectives of both the quarterbacks and the defenses.

Let’s start with the top 100 passing games from 2014. The top spot belongs to Ben Roethlisberger, for his scorched-earth performance against Indianapolis. The Steelers star threw for 522 yards and 6 touchdowns on just 49 pass attempts with no sacks or interceptions. For the game, that means Roethlisberger averaged 13.10 ANY/A. The league-average last season was 6.13 ANY/A, which means Roethlisberger was 6.97 ANY/A above average. Now since the game came against a Colts team that was 0.28 ANY/A worse than average last year, we have to reduce that by the same number. That puts Roethlisberger at 6.70 ANY/A above expectation; multiply that by his 49 dropbacks, and he produced 328 adjusted net yards of value above average after adjusting for strength of schedule. That was easily the top game of 2014. [continue reading…]

{ 2 comments }

Data Dump: Defensive Points Allowed SRS

Today’s guest post/contest comes from Thomas McDermott, a licensed land surveyor in the State of California, a music theory instructor at Loyola Marymount University, and an NFL history enthusiast. As always, we thank him for his hard work.


In a previous post, I provided SRS-style ratings for all offenses since 1970, using only points scored by the actual offense (including field goals). Today, I’ll do the same thing for defenses – meaning, of course, our “metric” will be points allowed only by the actual defense. [1]To quickly recap: SRS ratings for offense (OSRS) and defense (DSRS) on PFR’s website include points scored by the defense and special teams. To get a more accurate points-based evaluation of … Continue reading

Here’s how to read the table below: in 1970, the Vikings allowed 10.2 points per game, 8.2 of which came from touchdowns and field goals allowed by the defense. This leaves 2.0 PPG scored by their opponent’s defense or special teams (i.e., due to Minnesota’s offense or special teams). [2]In this case, it was the result of three touchdowns off of offensive turnovers and one on special teams, as highlighted by Chase in this post on estimated points allowed per drive. Their 8.2 Def PA/G was 9.5 points better than league average; after adjusting for strength of opponent, their rating remains at 9.5. Their overall points allowed SRS rating (DSRS) is 9.2, meaning PFR’s defensive SRS rating undersells them by 0.3 points. [continue reading…]

References

References
1 To quickly recap: SRS ratings for offense (OSRS) and defense (DSRS) on PFR’s website include points scored by the defense and special teams. To get a more accurate points-based evaluation of offenses and defenses, I weeded these scores out and reran the iterations. I didn’t note this last time, but for those interested: the numbers used do not include any home field advantage adjustment or a cap on blowout point differentials.
2 In this case, it was the result of three touchdowns off of offensive turnovers and one on special teams, as highlighted by Chase in this post on estimated points allowed per drive.
{ 9 comments }

At the start of the new season, every team has hope. Well, just about every team. And that made me wonder: how did Super Bowl champions look in the year before winning the Super Bowl?

The Jets were at -5.0 in the SRS last year: has any team ever been that bad (or worse) and won the Super Bowl the next season? Why yes, one — and only one — team has. The graph below shows the SRS ratings of each Super Bowl champion in the year before they won the Super Bowl. Note that I’m still using the Super Bowl year in the graph below, so if you go to 1972, you’ll see the 1971 Dolphins’ SRS. [continue reading…]

{ 2 comments }

Today’s guest post/contest comes from Thomas McDermott, a licensed land surveyor in the State of California, a music theory instructor at Loyola Marymount University, and an NFL history enthusiast. As always, we thank him for his hard work.


When looking at teams’ offensive SRS ratings (OSRS) on PFR, we know that those number also include points scored by the defense and special teams – punt and kick return touchdowns, interception and fumble return touchdowns, return scores on blocked punts and field goals, and safeties. This makes OSRS not as accurate a point-based rating of the offense “proper” as it could be. But, considering those “non-offense” types of scores make up a small fraction of a team’s overall points scored in a season (the average is around 8% since 1970), we can generally ignore this “hiccup” in the system.

Well, most of us can ignore it; for some reason, I cannot! My curiosity has gotten the better of me, so I decided to run offensive and defensive SRS ratings for each team since the merger, using only points that we would normally credit the offense for scoring (or the defense for allowing) – passing and rushing touchdowns, and field goals. [1]I have to assume that at some point Chase or one of the guys at PFR has run the numbers for “SRS without special teams/defense scores”, but I have yet to find it.

As the title states, this is a data dump; I’m hoping that readers of this site will find the info useful for their own research or general interest. Today, we’ll just look at the offense, I’ll post the numbers for defense in a follow-up post. [continue reading…]

References

References
1 I have to assume that at some point Chase or one of the guys at PFR has run the numbers for “SRS without special teams/defense scores”, but I have yet to find it.
{ 3 comments }

Implied SRS NFL Ratings For 2015

In each of the last two years, I’ve derived implied SRS ratings for NFL teams based on the Vegas point spreads (I also do the same for college football teams). Well, in late April, CG Technology released lines for 238 NFL games. Things have changed since late April, of course, but for now, let’s work with that data.

For the third straight year, Seattle, Denver, New England, and Green Bay are ranked among the top five teams in the NFL. And before you ask, yes, we will get to the Tom Brady issue in a few moments. The Seahawks are underdogs in just one game this year, and even in that game, Seattle is a just 1-point underdog in Green Bay. The Packers are underdogs in just one game, too: Green Bay is a 1.5-point underdog during a week 8 trip to Denver. On the other side, the Raiders aren’t favored in a game all year: the closest is a pick’em when the Jets come to Oakland.

As a reminder, we can use the Simple Rating System to take all 238 point spreads and derive ratings. But as a sign of how good Vegas viewed Seattle, consider these four Seahawks road lines: [continue reading…]

{ 13 comments }

The Patriots SRS rating has been inflated in the postseason

The Patriots true SRS rating is deflated if you only use regular season data.

It has always seemed a little strange to me that we think about the regular season and the playoffs separately when evaluating a team’s season. At least, that’s usually what happens in terms of the numbers. We think about a team’s regular season record and we think about where they were eliminated in the playoffs. A team’s Simple Rating System (SRS) rating is based just on their regular season performance. [1]Note that Football Outsiders’ DVOA does update for the playoffs. When we evaluate a team or a matchup, it might make more sense to think about their whole body of work including the playoffs when calculating ratings.

In the table below, I have calculated the SRS of Super Bowl teams according to Pro Football Reference’s (PFR) method that considers just the regular season. [2]It looks like I get the same numbers as PFR in a bunch of cases, but I have not checked all of them. In any event, it looks like my program works. I have also added adjusted ratings that include the playoff games leading up to the Super Bowl. These set of adjusted ratings help to identify the Super Bowls that were the closest and best matchups based on teams’ performances over the entire season including the playoffs. [continue reading…]

References

References
1 Note that Football Outsiders’ DVOA does update for the playoffs.
2 It looks like I get the same numbers as PFR in a bunch of cases, but I have not checked all of them. In any event, it looks like my program works.
{ 10 comments }

Rams/Raiders was the Least-Conforming Game of 2014

50/50 chance these guys show up

50/50 chance these guys show up

They’re baaack! In November 2013, the St. Louis Rams blew out the visiting Indianapolis Colts in what was the least-conforming game of the 2013 season.

In November 2014, the Rams blew out the visiting Oakland Raiders in what was the least-conforming game of 2014 (although for my money, the runner-up game between the Titans and Chiefs was probably still the strangest result of the year). The Rams finished the season with a -0.8 SRS rating, eight points better than the 2014 Raiders SRS rating of -8.8. Given that the game was in St. Louis, we would have expected the Rams to win by around 11 points.

In reality, the Rams shut out the Raiders, 52-0. That gave St. Louis a single-game SRS score of 40.2, meaning the Rams were 40.2 points better than average that day. [1]Technically, this bit of information is superfluous for the main point of this post, but I always err on the side of including interesting data. Since St. Louis won by 52 when the Rams were expected to win by 11, they exceeded expectations by a whopping 41 points.

That 41-point total — the amount by which St. Louis exceeded expectations — was the highest of any game in 2014. The table below lists all relevant information from every regular season game this year, with the “diff” column showing the difference between the expected and actual margins of victory. I have also included a link to the boxscore of each game embedded in the “Wk” cell. Note that the table, by default, lists only the top 10 games, but you can view more using either the dropdown box, the search bar, or the previous/next buttons at the bottom of the table. [continue reading…]

References

References
1 Technically, this bit of information is superfluous for the main point of this post, but I always err on the side of including interesting data.
{ 1 comment }

The SEC West closed system is no more. If so inclined, one could note that Alabama lost to Ole Miss, and Ole Miss lost to Auburn, and Auburn lost to Georgia, and Georgia lost to both Florida and South Carolina, and Florida and South Carolina both lost to Missouri, and Missouri lost to Indiana. And Indiana is terrrrrible.

The Auburn loss to Georgia was enough to ruin this crazy streak: prior to Saturday, Auburn, Alabama, LSU, Mississippi, Mississippi State, and Texas A&M were a combined 35-0 against the rest of college football this season. But on Saturday:

  • Auburn lost badly to Georgia, 34-7. The Bulldogs are very good — and even better with Todd Gurley back — and now rank 5th in the SRS. But Georgia still did somehow lose to both Florida and South Carolina, who are a combined 9-9 this year against FBS opponents. As for the Tigers: I had been leading the Auburn bandwagon because they have easily played the toughest schedule to date in college football — oh, and Alabama is still on the schedule — but this was the straw that broke Auburn’s playoff chances.
  • LSU was shut out against Arkansas, 17-0. The Razorbacks had been 4-5, albeit with losses to Alabama, Mississippi State, Auburn, Georgia, and Texas A&M.
  • Texas A&M lost to Missouri, 34-27. The Tigers, of course, had the most embarrassing SEC performance of the season, losing to an Indiana team that is 0-6 in conference play. That’s 0-6 in the Big Ten, for you folks keeping score at home. And Missouri lost to them. As a result, any team that loses to Missouri gets to wear that shame by osmosis, and indirectly, you could stretch that all the way to Alabama.

Of course, the SRS is not based purely on wins and losses: in some ways, it isn’t based at all on wins and losses, as it is focused solely on points differential (adjusted for close games, blowouts, and home field) and strength of schedule. The table below shows the week 12 college football SRS ratings, with Alabama now moving into the top spot. As always thanks to Dr. Peter R. Wolfe for providing the weekly game logs. Some more playoff thoughts about the jump: [continue reading…]

{ 7 comments }
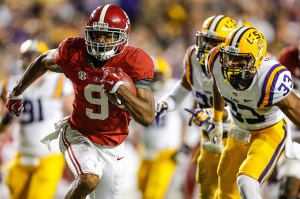
The Tide escaped Baton Rouge with a win and its playoff goals in sight

The Tide escaped Baton Rouge with a win and its playoff goals in sight.

The playoff picture is beginning to emerge. With most teams having just three games left in the college football regular season, we get a sense of the task ahead for the college football playoff committee. And, unfortunately, it feels as though the committee is going to use some variation of the following logic:

Step 1: Rank teams in ascending order by losses

Step 2: Rank teams by some combination of eye test and recency of last loss

There are still three undefeated teams: Mississippi State, Florida State, and Marshall. MSU and FSU seem likely to take the top 2 spots, and there does not appear to be much thought given to the process other than that. Marshall is not in the conversation, and for good reason: they have a bottom three strength of schedule according to the SRS (you can sort by SOS in the table below).

Mississippi State still ranks just 7th in the SRS, but remember, that’s a predictive ranking. I would put the Bulldogs atop my mythical rankings for playoff purposes, too. But Florida State? FSU has three notable wins on its resume, and none of them were in convincing fashion. Those wins came against Clemson (#25), Notre Dame (#31), and Louisville (#32), and one would think that the 2nd best team in the country would defeat those teams more convincingly. Regardless, as defending champions and riding a 25-game winning streak, nobody will argue against the Seminoles.

But the next two spots? That’s where the debate begins. Ignoring 9-1 Colorado State (very soft strength of schedule), 8-1 Duke (same), and 8-1 Nebraska (only one win — against SRS #23 Miami — against an SRS top-65 team), there are 6 teams with one loss that seem likely to take the #3 through #8 spots in the next edition of the playoff rankings. A best guess as to where those teams land on Tuesday:

  • #3 Oregon – the Ducks ranked 4th last week, and won in convincing fashion at Utah in week 11, while #3 Auburn slipped at home against Texas A&M.
  • #4 Alabama – a chance the Tide move ahead of Oregon because of a “big win” against a high-profile opponent in LSU. Will the committee penalize Alabama for needing overtime to beat LSU, or praise Alabama because by virtue of the game going to overtime it means LSU is a really good team (This, of course, is known as SEC country logic)?
  • #5 TCU – the Horned Frogs were 6th last week, and handled Kansas State, which ranked 7th in the rankings last week. Could TCU jump Alabama or Oregon? After all, #6 beating #7 should count more than beating #16 (LSU in last week’s rankings) or #17 (Utah), but don’t hold your breath for a team like TCU getting a wave of momentum. In fact, we might even see the Horned Frogs drop, because…
  • #6 Baylor – the Bears demolished Oklahoma in Norman in week 11. And Baylor defeated TCU back in week seven. The committee is supposed to value head-to-head, but does that mean Baylor should be ranked ahead of TCU? That argument would hold more weight, at least to me, if Baylor hadn’t lost by 14 points to West Virginia, a team that TCU happened to beat. If West Virginia had just one conference loss, Baylor, TCU, and West Virginia would all be tied and be 1-1 in the three-team round robin; instead, crediting Baylor for West Virginia losing other conference games somehow makes that Baylor loss… better? I don’t follow that logic, but who knows what the committee will do. Frankly, choosing between the top two Big 12 teams is an exercise in hair splitting. Will the recency of Baylor’s loss be held against the Bears vis-a-vis TCU? That sounds silly, but Baylor dropped below TCU after losing to West Virginia, and perhaps the Bears will never rise above them again.
  • #7 Arizona State – the Sun Devils crushed Notre Dame, and were ranked ahead of Baylor last week. Perhaps ASU will remain in the 6 spot, but frankly, the committee can punt on this question. If Arizona State and Oregon both win out, the Pac-12 championship game will turn into a de facto play-in game for the college football playoffs. Arizona State lost by 25 points to UCLA — will that weigh on the committee’s mind in choosing among the 1-loss teams? ASU’s best wins are against USC, Utah, Notre Dame, and Stanford, which still leaves a bit to be desired.
  • #8 Ohio State – just a guess, but the assumption here is the committee puts OSU in the 8 slot this week. Ohio State convincingly defeated Michigan State this week, easily the most impressive performance by the Buckeyes this year. But a home loss to Virginia Tech looks terrible in retrospect, and OSU’s second best win was against… Maryland? Penn State? Cincinnati? If Ohio State is ranked in the top 8 this week, it’s a sign that the committee is basically operating on 4th grade level. First, rank the team by losses, then….

When we go to the 2-loss teams, Auburn and Ole Miss stand out. The Tigers in particular deserve to be ahead of both Ohio State and Arizona State, in my opinion, and Auburn’s resume would only get stronger with road wins against Georgia and Alabama. Auburn has defeated Ole Miss, LSU, and Kansas State, wit two of those games coming on the road. If going 3-2 in five games that are @Ole Miss, vs. LSU, @KSU, @Mississippi State, and vs. Texas A&M supposed to be less impressive than going 4-1 @Michigan State, vs. Virginia Tech, @Maryland, @Penn State, and vs. Cincinnati? I am not buying that logic at all, and that still ignores Auburn’s wins against Arkansas, Louisiana Tech, and South Carolina, teams that all rate as tougher than Penn State and Cincinnati.

As for Ole Miss, the Rebels went 3-2 vs. Alabama, @Auburn, @LSU, vs. Texas A&M, and vs. Tennessee. Is it clear that such a record is worse than going 4-1 vs. UCLA, @Southern Cal, vs. Utah, vs. Notre Dame, and vs. Stanford? And Ole Miss still has a chance to pad its resume with a win on the road against Mississippi State.

If the committee is using strength of schedule solely as a tiebreaker after sorting teams by losses, [1]You know, after eliminating Marshall, Colorado State, Duke, and Nebraska for strength of schedule., then shame on the committee. The table below shows the week 11 college football SRS ratings, with Alabama now moving into the top spot. As always thanks to Dr. Peter R. Wolfe for providing the weekly game logs. Some more playoff thoughts about the jump: [continue reading…]

References

References
1 You know, after eliminating Marshall, Colorado State, Duke, and Nebraska for strength of schedule.
{ 2 comments }

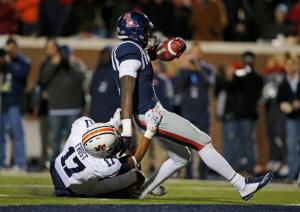
Heartbreaking

Heartbreaking.

From one perspective, Saturday brought one of the cruelest moments in years. In a must-win game for Ole Miss, the Rebels played a back-and-forth contest with perhaps the best team in college football. Trailing 35-31, Bo Wallace and the offense took over on the Mississippi 48-yard line with just over three minutes remaining. The Rebels moved quickly down the field, and on short pass to Laquon Treadwell appeared to turn into the go-ahead score. Just as Treadwell crossed the goal line, he was tackled from behind, suffering an injury that you knew was bad as soon as it happened. As it turned out, Treadwell broke his leg, and then the insult came. Upon review of the score, while Treadwell crossed the goal line, the ball did not, and he fumbled as he was taken down. Auburn recovered in the end zone, and the Tigers would prevail. [continue reading…]

{ 1 comment }

Let’s start with the SRS ratings for every team in the NFL. The SRS ratings are generated based off of the points scored, points allowed, home field, and opponent for each game. In its simplest form, the SRS is just an SOS-adjusted version of points differential, although the devil is in the details. After running hundreds of iterations to get the ratings to converge (and awarding 3 points to the home team), below are the ratings through week 8: [continue reading…]

{ 2 comments }

The Bulldogs pushed aside the Tigers in week 7; just not in the SRS

MSU pushed aside Auburn in week 7; (but not in the SRS).

In last week’s rankings, Auburn stood head and shoulders above the rest of college football. As a result, even a 15-point loss on the road against Mississippi State wasn’t enough to nudge the Tigers from the top spot. Is this a problem? Not really. The SRS ratings are predictive; they are not designed to tell you which teams are the most deserving or which schools have accomplished the most. Instead, they are intended to give you an idea of what might happen in a future game between any two teams.

Auburn’s rating is amplified by a 41-7 victory against LSU, which stands out as the most dominant performance of the year. The Tigers also crushed Arkansas by 24, a margin that looks more impressive every week. Other than yesterday’s loss, Auburn’s “worst” performance of the year by SRS standards was a 6-point win on the road against Kansas State (#14 in the SRS), which would be the best game of the year for all but a handful of teams.

The Mississippi schools check in at #2 and #3 in the SRS this week; Alabama and Texas A&M are #8 and #9, giving the SEC West five teams in the top ten yet again. Auburn, with the double-edged sword of a brutal schedule, will have no problem getting back into the playoff discussion if the Tigers can win out. Georgia, fresh off a 34-0 thumping of Missouri, is now 7th in the SRS. But I want to focus on schools 4, 5, and 6 in the ratings. All are from the Big 12, a conference doesn’t appear to be getting much respect nationally.

The ten-team conference plays a round robin schedule, meaning each team gets nine division games. That leaves only 3 nonconference games for each school, and the class of the conference — Baylor, Oklahoma, and TCU — are already done with that part of their schedule. It makes sense to analyze these teams as a group, because for SRS purposes (and based on the two head-to-head games), these three teams are all about equal. In their nine nonconference games, they went 9-0 with an average margin of victory of 41 points, and all wins came by at least 23. Of course, that schedule was loaded with cupcakes: other than Tennessee (currently 12th in the SRS), the only semi-respectable opponents were Minnesota (#38) and Louisiana Tech (#50). And the Vols game is certainly helping: Tennessee is 3-3, but the losses were by 1 point to Florida, 4 to Georgia, and 24 to Oklahoma. [continue reading…]

{ 1 comment }

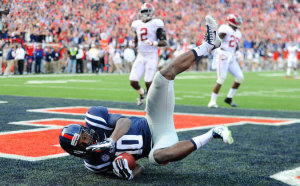
Ole Miss pulled off the big upset

Ole Miss pulled off the big upset.

Early in the day, Mississippi State blew out Texas A&M in Starkville, 48-31. That was the first half in the most incredible football day in Magnolia State history. What happened next was much more dramatic.

Ole Miss had lost 10 straight games to Alabama, with 9 of those games coming by at least 22 points. The last three years, the Crimson Tide had won by an average of 36.7 points. Last year, a 3-0 Ole Miss team — fresh off of a blowout win in Texas — lost in Tuscaloosa, 25-0. So while the Rebels entered Saturday with a 4-0 record and a top-15 ranking, it would be fair to wonder how they would handle an Alabama team that was still Alabama.

Early on, the Tide looked like the better team. Amari Cooper was not dominating, but T.J. Yeldon looked great, en route to a 100-yard day. Quarterback Blake Sims looked smart and efficient, while Ole Miss couldn’t seem to get much going on offense like just about every opponent ever against Alabama. Still, the Rebels defense had played well enough to keep the Tide to just seven first half points, and the game looked to be 7-3 at the end of the half. That is, until what appeared to be the turning point of the game.

In the final seconds of the half, a screen pass to I’Tavius Mathers looked to be uneventful, until Cyrus Jones pulled off the trifecta — strip, fumble recovery, return for a touchdown. Replays showed that Jones committed a blatant facemask penalty, which likely lead to the fumble, but the refs didn’t see it. So after a great first half, a bad call meant Ole Miss was suddenly down 14-3. This seemed like a recipe for yet another Alabama win over the Upstart Of the Week.

But the weirdest thing happened in the second half. Ole Miss didn’t just outscore Alabama, it outplayed them. And not by an insignificant margin. Bo Wallace, Laquon Treadwell, and Evan Engram (other than a huge drop) were dominant in the second half, while the Ole Miss defense continued its excellent play. A gorgeous touchdown to Jaylen Walton gave Ole Miss a touchdown lead, but in typical Ole Miss fashion, the team botched the extra point not once, but twice. [1]First, the kick clanked off the upright. A roughing the kicker penalty gave the Rebels another chance, but the second extra point attempt was blocked.

With Ole Miss now clinging to only a 6-point lead, you could hardly blame anyone for expecting Alabama to win the game with a last second touchdown. A 30-yard catch and run by Cooper on the final drive put the Tide in inside the Ole Miss 30. But an incredible interception by Senquez Golson sealed the victory, and the day was complete: Mississippi not only beat, but outplayed Alabama, in a crucial game in a battle for SEC West supremacy. The game (and the aftermath) was everything that was great about college football.

Which almost makes it seem silly to transition to college football ratings, since we are still too early in the year for these ratings to hold significant meaning. Last week, I unveiled the initial SRS ratings. In perhaps two weeks, the ratings will start to really hold up, but for now, these are mostly a gut check. As always thanks to Dr. Peter R. Wolfe for providing the weekly game logs. As a reminder, these ratings are intended to be predictive only, and not intended as a way to rank college football teams for any other purpose. [continue reading…]

References

References
1 First, the kick clanked off the upright. A roughing the kicker penalty gave the Rebels another chance, but the second extra point attempt was blocked.
{ 2 comments }

The past couple of weeks, I was using a quasi-Elo style rating system to produce college football team ratings. And while after five weeks it is still far too early to put much faith in any computer ratings, we can at least begin framing the discussion of which are the most impressive teams in college football. So, as we did last year, the first edition of the college football SRS ratings are coming out at the end of September. As a reminder, here is the methodology:

1) For each game not played at a neutral site, 3 points are given to the road team. After that adjustment, all wins and losses of between 7 and 24 points are recorded exactly as such. This means that a 24-10 road win goes down as +17 for the road team, -17 for the home team.

2) With one exception, wins of 7 or fewer points are scored as 7-point wins and losses of 7 or fewer points are scored as 7 point losses. So a 4-point home win goes down as +7 (and not a 1) and a 1-point home loss is a -7 (and not a -4). The one exception is that road losses of 3 or fewer (and home wins of 3 or fewer) are graded as ties. So a 21-20 home victory goes down as a 0 for both teams.

3) Wins/Losses of more than 24 points are scored as the average between the actual number and 24. This is to avoid giving undue credit to teams that run up the score. So a 75-point home win goes down as a 48-point win.

Once we have a rating for each team in each game, we then adjust each result for strength of schedule. This is an iterative process, where we adjust the ratings hundreds of times (to adjust for SOS, you have to adjust for the SOS of each opponent, and the SOS of each opponent’s opponent, and so on.) in Excel. Then we produce final ratings, where the SRS rating is the sum of the Margin of Victory and Strength of Schedule in every week.

After five weeks, what are the results? As usual, the table is fully searchable (type “-0″, for example, to see a list of undefeated teams, or SEC to see all SEC teams.) Right now, the number one team is Oklahoma, with an average (adjusted) Margin of Victory of 24.6 points per game against an average opponent that is 43.3 points better than average (average includes all football teams at all levels, so all FBS teams will have a positive grade). Among undefeated teams, the only teams with tougher to-date schedules than Oklahoma are Auburn and UCLA. Below shows the ratings for all 128 FBS teams.

As always thanks to Dr. Peter R. Wolfe for providing the weekly game logs. [continue reading…]

{ 2 comments }

Analyzing NFL SRS Ratings Through 3.0625 Weeks

I thought it would be fun to create NFL SRS ratings through three weeks and one Thursday Night football game. After just 3.0625 weeks, all data are heavily influenced by events that are unlikely to be repeated.  Remember Neil’s old post that showed how for teams with any record, to determine their “true winning percentage”, we need to add 5.5 wins and 5.5 losses. That means through three weeks, a team’s actual record should still be regressed to league average by nearly 80%; in other words, take all these ratings with a big grain of salt.  But there’s no reason not to run the numbers, so here are the customary parameters:

  • Home wins of less than 3 points are treated as ties;
  • For all other games, give the road team 3 points.  From there, wins of fewer than 7 points are treated as 7-point wins;
  • Wins of between 7 and 24 points (after adjusting for home field) are treated as they are.  So a 14-point home win is a 11-point MOV, and a 17-point road win is a 20-point MOV;
  • Wins of greater than 24 points convert to a Margin of Victory that is the average of 24 and the HFA-adjusted MOV.  So the Falcons get a 31.5 for beating Tampa Bay by 42 at home, while the Giants get a MOV of 29 for winning in Washington by 31.

From there, we simple use the typical SRS iteration process to produce a set a season ratings. Those are presented below: [continue reading…]

{ 3 comments }
The top passing game of 2013

The top passing game of 2013.

Yesterday, I analyzed the 2013 passing numbers for strength of schedule. Today, we look at the best and worst games of the year, from the perspectives of both the quarterbacks and the defenses.

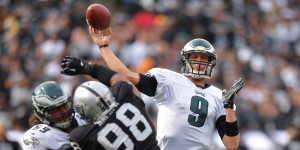
Let’s start with the top 100 passing games from 2014. The top spot belongs to Philadelphia’s Nick Foles, for his monstrous performance against Oakland. Foles threw for 406 yards and 7 touchdowns on just 28 pass attempts. Even including his one one-yard sack, Foles averaged a whopping 18.79 ANY/A in that game. The league-average last season was 5.86 ANY/A, which means Foles was 12.93 ANY/A above average. Now since the game came against the Raiders, we have to reduce that by -1.29, which was how many ANY/A the Raiders defense was below average. So that puts Foles at +11.64; multiply that by his 29 dropbacks, and he produced 337 adjusted net yards of value above average after adjusting for strength of schedule. That narrowly edges out the other seven-touchdown game of 2013, which came at the hands of Peyton Manning against Baltimore on opening night.

The third spot goes to Drew Brees in a week 17 performance against Tampa Bay. The 4th best game of 2013 was a bit more memorable: Tony Romo takes that prize in a losing effort, the insane week five shootout against Manning and the Broncos (Peyton’s performance checks in at #32). The table below shows the top 100 games of 2013, although for viewing purposes, it displays only the top 10 by default (all tables, as usual, are fully searchable, expandable, and sortable). [continue reading…]

{ 16 comments }

Adjusting for strength of schedule is important

Adjusting for strength of schedule is important.

Every year at Footballguys.com, I publish an article called Rearview QB, which adjusts the fantasy football statistics for quarterbacks (and defenses) for strength of schedule. I’ve also done the same thing for years (including last season) using ANY/A instead of fantasy points, which helps us fully understand the best and worst real life performances each year. Today I deliver the results from 2013.

Let’s start with the basics. Adjusted Net Yards per Attempt is defined as (Passing Yards + 20 * Passing Touchdowns – 45 * Interceptions – Sack Yards Lost) divided by (Pass Attempts plus Sacks). ANY/A is my favorite explanatory passing statistic — it is very good at telling you the amount of value provided (or not provided) by a passer in a given game, season, or career.

Let’s start with some basic information. The league average ANY/A in 2013 was 5.86, a slight downgrade from 2012 (5.93). Nick Foles led the way with a 9.18 ANY/A average last year, the highest rate in the league among the 45 passers with at least 100 dropbacks. Since the Eagles quarterback had 317 pass attempts and 28 sacks in 2013, that means he was producing 3.32 ANY/A (i.e., his Relative ANY/A) over league average on 345 dropbacks. That means Foles is credited with 1,145 Adjusted Net Yards above average, a metric labeled “VALUE” in the table below. Of course, Peyton Manning led the league in that category last year, with a whopping 2,037 Adjusted Net Yards over Average.

RkNameTmCmpAttPydTDINTSkSkYdDBANY/AVALUE
1Peyton ManningDEN45065954775510181206778.872037
2Nick FolesPHI2033172891272281733459.181145
3Drew BreesNOR44665051623912372446877.511130
4Philip RiversSDG37854444783211301505747.791107
5Aaron RodgersGNB1932902536176211173118665
6Josh McCownCHI149224182913111372358.54629
7Russell WilsonSEA2574073357269442724517.1555
8Tony RomoDAL34253538283110352725706.54384
9Colin KaepernickSFO2434163197218392314556.65358
10Matthew StaffordDET37163446502919231686576.4355
11Andy DaltonCIN36358642933320291826156.29265
12Ben RoethlisbergerPIT37558442612814422826266.24238
13Tom BradyNWE38062843432511402566686.13175
14Michael VickPHI7714112155315991566.93166
15Jay CutlerCHI22435526211912191323746.23136
16Andrew LuckIND3435703822239322276026.06120
17Sam BradfordSTL159262168714415972776.166
18Alex SmithKAN3085083313237392105475.9441
19Matt McGloinOAK1182111547886532175.9622
20Jake LockerTEN111183125684161051995.68-36
21Matt CasselMIN153254180711916852705.69-46
22Brian HoyerCLE5796615536481025.22-66
23Cam NewtonCAR29247333792413433365165.69-88
24Thaddeus LewisBUF93157109243181001755.35-89
25Ryan FitzpatrickTEN21735024541412211093715.62-90
26Matt RyanATL43965145152617442986955.72-103
27Carson PalmerARI36257242742422412896135.67-119
28Matt FlynnGNB124200139285241352245.32-121
29Case KeenumHOU137253176096192012725.4-126
30Kellen ClemensSTL142242167387211382635.25-162
31Jason CampbellCLE1803172015118161043335.32-182
32Robert GriffinWAS27445632031612382744945.48-188
33Christian PonderMIN152239164879271192664.75-296
34EJ ManuelBUF1803061972119281593344.87-330
35Josh FreemanTAM63147761248611553.61-349
36Kirk CousinsWAS81155854475321603.67-351
37Brandon WeedenCLE141267173199271802944.51-398
38Mike GlennonTAM2474162608199403144564.98-405
39Matt SchaubHOU21935823101014211623794.53-504
40Terrelle PryorOAK1562721798711312033034.09-537
41Chad HenneJAX30550332411314382435414.86-544
42Ryan TannehillMIA35558839132417583996465-559
43Eli ManningNYG31755138181827392815904.53-788
44Geno SmithNYJ24744330461221433154864.17-824
45Joe FlaccoBAL36261439121922483246624.5-904

Manning paces in the field in Value over average, of course: that’s not surprising when the future Hall of Famer set the single-season record for passing yards and passing touchdowns. Foles, Drew Brees, and Philip Rivers formed the next tier of quarterbacks, far behind Manning but well ahead of the rest of the league.

And at the bottom of the list was the defending Super Bowl MVP, Joe Flacco. With a 4.50 ANY/A average, Flacco only edged out four other quarterbacks in that statistic, and none of the other passers came close to accumulating as many dropbacks as Flacco. After him comes the two New York quraterbacks, Geno Smith and Eli Manning.

But the point of today’s post is to adjust those numbers for strength of schedule. The solution is this post — a methodology I’ve labeled Rearview adjusted net yards per attempt, which adjusts those numbers for strength of schedule. The system is essentially the same as the one used in the Simple Rating System. Let’s look at Matt Ryan, who averaged 5.72 ANY/A last season, on 695 dropbacks. If we want to find Ryan’s SOS-adjusted rating, we need an equation that looks something like this: [continue reading…]

{ 19 comments }
FSU is a heavy favorite to wind up in the national title game again

FSU is a heavy favorite to wind up in the national title game again.

The Simple Rating System is a set of computer rankings that is focused on only two variables: strength of schedule and margin of victory. I publish weekly college football SRS ratings each season, and you can read more about the SRS there. Last year, I took the Las Vegas point spreads for over 200 college football games to come up with a set of power rankings. By taking every data point, and using Excel to iterate the ratings hundreds of times, I was able to generate a set of implied team ratings.

Well on Friday, the Golden Nugget released the point spreads for 200 games (h/t to RJ Bell). You might not think we can do much with just a couple hundred games, but by using an SRS-style process, those point spreads can help us determine the implied ratings that Las Vegas has assigned to each team.

We don’t have a full slate of games, but we do have at least 1 game for 77 different teams. Theoretically, this is different than using actual game results: one game can be enough to come up with Vegas’ implied rating for the team. Purdue may only have a spread for one game, but that’s enough. Why? Because Purdue is a 21-point underdog at a neutral field (Lucas Oil) against Notre Dame, and we have point spreads for the Fighting Irish in ten other games. Since we can be reasonably confident in Notre Dame’s rating, that makes us able to be pretty confident about Purdue’s rating, too.

The system is pretty simple: I took the point spread for each game and turned it into a marvin of victory, after assigning 3 points to the road team in each game. For example, Alabama is a 6-point home favorite against Auburn. So for that game, we assume Vegas believes the Tide are three points better than the Tigers; if we do this for each of the other 199 games, and then iterate the results hundreds of times, we can come up with a set of power ratings. [continue reading…]

{ 4 comments }

Vegas Has The Seahawks As the Best Team in 2014

Last year, I derived implied SRS Ratings for each NFL team based on the initial Vegas point spreads. Well, lines have been set for the first 240 games of the year — i.e., every week but week 17 — which means we can re-run the exercise for 2014.

So how do we use point spread data to derive SRS ratings? The point spread in each game provides an implied strength margin (“ISM”) between the two teams: When the Raiders are 10-point home underdogs to Denver, that implies that Denver is 13 points better than Oakland. If we treat each ISM like we would margin of victory, then we can use the SRS to come up with team ratings. For those who need a primer on what the SRS is, you can read about it here; the rest of you can skip to the ratings:

RkTeamMOVSOSSRS
1Seattle Seahawks5.10.926.02
2Denver Broncos5.530.155.68
3San Francisco 49ers4.30.815.11
4Green Bay Packers3.50.33.8
5New England Patriots3.6-0.393.21
6New Orleans Saints2.070.782.85
7Carolina Panthers1.330.822.15
8Chicago Bears0.570.781.35
9Philadelphia Eagles1.20.071.27
10Cincinnati Bengals1.3-0.171.13
11Indianapolis Colts1.97-0.891.08
12Detroit Lions0.93-0.030.9
13Kansas City Chiefs0.730.120.85
14Atlanta Falcons0.30.390.69
15Pittsburgh Steelers1.47-0.850.61
16Dallas Cowboys0.370.140.5
17Baltimore Ravens0.93-0.580.36
18Arizona Cardinals-1.271-0.27
19New York Giants-0.23-0.11-0.35
20San Diego Chargers-0.3-0.13-0.43
21Houston Texans0.4-1.46-1.06
22Miami Dolphins-1.1-0.44-1.54
23Washington Redskins-1.27-0.34-1.6
24Tampa Bay Buccaneers-2.370.48-1.88
25St. Louis Rams-2.70.72-1.98
26New York Jets-2.6-0.03-2.63
27Cleveland Browns-1.87-0.82-2.69
28Buffalo Bills-2.6-0.37-2.97
29Minnesota Vikings-3.60.47-3.13
30Tennessee Titans-1.97-1.31-3.27
31Oakland Raiders-6.270.52-5.75
32Jacksonville Jaguars-7.47-0.55-8.01

This time last year, the top five teams were…. well, the exact same five teams, albeit in a slightly different order. And the bottom three teams were… Jacksonville, Oakland, and Tennessee, in that exact order. The Broncos have the largest average margin of victory [1]Just to be clear, this analysis includes 3 points for each home team except in the London games, so these are more accurately thought of as location-adjusted expected margins of victory., but because the Seahawks face a tougher schedule, the Seahawks are implied by Vegas to be the strongest team in the NFL at six points better than average.

One interesting way to use the SRS is to see which teams have the hardest schedules. Pre-season strength of schedule is essentially meaningless when based on last year’s record, but the SOS ratings here are based on the implied strengths of each team. In my opinion, you’d be hard-pressed to find a better set of strength of schedule ratings in May than what we see here (other than the fact that they exclude week 17).

The toughest schedule this year belongs to Arizona: add in the oldest roster in the league in 2013, and it’s easy to see why Vegas is so bearish on the Cardinals in 2014. The Seahawks (+0.92) and 49ers (+0.81) have two of the next three toughest schedules (with the Panthers sandwiched between them). The Rams are a few spots down, but remember: this is only the strength of schedule for the first sixteen weeks of the season. St. Louis travels to Seattle in week 17, so the Rams schedule would be just as brutal if we included that game. The Bears having one of the five hardest schedules is a surprise after having such an easy slate in 2013.  It’s true that this analysis ignores that Chicago gets to play Minnesota in week 17, which would ease their schedule strength, but the Bears face the 49ers, Patriots, Saints, and Panthers this year, along with two games against Green Bay. That’s six games against top-7 teams.

Three AFC South teams have the easiest schedules; the Jaguars would probably join the rest of the division if they had two games against Jacksonville. The Texans are set up nicely for a rebound season under Jadeveon Clowney, Bill O’Brien, and, uh, Ryan Fitzpatrick/Case Keenum/Tom Savage. What’s really incredible about Houston’s schedule: not only do the Texans have the easiest schedule through 16 weeks, the Texans host the Jaguars in week 17! Including that game would bring Houston’s schedule down to 1.9 points easier than average.

If you include that game, 8 of the Texans’ 16 games are against teams that are 1.5 points weaker than average. Playing six games against the AFC South, the NFC East and the AFC North, and the Bills and Raiders makes for about as easy a schedule as one could create. Assuming the Texans would be favored in week 17, that means Houston — which went 2-14 last year — is favored in 8 of 16 games and a pick’em in three others (Philadelphia and Cincinnati at home, Tennessee on the road). That’s pretty incredible, and explains why Vegas was so bullish on Houston.

The table below shows each game in the first sixteen weeks of the 2014 season.  Here’s how to read the Seahawks/Raiders line: In week 9, Seattle hosts Oakland. The line is -14.5, which means the Seahawks are 14.5-point favorites. Seattle’s SRS is 6.0 while Oakland has an SRS of -5.8. Therefore, the line predicted by the SRS would be Seattle -14.8 (since the Raiders are 11.8 points worse than the Seahawks and on the road). The difference between the actual line and the SRS line is -0.3 points. By definition, the sum of all the differences between the actual lines and SRS lines must be 0, since the SRS lines were generated from the actual lines. The table below contains 480 rows, showing each game from the perspective of both teams (although the only searchable column is the first team column):

WkTeam 1Team 2H/RLineTm SRSOpp SRSProj SRS LineDiff
9Seattle SeahawksOakland RaidersHome-14.56-5.8-14.8-0.3
3New England PatriotsOakland RaidersHome-133.2-5.8-121
12Indianapolis ColtsJacksonville JaguarsHome-121.1-8-12.1-0.1
14Denver BroncosBuffalo BillsHome-11.55.7-3-11.7-0.2
1Philadelphia EaglesJacksonville JaguarsHome-111.3-8-12.3-1.3
9Cincinnati BengalsJacksonville JaguarsHome-111.1-8-12.1-1.1
9San Francisco 49ersSt. Louis RamsHome-115.1-2-10.10.9
15Baltimore RavensJacksonville JaguarsHome-10.50.4-8-11.4-0.9
12Seattle SeahawksArizona CardinalsHome-10.56-0.3-9.31.2
4San Diego ChargersJacksonville JaguarsHome-10-0.4-8-10.6-0.6
12Denver BroncosMiami DolphinsHome-105.7-1.5-10.2-0.2
5Green Bay PackersMinnesota VikingsHome-103.8-3.1-9.90.1
10Seattle SeahawksNew York GiantsHome-106-0.3-9.30.7
3New Orleans SaintsMinnesota VikingsHome-102.8-3.1-8.91.1
10Dallas CowboysJacksonville JaguarsLond-100.5-8-8.51.5
10Denver BroncosOakland RaidersRoad-105.7-5.8-8.51.5
2Washington RedskinsJacksonville JaguarsHome-9-1.6-8-9.4-0.4
5Denver BroncosArizona CardinalsHome-95.7-0.3-90
12San Francisco 49ersWashington RedskinsHome-8.55.1-1.6-9.7-1.2
15Kansas City ChiefsOakland RaidersHome-8.50.8-5.8-9.6-1.1
2Green Bay PackersNew York JetsHome-8.53.8-2.6-9.4-0.9
8Denver BroncosSan Diego ChargersHome-8.55.7-0.4-9.1-0.6
11San Diego ChargersOakland RaidersHome-8-0.4-5.8-8.4-0.4
7New England PatriotsNew York JetsHome-7.53.2-2.6-8.8-1.3
6Seattle SeahawksDallas CowboysHome-7.560.5-8.5-1
16Carolina PanthersCleveland BrownsHome-7.52.1-2.7-7.8-0.3
5New Orleans SaintsTampa Bay BuccaneersHome-7.52.8-1.9-7.7-0.2
4Indianapolis ColtsTennessee TitansHome-7.51.1-3.3-7.40.1
5Detroit LionsBuffalo BillsHome-7.50.9-3-6.90.6
16San Francisco 49ersSan Diego ChargersHome-75.1-0.4-8.5-1.5
14San Francisco 49ersOakland RaidersRoad-75.1-5.8-7.9-0.9
2Denver BroncosKansas City ChiefsHome-75.70.8-7.9-0.9
6Tennessee TitansJacksonville JaguarsHome-7-3.3-8-7.7-0.7
1Denver BroncosIndianapolis ColtsHome-75.71.1-7.6-0.6
12Philadelphia EaglesTennessee TitansHome-71.3-3.3-7.6-0.6
11Chicago BearsMinnesota VikingsHome-71.4-3.1-7.5-0.5
3Cincinnati BengalsTennessee TitansHome-71.1-3.3-7.4-0.4
5San Francisco 49ersKansas City ChiefsHome-75.10.8-7.3-0.3
15Detroit LionsMinnesota VikingsHome-70.9-3.1-70
2San Francisco 49ersChicago BearsHome-75.11.4-6.70.3
12Atlanta FalconsCleveland BrownsHome-70.7-2.7-6.40.6
15New England PatriotsMiami DolphinsHome-6.53.2-1.5-7.7-1.2
1Chicago BearsBuffalo BillsHome-6.51.4-3-7.4-0.9
15Carolina PanthersTampa Bay BuccaneersHome-6.52.1-1.9-7-0.5
10Cincinnati BengalsCleveland BrownsHome-6.51.1-2.7-6.8-0.3
14Green Bay PackersAtlanta FalconsHome-6.53.80.7-6.10.4
8Kansas City ChiefsSt. Louis RamsHome-6.50.8-2-5.80.7
5Pittsburgh SteelersJacksonville JaguarsRoad-6.50.6-8-5.60.9
12New Orleans SaintsBaltimore RavensHome-6.52.80.4-5.41.1
16New Orleans SaintsAtlanta FalconsHome-6.52.80.7-5.11.4
4San Francisco 49ersPhiladelphia EaglesHome-65.11.3-6.8-0.8
10Baltimore RavensTennessee TitansHome-60.4-3.3-6.7-0.7
9Kansas City ChiefsNew York JetsHome-60.8-2.6-6.4-0.4
12Chicago BearsTampa Bay BuccaneersHome-61.4-1.9-6.3-0.3
5Philadelphia EaglesSt. Louis RamsHome-61.3-2-6.3-0.3
3Indianapolis ColtsJacksonville JaguarsRoad-61.1-8-6.1-0.1
7Chicago BearsMiami DolphinsHome-61.4-1.5-5.90.1
14Detroit LionsTampa Bay BuccaneersHome-60.9-1.9-5.80.2
13Indianapolis ColtsWashington RedskinsHome-61.1-1.6-5.70.3
10Green Bay PackersChicago BearsHome-63.81.4-5.40.6
6Denver BroncosNew York JetsRoad-65.7-2.6-5.30.7
12New England PatriotsDetroit LionsHome-63.20.9-5.30.7
7Seattle SeahawksSt. Louis RamsRoad-66-2-51
13St. Louis RamsOakland RaidersHome-5.5-2-5.8-6.8-1.3
3Atlanta FalconsTampa Bay BuccaneersHome-5.50.7-1.9-5.6-0.1
13New York GiantsJacksonville JaguarsRoad-5.5-0.3-8-4.70.8
1Kansas City ChiefsTennessee TitansHome-50.8-3.3-7.1-2.1
1Pittsburgh SteelersCleveland BrownsHome-50.6-2.7-6.3-1.3
10Detroit LionsMiami DolphinsHome-50.9-1.5-5.4-0.4
1Seattle SeahawksGreen Bay PackersHome-563.8-5.2-0.2
13Houston TexansTennessee TitansHome-5-1.1-3.3-5.2-0.2
4Houston TexansBuffalo BillsHome-5-1.1-3-4.90.1
4Miami DolphinsOakland RaidersLond-5-1.5-5.8-4.30.7
1New York JetsOakland RaidersHome-4.5-2.6-5.8-6.2-1.7
8Cleveland BrownsOakland RaidersHome-4.5-2.7-5.8-6.1-1.6
3Philadelphia EaglesWashington RedskinsHome-4.51.3-1.6-5.9-1.4
11Green Bay PackersPhiladelphia EaglesHome-4.53.81.3-5.5-1
15Indianapolis ColtsHouston TexansHome-4.51.1-1.1-5.2-0.7
8Dallas CowboysWashington RedskinsHome-4.50.5-1.6-5.1-0.6
8New England PatriotsChicago BearsHome-4.53.21.4-4.8-0.3
11Denver BroncosSt. Louis RamsRoad-4.55.7-2-4.7-0.2
6Philadelphia EaglesNew York GiantsHome-4.51.3-0.3-4.6-0.1
5Seattle SeahawksWashington RedskinsRoad-4.56-1.6-4.6-0.1
5Dallas CowboysHouston TexansHome-4.50.5-1.1-4.6-0.1
1St. Louis RamsMinnesota VikingsHome-4.5-2-3.1-4.10.4
6San Francisco 49ersSt. Louis RamsRoad-4.55.1-2-4.10.4
12Green Bay PackersMinnesota VikingsRoad-4.53.8-3.1-3.90.6
14Chicago BearsDallas CowboysHome-4.51.40.5-3.90.6
15Green Bay PackersBuffalo BillsRoad-4.53.8-3-3.80.7
5San Diego ChargersNew York JetsHome-4-0.4-2.6-5.2-1.2
5New England PatriotsCincinnati BengalsHome-43.21.1-5.1-1.1
10Arizona CardinalsSt. Louis RamsHome-4-0.3-2-4.7-0.7
11New Orleans SaintsCincinnati BengalsHome-42.81.1-4.7-0.7
7Green Bay PackersCarolina PanthersHome-43.82.1-4.7-0.7
16Miami DolphinsMinnesota VikingsHome-4-1.5-3.1-4.6-0.6
12San Diego ChargersSt. Louis RamsHome-4-0.4-2-4.6-0.6
11Carolina PanthersAtlanta FalconsHome-42.10.7-4.4-0.4
6Arizona CardinalsWashington RedskinsHome-4-0.3-1.6-4.3-0.3
1Detroit LionsNew York GiantsHome-40.9-0.3-4.2-0.2
13Atlanta FalconsArizona CardinalsHome-40.7-0.3-40
14Houston TexansJacksonville JaguarsRoad-4-1.1-8-3.90.1
3New York GiantsHouston TexansHome-4-0.3-1.1-3.80.2
12Kansas City ChiefsOakland RaidersRoad-40.8-5.8-3.60.4
8Miami DolphinsJacksonville JaguarsRoad-4-1.5-8-3.50.5
16Chicago BearsDetroit LionsHome-41.40.9-3.50.5
4Pittsburgh SteelersTampa Bay BuccaneersHome-3.50.6-1.9-5.5-2
7Washington RedskinsTennessee TitansHome-3.5-1.6-3.3-4.7-1.2
7Pittsburgh SteelersHouston TexansHome-3.50.6-1.1-4.7-1.2
3Carolina PanthersPittsburgh SteelersHome-3.52.10.6-4.5-1
11Miami DolphinsBuffalo BillsHome-3.5-1.5-3-4.5-1
15New York GiantsWashington RedskinsHome-3.5-0.3-1.6-4.3-0.8
2Carolina PanthersDetroit LionsHome-3.52.10.9-4.2-0.7
15Seattle SeahawksSan Francisco 49ersHome-3.565.1-3.9-0.4
7Dallas CowboysNew York GiantsHome-3.50.5-0.3-3.8-0.3
9Dallas CowboysArizona CardinalsHome-3.50.5-0.3-3.8-0.3
5Carolina PanthersChicago BearsHome-3.52.11.4-3.7-0.2
14New Orleans SaintsCarolina PanthersHome-3.52.82.1-3.7-0.2
13Green Bay PackersNew England PatriotsHome-3.53.83.2-3.6-0.1
3Seattle SeahawksDenver BroncosHome-3.565.7-3.30.2
16Seattle SeahawksArizona CardinalsRoad-3.56-0.3-3.30.2
6New England PatriotsBuffalo BillsRoad-3.53.2-3-3.20.3
15Denver BroncosSan Diego ChargersRoad-3.55.7-0.4-3.10.4
15Atlanta FalconsPittsburgh SteelersHome-3.50.70.6-3.10.4
7Arizona CardinalsOakland RaidersRoad-3.5-0.3-5.8-2.51
1New England PatriotsMiami DolphinsRoad-3.53.2-1.5-1.71.8
1San Francisco 49ersDallas CowboysRoad-3.55.10.5-1.61.9
8Tampa Bay BuccaneersMinnesota VikingsHome-3-1.9-3.1-4.2-1.2
13Baltimore RavensSan Diego ChargersHome-30.4-0.4-3.8-0.8
15Philadelphia EaglesDallas CowboysHome-31.30.5-3.8-0.8
8Cincinnati BengalsBaltimore RavensHome-31.10.4-3.7-0.7
5Indianapolis ColtsBaltimore RavensHome-31.10.4-3.7-0.7
7Denver BroncosSan Francisco 49ersHome-35.75.1-3.6-0.6
14Cincinnati BengalsPittsburgh SteelersHome-31.10.6-3.5-0.5
2Cincinnati BengalsAtlanta FalconsHome-31.10.7-3.4-0.4
2New England PatriotsMinnesota VikingsRoad-33.2-3.1-3.3-0.3
1Arizona CardinalsSan Diego ChargersHome-3-0.3-0.4-3.1-0.1
2New York GiantsArizona CardinalsHome-3-0.3-0.3-30
16New England PatriotsNew York JetsRoad-33.2-2.6-2.80.2
7Baltimore RavensAtlanta FalconsHome-30.40.7-2.70.3
16Green Bay PackersTampa Bay BuccaneersRoad-33.8-1.9-2.70.3
13Detroit LionsChicago BearsHome-30.91.4-2.50.5
11San Francisco 49ersNew York GiantsRoad-35.1-0.3-2.40.6
6Atlanta FalconsChicago BearsHome-30.71.4-2.30.7
13Carolina PanthersMinnesota VikingsRoad-32.1-3.1-2.20.8
13Denver BroncosKansas City ChiefsRoad-35.70.8-1.91.1
16Tennessee TitansJacksonville JaguarsRoad-3-3.3-8-1.71.3
15Chicago BearsNew Orleans SaintsHome-31.42.8-1.61.4
16St. Louis RamsNew York GiantsHome-3-2-0.3-1.31.7
1Houston TexansWashington RedskinsHome-2.5-1.1-1.6-3.5-1
2Seattle SeahawksSan Diego ChargersRoad-2.56-0.4-3.4-0.9
14Washington RedskinsSt. Louis RamsHome-2.5-1.6-2-3.4-0.9
8New York JetsBuffalo BillsHome-2.5-2.6-3-3.4-0.9
11Washington RedskinsTampa Bay BuccaneersHome-2.5-1.6-1.9-3.3-0.8
9Pittsburgh SteelersBaltimore RavensHome-2.50.60.4-3.2-0.7
7Buffalo BillsMinnesota VikingsHome-2.5-3-3.1-3.1-0.6
2Tampa Bay BuccaneersSt. Louis RamsHome-2.5-1.9-2-3.1-0.6
7Indianapolis ColtsCincinnati BengalsHome-2.51.11.1-3-0.5
2Indianapolis ColtsPhiladelphia EaglesHome-2.51.11.3-2.8-0.3
13Buffalo BillsCleveland BrownsHome-2.5-3-2.7-2.7-0.2
12Buffalo BillsNew York JetsHome-2.5-3-2.6-2.6-0.1
2New Orleans SaintsCleveland BrownsRoad-2.52.8-2.7-2.50
16Dallas CowboysIndianapolis ColtsHome-2.50.51.1-2.40.1
5Tennessee TitansCleveland BrownsHome-2.5-3.3-2.7-2.40.1
3San Francisco 49ersArizona CardinalsRoad-2.55.1-0.3-2.40.1
6San Diego ChargersOakland RaidersRoad-2.5-0.4-5.8-2.40.1
6Green Bay PackersMiami DolphinsRoad-2.53.8-1.5-2.30.2
7Cleveland BrownsJacksonville JaguarsRoad-2.5-2.7-8-2.30.2
1Baltimore RavensCincinnati BengalsHome-2.50.41.1-2.30.2
9Carolina PanthersNew Orleans SaintsHome-2.52.12.8-2.30.2
12New York GiantsDallas CowboysHome-2.5-0.30.5-2.20.3
9Cleveland BrownsTampa Bay BuccaneersHome-2.5-2.7-1.9-2.20.3
11Seattle SeahawksKansas City ChiefsRoad-2.560.8-2.20.3
13San Francisco 49ersSeattle SeahawksHome-2.55.16-2.10.4
5New York GiantsAtlanta FalconsHome-2.5-0.30.7-20.5
8New Orleans SaintsGreen Bay PackersHome-2.52.83.8-20.5
9Miami DolphinsSan Diego ChargersHome-2.5-1.5-0.4-1.90.6
11Arizona CardinalsDetroit LionsHome-2.5-0.30.9-1.80.7
2Houston TexansOakland RaidersRoad-2.5-1.1-5.8-1.70.8
2Dallas CowboysTennessee TitansRoad-2.50.5-3.3-0.81.7
13Pittsburgh SteelersNew Orleans SaintsHome-2.50.62.8-0.81.7
2Baltimore RavensPittsburgh SteelersHome-20.40.6-2.8-0.8
14Minnesota VikingsNew York JetsHome-2-3.1-2.6-2.5-0.5
8Pittsburgh SteelersIndianapolis ColtsHome-20.61.1-2.5-0.5
6Cincinnati BengalsCarolina PanthersHome-21.12.1-20
14Arizona CardinalsKansas City ChiefsHome-2-0.30.8-1.90.1
7San Diego ChargersKansas City ChiefsHome-2-0.40.8-1.80.2
8Arizona CardinalsPhiladelphia EaglesHome-2-0.31.3-1.40.6
1Carolina PanthersTampa Bay BuccaneersRoad-22.1-1.9-11
11Pittsburgh SteelersTennessee TitansRoad-20.6-3.3-0.91.1
10Kansas City ChiefsBuffalo BillsRoad-20.8-3-0.81.2
10Pittsburgh SteelersNew York JetsRoad-20.6-2.6-0.21.8
16Pittsburgh SteelersKansas City ChiefsHome-1.50.60.8-2.8-1.3
15Tennessee TitansNew York JetsHome-1.5-3.3-2.6-2.3-0.8
13Dallas CowboysPhiladelphia EaglesHome-1.50.51.3-2.2-0.7
4Washington RedskinsNew York GiantsHome-1.5-1.6-0.3-1.7-0.2
16Denver BroncosCincinnati BengalsRoad-1.55.71.1-1.6-0.1
9Minnesota VikingsWashington RedskinsHome-1.5-3.1-1.6-1.50
11Cleveland BrownsHouston TexansHome-1.5-2.7-1.1-1.40.1
7Detroit LionsNew Orleans SaintsHome-1.50.92.8-1.10.4
8Seattle SeahawksCarolina PanthersRoad-1.562.1-0.90.6
15Cincinnati BengalsCleveland BrownsRoad-1.51.1-2.7-0.80.7
10New Orleans SaintsSan Francisco 49ersHome-1.52.85.1-0.70.8
4Chicago BearsGreen Bay PackersHome-1.51.43.8-0.60.9
16Philadelphia EaglesWashington RedskinsRoad-1.51.3-1.60.11.6
10Philadelphia EaglesCarolina PanthersHome-11.32.1-2.2-1.2
13New York JetsMiami DolphinsHome-1-2.6-1.5-1.9-0.9
14Seattle SeahawksPhiladelphia EaglesRoad-161.3-1.7-0.7
9New York GiantsIndianapolis ColtsHome-1-0.31.1-1.6-0.6
16Houston TexansBaltimore RavensHome-1-1.10.4-1.5-0.5
2Buffalo BillsMiami DolphinsHome-1-3-1.5-1.5-0.5
15St. Louis RamsArizona CardinalsHome-1-2-0.3-1.3-0.3
4Baltimore RavensCarolina PanthersHome-10.42.1-1.3-0.3
6Detroit LionsMinnesota VikingsRoad-10.9-3.1-10
11Indianapolis ColtsNew England PatriotsHome-11.13.2-0.90.1
1Atlanta FalconsNew Orleans SaintsHome-10.72.8-0.90.1
4Atlanta FalconsMinnesota VikingsRoad-10.7-3.1-0.80.2
6Houston TexansIndianapolis ColtsHome-1-1.11.1-0.80.2
14Indianapolis ColtsCleveland BrownsRoad-11.1-2.7-0.80.2
6Tampa Bay BuccaneersBaltimore RavensHome-1-1.90.4-0.70.3
14New England PatriotsSan Diego ChargersRoad-13.2-0.4-0.60.4
4Kansas City ChiefsNew England PatriotsHome-10.83.2-0.60.4
4Detroit LionsNew York JetsRoad-10.9-2.6-0.50.5
9New England PatriotsDenver BroncosHome-13.25.7-0.50.5
3Buffalo BillsSan Diego ChargersHome-1-3-0.4-0.40.6
8Detroit LionsAtlanta FalconsLond-10.90.7-0.20.8
14New York GiantsTennessee TitansRoad-1-0.3-3.301
3Green Bay PackersDetroit LionsRoad-13.80.90.11.1
16Buffalo BillsOakland RaidersRoad-1-3-5.80.21.2
14Miami DolphinsBaltimore RavensHome0-1.50.4-1.1-1.1
3Chicago BearsNew York JetsRoad01.4-2.6-1-1
12Houston TexansCincinnati BengalsHome0-1.11.1-0.8-0.8
8Tennessee TitansHouston TexansHome0-3.3-1.1-0.8-0.8
4Dallas CowboysNew Orleans SaintsHome00.52.8-0.7-0.7
3Miami DolphinsKansas City ChiefsHome0-1.50.8-0.7-0.7
9Houston TexansPhiladelphia EaglesHome0-1.11.3-0.6-0.6
3St. Louis RamsDallas CowboysHome0-20.5-0.5-0.5
10Tampa Bay BuccaneersAtlanta FalconsHome0-1.90.7-0.4-0.4
6Pittsburgh SteelersCleveland BrownsRoad00.6-2.7-0.3-0.3
3Baltimore RavensCleveland BrownsRoad00.4-2.7-0.1-0.1
13Cincinnati BengalsTampa Bay BuccaneersRoad01.1-1.900
13Tampa Bay BuccaneersCincinnati BengalsHome0-1.91.100
3Cleveland BrownsBaltimore RavensHome0-2.70.40.10.1
6Cleveland BrownsPittsburgh SteelersHome0-2.70.60.30.3
10Atlanta FalconsTampa Bay BuccaneersRoad00.7-1.90.40.4
3Dallas CowboysSt. Louis RamsRoad00.5-20.50.5
9Philadelphia EaglesHouston TexansRoad01.3-1.10.60.6
3Kansas City ChiefsMiami DolphinsRoad00.8-1.50.70.7
4New Orleans SaintsDallas CowboysRoad02.80.50.70.7
8Houston TexansTennessee TitansRoad0-1.1-3.30.80.8
12Cincinnati BengalsHouston TexansRoad01.1-1.10.80.8
3New York JetsChicago BearsHome0-2.61.411
14Baltimore RavensMiami DolphinsRoad00.4-1.51.11.1
16Oakland RaidersBuffalo BillsHome1-5.8-3-0.2-1.2
3Detroit LionsGreen Bay PackersHome10.93.8-0.1-1.1
14Tennessee TitansNew York GiantsHome1-3.3-0.30-1
8Atlanta FalconsDetroit LionsLond10.70.90.2-0.8
3San Diego ChargersBuffalo BillsRoad1-0.4-30.4-0.6
4New York JetsDetroit LionsHome1-2.60.90.5-0.5
9Denver BroncosNew England PatriotsRoad15.73.20.5-0.5
14San Diego ChargersNew England PatriotsHome1-0.43.20.6-0.4
4New England PatriotsKansas City ChiefsRoad13.20.80.6-0.4
6Baltimore RavensTampa Bay BuccaneersRoad10.4-1.90.7-0.3
14Cleveland BrownsIndianapolis ColtsHome1-2.71.10.8-0.2
4Minnesota VikingsAtlanta FalconsHome1-3.10.70.8-0.2
6Indianapolis ColtsHouston TexansRoad11.1-1.10.8-0.2
11New England PatriotsIndianapolis ColtsRoad13.21.10.9-0.1
1New Orleans SaintsAtlanta FalconsRoad12.80.70.9-0.1
6Minnesota VikingsDetroit LionsHome1-3.10.910
4Carolina PanthersBaltimore RavensRoad12.10.41.30.3
15Arizona CardinalsSt. Louis RamsRoad1-0.3-21.30.3
2Miami DolphinsBuffalo BillsRoad1-1.5-31.50.5
16Baltimore RavensHouston TexansRoad10.4-1.11.50.5
9Indianapolis ColtsNew York GiantsRoad11.1-0.31.60.6
14Philadelphia EaglesSeattle SeahawksHome11.361.70.7
13Miami DolphinsNew York JetsRoad1-1.5-2.61.90.9
10Carolina PanthersPhiladelphia EaglesRoad12.11.32.21.2
16Washington RedskinsPhiladelphia EaglesHome1.5-1.61.3-0.1-1.6
4Green Bay PackersChicago BearsRoad1.53.81.40.6-0.9
10San Francisco 49ersNew Orleans SaintsRoad1.55.12.80.7-0.8
15Cleveland BrownsCincinnati BengalsHome1.5-2.71.10.8-0.7
8Carolina PanthersSeattle SeahawksHome1.52.160.9-0.6
7New Orleans SaintsDetroit LionsRoad1.52.80.91.1-0.4
11Houston TexansCleveland BrownsRoad1.5-1.1-2.71.4-0.1
9Washington RedskinsMinnesota VikingsRoad1.5-1.6-3.11.50
16Cincinnati BengalsDenver BroncosHome1.51.15.71.60.1
4New York GiantsWashington RedskinsRoad1.5-0.3-1.61.70.2
13Philadelphia EaglesDallas CowboysRoad1.51.30.52.20.7
15New York JetsTennessee TitansRoad1.5-2.6-3.32.30.8
16Kansas City ChiefsPittsburgh SteelersRoad1.50.80.62.81.3
10New York JetsPittsburgh SteelersHome2-2.60.60.2-1.8
10Buffalo BillsKansas City ChiefsHome2-30.80.8-1.2
11Tennessee TitansPittsburgh SteelersHome2-3.30.60.9-1.1
1Tampa Bay BuccaneersCarolina PanthersHome2-1.92.11-1
8Philadelphia EaglesArizona CardinalsRoad21.3-0.31.4-0.6
7Kansas City ChiefsSan Diego ChargersRoad20.8-0.41.8-0.2
14Kansas City ChiefsArizona CardinalsRoad20.8-0.31.9-0.1
6Carolina PanthersCincinnati BengalsRoad22.11.120
14New York JetsMinnesota VikingsRoad2-2.6-3.12.50.5
8Indianapolis ColtsPittsburgh SteelersRoad21.10.62.50.5
2Pittsburgh SteelersBaltimore RavensRoad20.60.42.80.8
2Tennessee TitansDallas CowboysHome2.5-3.30.50.8-1.7
13New Orleans SaintsPittsburgh SteelersRoad2.52.80.60.8-1.7
2Oakland RaidersHouston TexansHome2.5-5.8-1.11.7-0.8
11Detroit LionsArizona CardinalsRoad2.50.9-0.31.8-0.7
9San Diego ChargersMiami DolphinsRoad2.5-0.4-1.51.9-0.6
5Atlanta FalconsNew York GiantsRoad2.50.7-0.32-0.5
8Green Bay PackersNew Orleans SaintsRoad2.53.82.82-0.5
13Seattle SeahawksSan Francisco 49ersRoad2.565.12.1-0.4
12Dallas CowboysNew York GiantsRoad2.50.5-0.32.2-0.3
9Tampa Bay BuccaneersCleveland BrownsRoad2.5-1.9-2.72.2-0.3
11Kansas City ChiefsSeattle SeahawksHome2.50.862.2-0.3
1Cincinnati BengalsBaltimore RavensRoad2.51.10.42.3-0.2
6Miami DolphinsGreen Bay PackersHome2.5-1.53.82.3-0.2
7Jacksonville JaguarsCleveland BrownsHome2.5-8-2.72.3-0.2
9New Orleans SaintsCarolina PanthersRoad2.52.82.12.3-0.2
6Oakland RaidersSan Diego ChargersHome2.5-5.8-0.42.4-0.1
16Indianapolis ColtsDallas CowboysRoad2.51.10.52.4-0.1
3Arizona CardinalsSan Francisco 49ersHome2.5-0.35.12.4-0.1
5Cleveland BrownsTennessee TitansRoad2.5-2.7-3.32.4-0.1
2Cleveland BrownsNew Orleans SaintsHome2.5-2.72.82.50
12New York JetsBuffalo BillsRoad2.5-2.6-32.60.1
13Cleveland BrownsBuffalo BillsRoad2.5-2.7-32.70.2
2Philadelphia EaglesIndianapolis ColtsRoad2.51.31.12.80.3
7Cincinnati BengalsIndianapolis ColtsRoad2.51.11.130.5
2St. Louis RamsTampa Bay BuccaneersRoad2.5-2-1.93.10.6
7Minnesota VikingsBuffalo BillsRoad2.5-3.1-33.10.6
9Baltimore RavensPittsburgh SteelersRoad2.50.40.63.20.7
11Tampa Bay BuccaneersWashington RedskinsRoad2.5-1.9-1.63.30.8
8Buffalo BillsNew York JetsRoad2.5-3-2.63.40.9
14St. Louis RamsWashington RedskinsRoad2.5-2-1.63.40.9
2San Diego ChargersSeattle SeahawksHome2.5-0.463.40.9
1Washington RedskinsHouston TexansRoad2.5-1.6-1.13.51
16New York GiantsSt. Louis RamsRoad3-0.3-21.3-1.7
15New Orleans SaintsChicago BearsRoad32.81.41.6-1.4
16Jacksonville JaguarsTennessee TitansHome3-8-3.31.7-1.3
13Kansas City ChiefsDenver BroncosHome30.85.71.9-1.1
13Minnesota VikingsCarolina PanthersHome3-3.12.12.2-0.8
6Chicago BearsAtlanta FalconsRoad31.40.72.3-0.7
11New York GiantsSan Francisco 49ersHome3-0.35.12.4-0.6
13Chicago BearsDetroit LionsRoad31.40.92.5-0.5
7Atlanta FalconsBaltimore RavensRoad30.70.42.7-0.3
16Tampa Bay BuccaneersGreen Bay PackersHome3-1.93.82.7-0.3
16New York JetsNew England PatriotsHome3-2.63.22.8-0.2
2Arizona CardinalsNew York GiantsRoad3-0.3-0.330
1San Diego ChargersArizona CardinalsRoad3-0.4-0.33.10.1
2Minnesota VikingsNew England PatriotsHome3-3.13.23.30.3
2Atlanta FalconsCincinnati BengalsRoad30.71.13.40.4
14Pittsburgh SteelersCincinnati BengalsRoad30.61.13.50.5
7San Francisco 49ersDenver BroncosRoad35.15.73.60.6
5Baltimore RavensIndianapolis ColtsRoad30.41.13.70.7
8Baltimore RavensCincinnati BengalsRoad30.41.13.70.7
13San Diego ChargersBaltimore RavensRoad3-0.40.43.80.8
15Dallas CowboysPhiladelphia EaglesRoad30.51.33.80.8
8Minnesota VikingsTampa Bay BuccaneersRoad3-3.1-1.94.21.2
1Dallas CowboysSan Francisco 49ersHome3.50.55.11.6-1.9
1Miami DolphinsNew England PatriotsHome3.5-1.53.21.7-1.8
7Oakland RaidersArizona CardinalsHome3.5-5.8-0.32.5-1
15San Diego ChargersDenver BroncosHome3.5-0.45.73.1-0.4
15Pittsburgh SteelersAtlanta FalconsRoad3.50.60.73.1-0.4
6Buffalo BillsNew England PatriotsHome3.5-33.23.2-0.3
3Denver BroncosSeattle SeahawksRoad3.55.763.3-0.2
16Arizona CardinalsSeattle SeahawksHome3.5-0.363.3-0.2
13New England PatriotsGreen Bay PackersRoad3.53.23.83.60.1
14Carolina PanthersNew Orleans SaintsRoad3.52.12.83.70.2
5Chicago BearsCarolina PanthersRoad3.51.42.13.70.2
9Arizona CardinalsDallas CowboysRoad3.5-0.30.53.80.3
7New York GiantsDallas CowboysRoad3.5-0.30.53.80.3
15San Francisco 49ersSeattle SeahawksRoad3.55.163.90.4
2Detroit LionsCarolina PanthersRoad3.50.92.14.20.7
15Washington RedskinsNew York GiantsRoad3.5-1.6-0.34.30.8
11Buffalo BillsMiami DolphinsRoad3.5-3-1.54.51
3Pittsburgh SteelersCarolina PanthersRoad3.50.62.14.51
7Tennessee TitansWashington RedskinsRoad3.5-3.3-1.64.71.2
7Houston TexansPittsburgh SteelersRoad3.5-1.10.64.71.2
4Tampa Bay BuccaneersPittsburgh SteelersRoad3.5-1.90.65.52
16Detroit LionsChicago BearsRoad40.91.43.5-0.5
8Jacksonville JaguarsMiami DolphinsHome4-8-1.53.5-0.5
12Oakland RaidersKansas City ChiefsHome4-5.80.83.6-0.4
3Houston TexansNew York GiantsRoad4-1.1-0.33.8-0.2
14Jacksonville JaguarsHouston TexansHome4-8-1.13.9-0.1
13Arizona CardinalsAtlanta FalconsRoad4-0.30.740
1New York GiantsDetroit LionsRoad4-0.30.94.20.2
6Washington RedskinsArizona CardinalsRoad4-1.6-0.34.30.3
11Atlanta FalconsCarolina PanthersRoad40.72.14.40.4
16Minnesota VikingsMiami DolphinsRoad4-3.1-1.54.60.6
12St. Louis RamsSan Diego ChargersRoad4-2-0.44.60.6
7Carolina PanthersGreen Bay PackersRoad42.13.84.70.7
10St. Louis RamsArizona CardinalsRoad4-2-0.34.70.7
11Cincinnati BengalsNew Orleans SaintsRoad41.12.84.70.7
5Cincinnati BengalsNew England PatriotsRoad41.13.25.11.1
5New York JetsSan Diego ChargersRoad4-2.6-0.45.21.2
15Buffalo BillsGreen Bay PackersHome4.5-33.83.8-0.7
14Dallas CowboysChicago BearsRoad4.50.51.43.9-0.6
12Minnesota VikingsGreen Bay PackersHome4.5-3.13.83.9-0.6
6St. Louis RamsSan Francisco 49ersHome4.5-25.14.1-0.4
1Minnesota VikingsSt. Louis RamsRoad4.5-3.1-24.1-0.4
6New York GiantsPhiladelphia EaglesRoad4.5-0.31.34.60.1
5Houston TexansDallas CowboysRoad4.5-1.10.54.60.1
5Washington RedskinsSeattle SeahawksHome4.5-1.664.60.1
11St. Louis RamsDenver BroncosHome4.5-25.74.70.2
8Chicago BearsNew England PatriotsRoad4.51.43.24.80.3
8Washington RedskinsDallas CowboysRoad4.5-1.60.55.10.6
15Houston TexansIndianapolis ColtsRoad4.5-1.11.15.20.7
11Philadelphia EaglesGreen Bay PackersRoad4.51.33.85.51
3Washington RedskinsPhiladelphia EaglesRoad4.5-1.61.35.91.4
8Oakland RaidersCleveland BrownsRoad4.5-5.8-2.76.11.6
1Oakland RaidersNew York JetsRoad4.5-5.8-2.66.21.7
4Oakland RaidersMiami DolphinsLond5-5.8-1.54.3-0.7
4Buffalo BillsHouston TexansRoad5-3-1.14.9-0.1
1Green Bay PackersSeattle SeahawksRoad53.865.20.2
13Tennessee TitansHouston TexansRoad5-3.3-1.15.20.2
10Miami DolphinsDetroit LionsRoad5-1.50.95.40.4
1Cleveland BrownsPittsburgh SteelersRoad5-2.70.66.31.3
1Tennessee TitansKansas City ChiefsRoad5-3.30.87.12.1
13Jacksonville JaguarsNew York GiantsHome5.5-8-0.34.7-0.8
3Tampa Bay BuccaneersAtlanta FalconsRoad5.5-1.90.75.60.1
13Oakland RaidersSt. Louis RamsRoad5.5-5.8-26.81.3
7St. Louis RamsSeattle SeahawksHome6-265-1
6New York JetsDenver BroncosHome6-2.65.75.3-0.7
12Detroit LionsNew England PatriotsRoad60.93.25.3-0.7
10Chicago BearsGreen Bay PackersRoad61.43.85.4-0.6
13Washington RedskinsIndianapolis ColtsRoad6-1.61.15.7-0.3
14Tampa Bay BuccaneersDetroit LionsRoad6-1.90.95.8-0.2
7Miami DolphinsChicago BearsRoad6-1.51.45.9-0.1
3Jacksonville JaguarsIndianapolis ColtsHome6-81.16.10.1
12Tampa Bay BuccaneersChicago BearsRoad6-1.91.46.30.3
5St. Louis RamsPhiladelphia EaglesRoad6-21.36.30.3
9New York JetsKansas City ChiefsRoad6-2.60.86.40.4
10Tennessee TitansBaltimore RavensRoad6-3.30.46.70.7
4Philadelphia EaglesSan Francisco 49ersRoad61.35.16.80.8
16Atlanta FalconsNew Orleans SaintsRoad6.50.72.85.1-1.4
12Baltimore RavensNew Orleans SaintsRoad6.50.42.85.4-1.1
5Jacksonville JaguarsPittsburgh SteelersHome6.5-80.65.6-0.9
8St. Louis RamsKansas City ChiefsRoad6.5-20.85.8-0.7
14Atlanta FalconsGreen Bay PackersRoad6.50.73.86.1-0.4
10Cleveland BrownsCincinnati BengalsRoad6.5-2.71.16.80.3
15Tampa Bay BuccaneersCarolina PanthersRoad6.5-1.92.170.5
1Buffalo BillsChicago BearsRoad6.5-31.47.40.9
15Miami DolphinsNew England PatriotsRoad6.5-1.53.27.71.2
12Cleveland BrownsAtlanta FalconsRoad7-2.70.76.4-0.6
2Chicago BearsSan Francisco 49ersRoad71.45.16.7-0.3
15Minnesota VikingsDetroit LionsRoad7-3.10.970
5Kansas City ChiefsSan Francisco 49ersRoad70.85.17.30.3
3Tennessee TitansCincinnati BengalsRoad7-3.31.17.40.4
11Minnesota VikingsChicago BearsRoad7-3.11.47.50.5
12Tennessee TitansPhiladelphia EaglesRoad7-3.31.37.60.6
1Indianapolis ColtsDenver BroncosRoad71.15.77.60.6
6Jacksonville JaguarsTennessee TitansRoad7-8-3.37.70.7
2Kansas City ChiefsDenver BroncosRoad70.85.77.90.9
14Oakland RaidersSan Francisco 49ersHome7-5.85.17.90.9
16San Diego ChargersSan Francisco 49ersRoad7-0.45.18.51.5
5Buffalo BillsDetroit LionsRoad7.5-30.96.9-0.6
4Tennessee TitansIndianapolis ColtsRoad7.5-3.31.17.4-0.1
5Tampa Bay BuccaneersNew Orleans SaintsRoad7.5-1.92.87.70.2
16Cleveland BrownsCarolina PanthersRoad7.5-2.72.17.80.3
6Dallas CowboysSeattle SeahawksRoad7.50.568.51
7New York JetsNew England PatriotsRoad7.5-2.63.28.81.3
11Oakland RaidersSan Diego ChargersRoad8-5.8-0.48.40.4
8San Diego ChargersDenver BroncosRoad8.5-0.45.79.10.6
2New York JetsGreen Bay PackersRoad8.5-2.63.89.40.9
15Oakland RaidersKansas City ChiefsRoad8.5-5.80.89.61.1
12Washington RedskinsSan Francisco 49ersRoad8.5-1.65.19.71.2
5Arizona CardinalsDenver BroncosRoad9-0.35.790
2Jacksonville JaguarsWashington RedskinsRoad9-8-1.69.40.4
10Oakland RaidersDenver BroncosHome10-5.85.78.5-1.5
10Jacksonville JaguarsDallas CowboysLond10-80.58.5-1.5
3Minnesota VikingsNew Orleans SaintsRoad10-3.12.88.9-1.1
10New York GiantsSeattle SeahawksRoad10-0.369.3-0.7
5Minnesota VikingsGreen Bay PackersRoad10-3.13.89.9-0.1
12Miami DolphinsDenver BroncosRoad10-1.55.710.20.2
4Jacksonville JaguarsSan Diego ChargersRoad10-8-0.410.60.6
12Arizona CardinalsSeattle SeahawksRoad10.5-0.369.3-1.2
15Jacksonville JaguarsBaltimore RavensRoad10.5-80.411.40.9
9St. Louis RamsSan Francisco 49ersRoad11-25.110.1-0.9
9Jacksonville JaguarsCincinnati BengalsRoad11-81.112.11.1
1Jacksonville JaguarsPhiladelphia EaglesRoad11-81.312.31.3
14Buffalo BillsDenver BroncosRoad11.5-35.711.70.2
12Jacksonville JaguarsIndianapolis ColtsRoad12-81.112.10.1
3Oakland RaidersNew England PatriotsRoad13-5.83.212-1
9Oakland RaidersSeattle SeahawksRoad14.5-5.8614.80.3

Some thoughts:

  • The biggest outlier games are again in week 1; as Jason Lisk noted when he ran a similar study last year, the lines build in some risk of injury (or simply risk of not knowing what’s going to happen in the future): if Aaron Rodgers or Peyton Manning miss time with an injury, it’s more likely to be later in the season than in week one. Additionally, if Vegas feels more confident in the early games than the late games, that will lead to some games appearing as outliers in week 1.
  • The weirdest line of the season is Tennessee/Kansas City in week 1.  The Chiefs are only 5-point home favorites: that’s 2.1 points lower than we would expect given the location of the game and the ratings of Kansas City (+0.8) and Tennessee (-3.3).
  • As a reminder, here’s a link to the 2014 schedule grid I created; I did not assign 3 points to the home team in the three London games this year.
  • For the second straight year, the Seahawks are underdogs just once: the game in San Francisco. Denver is an underdog when it travels to Seattle and Foxboro, and every other team is a dog in at least three games.
  • Oakland and Jacksonville are underdogs in each of their 15 games. Considering Oakland travels to Denver in week 17, we can safely say the Raiders and Jags are projected underdogs in every game this year.

References

References
1 Just to be clear, this analysis includes 3 points for each home team except in the London games, so these are more accurately thought of as location-adjusted expected margins of victory.
{ 4 comments }

Okay, that title could be the opener to any number of jokes. But I mean “strange season” in the way Football Perspective has used the phrase before. Take a look at Cleveland’s schedule and results from 2013:

Score
Week Day Date Rec Opp Tm Opp
1 Sun September 8 boxscore L 0-1 Miami Dolphins 10 23
2 Sun September 15 boxscore L 0-2 @ Baltimore Ravens 6 14
3 Sun September 22 boxscore W 1-2 @ Minnesota Vikings 31 27
4 Sun September 29 boxscore W 2-2 Cincinnati Bengals 17 6
5 Thu October 3 boxscore W 3-2 Buffalo Bills 37 24
6 Sun October 13 boxscore L 3-3 Detroit Lions 17 31
7 Sun October 20 boxscore L 3-4 @ Green Bay Packers 13 31
8 Sun October 27 boxscore L 3-5 @ Kansas City Chiefs 17 23
9 Sun November 3 boxscore W 4-5 Baltimore Ravens 24 18
10 Bye Week
11 Sun November 17 boxscore L 4-6 @ Cincinnati Bengals 20 41
12 Sun November 24 boxscore L 4-7 Pittsburgh Steelers 11 27
13 Sun December 1 boxscore L 4-8 Jacksonville Jaguars 28 32
14 Sun December 8 boxscore L 4-9 @ New England Patriots 26 27
15 Sun December 15 boxscore L 4-10 Chicago Bears 31 38
16 Sun December 22 boxscore L 4-11 @ New York Jets 13 24
17 Sun December 29 boxscore L 4-12 @ Pittsburgh Steelers 7 20

[continue reading…]

{ 3 comments }

Austin and the Rams blew out the Colts

Austin and the Rams were nonconformists.

In week 10 of the 2013 season, the Rams traveled to Indianapolis. By the end of the season, St. Louis had an SRS grade of +2.2, meaning they were 2.2 points better than average. The Colts finished 2013 with an SRS grade of +4.1; if you award three points for home field, we would expect Indianapolis to have defeated St. Louis by 4.8 points (the Colts, in fact, were 9-point favorites). What happened? You probably remember: Tavon Austin had a record-setting day, the Rams jumped out to a 28-0 halftime lead, and Andrew Luck wasn’t able to mount one of his patented comebacks. St. Louis posted a Game Script of 23.2, the second largest result of the season, en route to a 38-8 victory.

Instead of a 4.8-point loss, the Rams won by 30 points. That difference of 34.8 points made it the least-conforming game of the 2013 season. What was the most? In week 6, the Chiefs (SRS of +6.1) hosted the Raiders (SRS of -8.0) and won, 24-7.

The table below shows every regular season game in 2013.  The “Boxscore” cell is linked to the boxscore for that game on PFR, the “Exp” column shows the expected result, and the “Diff” column — by which the table is sorted — shows the difference between the expected result and the actual result. [continue reading…]

{ 4 comments }

The Best Scoring Offenses Since 1932

Denver had one of the greatest offenses ever

Denver had one of the greatest offenses ever.

On Monday, I looked at the greatest defenses — measured simply by points allowed and adjusted for strength of schedule — in NFL history. Today, I want to look at which offenses were the greatest in regular season history, and see where the 2013 Broncos stack up.

As noted in the post on defenses, during Super Bowl week, Bill Barnwell’s article ranked Denver’s 2013 offense as the greatest scoring machine ever. He used the statistical measurement known as the Z-Score to show that Denver’s offense was 3.3 standard deviations above average, and no offense had ever been 3.3 standard deviations above average before.

Where does that 3.3 number come from? Denver averaged 37.9 points per game during the regular season. The league average was 23.4 points, which means that Denver’s offense was 14.5 PPG better than average. The standard deviation of points per game among the 32 NFL offenses in 2013 was 4.36 points; therefore, Denver gets a Z-score of 3.32, because the Broncos scored points at a rate that was 3.32 standard deviations better than the mean. [continue reading…]

{ 8 comments }

The Best Scoring Defenses In NFL History

Head of the LOB

Head of the LOB.

Congratulations to the Seattle Seahawks and their fans on winning Super Bowl XLVIII. With the win, Seattle has confirmed its status as one of the greatest defenses in NFL history. The Seahawks defense produced a game for the ages on Sunday: facing Peyton Manning, Demaryius Thomas, and one of the greatest offenses ever, Seattle’s defense outscored Denver’s offense, 9-8. Led by Malcolm Smith, Cliff Avril, Kam Chancellor, Earl Thomas and Richard Sherman, the Seahawks stamped their claim with the ’85 Bears, ’00 Ravens, and ’02 Bucs as one of the greatest defenses of the last 30 years.

But today, I want to look at which defenses were the best in regular season history, and see where Seattle stacks up. Bill Barnwell had an interesting post during Super Bowl week. He used the statistical measurement known as the Z-Score to show that Seattle was the tenth best defensive scoring team in NFL history. Don’t be too confused by the idea of a Z-score: in English, this just means that Seattle’s defense — and yes, I am going to conflate the concepts of defense and points allowed throughout this post — was 2.2 standard deviations above average in points allowed, one of just ten teams to ever produce such a result.

So how do we get there? Well, Seattle allowed 14.4 points per game during the regular season. The league average was 23.4 points, which means that Seattle’s defense was 9.0 PPG better than average. The standard deviation of points per game among the 32 NFL defenses in 2013 was 4.08 points per game; therefore, Seattle has a Z-score of 2.20, because the Seahawks allowed points at a rate that was 2.20 standard deviations better than the mean.

Today, I wanted to do the same analysis but adjust for strength of schedule, by deriving offensive and defensive SRS grades. Of course, Pro-Football-Reference has published offensive and defensive SRS grades for awhile, but I decided to crunch the numbers on my own and see if they matched up with what Neil and Mike did (they did). For the uninitiated, SRS stands for Simple Rating System, which is simple to understand but a bit complicated to derive. The SRS is simply margin of victory (or, in the case of offenses and defenses, margin of production above league average) adjusted for strength of schedule. The key is using an iterative process, where, in Excel, we adjust the ratings hundreds of times; after all, to adjust for SOS, you have to adjust for the SOS of each opponent, and the SOS of each opponent’s opponent, and so on.

The table below shows the top 200 scoring defenses since 1932. Here’s how to read the 2002 Bucs line. That season, Tampa Bay allowed 9.4 points per game less than league average. The average defense the Bucs faced — using the iterative method to derive SOS grades — was 0.4 points above average. Therefore, Tampa Bay is credited with an adjusted rating of 9.8 PPG better average. The standard deviation of defensive ratings in the NFL in 2002 was 3.45, giving the Buccaneers a Z-score of 2.83, the highest ever. The table below is fully sortable and searchable, and shows the top 200 defenses. [continue reading…]

{ 35 comments }

Love the Bowl Championship Series or (more likely) hate it, tonight marks the end of college football’s 16-year BCS experiment. Designed to bring some measure of order to the chaotic state college football had been in under the Bowl Alliance/Coalition, the BCS did streamline the process of determining a national champion — though it was obviously not without its share of controversies either.

If various opinion polls conducted over the years are any indication, the public is ready to move on from the BCS to next season’s “plus-one”-style playoff system. But before it bids farewell forever, how does the BCS grade out relative to other playoff systems in terms of selecting the best team as a champion?

Back in 2008, I concluded that it didn’t really do much worse of a job than a plus-one system would have. But that was more of an unscientific survey of the 1992-2007 seasons than a truly rigorous study. Today, I plan to take a page from Doug’s book and use the power of Monte Carlo simulation to determine which playoff system sees the true best team win the national title most often.

(Note: If you just want the results and don’t want to get bogged down in the details, feel free to skip the next section.) [continue reading…]

{ 21 comments }

The Simple Rating System is a many-splendored thing, but a known bug of the process is that huge outlier scoring margins can have undue influence on the rankings. Take the 2009 NFL season, for instance, during which the Patriots led the NFL in SRS in no small part because they annihilated the Titans 59-0 in a snowy October game that tied for the second-most lopsided margin of victory in NFL history. Outside of that single game, the Patriots’ PPG margin was +5.2, which wouldn’t have even ranked among the league’s top ten teams, but the SRS (particularly because it minimizes squared prediction errors between actual outcomes and those expected from team ratings) gave the 59-0 win a lot of weight, enough to propel New England to the #1 ranking. (A placement that looked downright laughable, I might add, when the Pats were crushed at home by Baltimore on Wild Card Weekend.)

One solution that is commonly proposed for this problem is to cap the margin of victory in a given game at a certain fixed number. This is especially popular in college football (in fact, Chase sort of uses a cap in his college SRS variant) because nonconference schedules will often see matchups between teams of incredibly disparate talent levels, games in which the powerhouse team can essentially choose the margin by which they want to steamroll their opponent. Within that context, it doesn’t really matter whether Florida State beats Idaho by 46 or by 66, because there’s a 0% chance Idaho is a better team than FSU — no new information is conveyed when they pile more and more points onto the game’s margin.

But what’s the right number to cap margin of victory at in the NFL? These are all professional teams, after all, so there’s plenty of evidence that in the NFL, blowing opponents out — even when they’re bad teams — says a lot about how good you are. Where do we draw the line, then, to find the point at which a team has clearly proven they’re better than the opponent, beyond which any extra MOV stops giving us information?

[continue reading…]

{ 11 comments }

Let’s just assume that Auburn defeats Missouri this afternoon and Ohio State defeats Michigan State tonight. Which team would have pulled off the more impressive feat: Ohio State, going undefeated against a relatively easy schedule, or Auburn going 12-1 against a harder schedule? That’s a tricky question to answer, but here is one way to think about it.

To make the math easier for everyone — and the answer won’t be practically different otherwise — let’s eliminate the eight easiest games on each team’s schedule. For Ohio State, that means elminating wins over Florida A&M, Purdue, San Diego State, California, Buffalo, Illinois, Penn State, and Indiana. For Auburn, we remove wins over Western Carolina, Arkansas State, Florida Atlantic, Arkansas, Mississippi State, Washington State, Tennessee, and Mississippi. A team arguing that it should be the #2 team in the country is going to win those games over 95% of the time. Granted, this slightly disadvantages the Tigers as they had a slightly harder bottom eight, but you can include those games if you want to do more heavy lifting. For now, let’s just focus on each team’s toughest five games.

Ohio State will have gone undefeated against Wisconsin, Michigan State, Michigan, Iowa, and Northwestern. Is that more or less impressive than going 4-1 against Alabama, Missouri, LSU, Texas A&M, and Georgia? One way to can answer this question is by looking at a team’s win probability in each game.

Let’s assume that Ohio State has an SRS rating of 62.1. Why that number? You’ll see why in a minute. When the Buckeyes hosted the Badgers (SRS of 53.8), how likely was Ohio State to win? If we give three points for home field, that would make the Buckeyes 11.3-point favorites. And we can use the following formula to determine how likely an 11.3-point favorite is to win a given game:

(1-NORMDIST(0.5,-(home_fav),13.86,TRUE)) + 0.5*(NORMDIST(0.5,-(home_fav),13.86,TRUE) – NORMDIST(-0.5,-(home_fav),13.86,TRUE))

Based on this formula, an 11.3-point favorite would win 79.2% of the time. Against Michigan State (48.8), Ohio State would be a 13.3 point favorite if the Buckeyes had an SRS rating of 62.1, which translates into an 83.1% win probability. For Michigan, Iowa, and Northwestern, the spreads and win probabilities would be 15.4/86.7%, 20.3/92.8%, and 22.6/94.8%, respectively.

Now, what are the odds that Ohio State would win all five of those games? That is simply the product of 79.2%, 83.1%, 86.7%, 92.8%, and 94.8% — which is 50%. That’s not a coincidence, of course: the reason I picked 62.1 is because that’s what rating Ohio State would need to have in order to have a 50% chance of going undefeated against those five teams. In reality, the Buckeyes have a rating of 56.1, which indicates that — like just about every undefeated team — they were a little bit lucky to go undefeated (assuming, of course, that they beat Michigan State).

Now, let’s use that same 62.1 rating number to go through Auburn’s schedule. At home against Alabama (rating of 56.4), a team with an SRS rating of 62.1 would be a 5.7-point favorite, and have a 65.9% chance of winning. In Atlanta against Missouri (55.7), the team would be a 6.4-point favorite, and have a 67.8% chance of success. The team would be 8 point favorites in Baton Rouge — the game Auburn lost — against LSU (51.1), and have a 71.8% chance of winning. The games at Texas A&M (48.9) and at home against Georgia (48.5) would have 76.9% and 88.4% chances of victory.

Now, the odds of winning all five of those games is just 21.8%, which is a very long-winded, mathematical way of saying what we all know: Auburn faced a harder schedule. But what are the odds of going 5-0 or 4-1 against that schedule? Well, the odds of going 4-1 is just a bit more complicated.

    • The probability of beating Missouri, LSU, A&M, and Georgia, but losing to Alabama, is 11.3%;
    • The probability of beating Alabama, LSU, A&M, and Georgia, but losing to Missouri, is 10.4%;
    • The probability of beating Alabama, Missouri, A&M, and Georgia, but losing to LSU, is 8.6%;
    • The probability of beating Alabama, Missouri, LSU, and Georgia, but losing to A&M, is 6.6%; and
    • The probability of beating Alabama, Missouri, LSU, and A&M, but losing to Georgia, is 2.9%.

Therefore, the likelihood of going 4-1 is 39.6%; that means the likelihood of a team with an SRS rating of 62.1 going 4-1 or 5-0 against those five teams is 61.4%. While there are many assumptions implicit in this post, the conclusion is that it is harder to do what Ohio State will do if it wins tonight than what Auburn will do.  Adding in the bottom 8 opponents for each team won’t change the numbers much (you can run the numbers using the above formula).

What would change the numbers is changing the ratings of some of the team’s opponents.  If, for example, Alabama had a rating of 69 instead of 56.4, then a team of a a quality equal to 62.1 would win that game only 38.9% of the time, and the odds of going 4-1 or 5-0 against that schedule would be 50/50. But that’s a pretty significant increase to Alabama’s grade, of course.

For a team to have a 50% chance of winning at least four out of five games against Alabama, Missouri, LSU, A&M, and Georgia, they would need a rating of 59.8. But a team with a rating of 59.8 would only have a 40.5% chance of not dropping a game to Wisconsin, Michigan State, Michigan, Iowa, or Northwestern.

Of course, I’ve followed college football long enough to not wait until Sunday to make this post. That’s because there is only a 30% chance of both Ohio State and Auburn winning today. We could perform the same analysis for Missouri, but the results would only look worse for the SEC crowd, as those Tigers have had an easier schedule than Auburn.  Assuming a rating of 62.1, a team would have a 36.8% chance of beating Auburn, Georgia, South Carolina, A&M, and Ole Miss, and a 78.0% chance of winning at least four of those games. In fact, a team would only need a rating of 56.0 to have even odds of going 5-0 against those teams.

The more interesting case, however, is Florida State. Assuming a rating of 62.1, the Seminoles would have a 69.8% chance of winning in Clemson, and then over a 90% chance of winning every other game (Duke will be the second toughest game of the year for FSU). That means a 62.1 SRS team would have a 53.0% chance of going 5-0 against Clemson, Duke, Florida, Pittsburgh, and Boston College; a team that had only a 50% chance would need a rating of 61.4, slightly lower than what Ohio State has produced.

That doesn’t mean Ohio State is more deserving of a spot than Florida State in the BCS National Championship Game, as FSU’s dominance is an element that can’t be overlooked. But I wouldn’t argue with you if you said that it was easier for FSU to go undefeated than it is for Ohio State.

{ 5 comments }

Week 14 College Football SRS Ratings & The Iron Bowl

We are out of words. You should be dead, Auburn, because we saw you die. And here you are, breathing in the flesh, able to say this: you made the Alabama Crimson Tide kick the winning touchdown for you.

It’s hard to top that recap from EDSBS of one of the greatest games in college football history. Two weeks after pulling off the ending of the season — the Prayer at Jordan-Hare — Auburn gave us the ending of our lives. Entering week 14, Alabama had fielded the best special teams in the nation; on Saturday, all of the Tide’s goals were ripped from them following three missed field goals and a game-winning field goal return touchdown.

Toomer's Corner.

In a second, Alabama lost to its most bitter rival. With that, the Tide lost the SEC West division title, which means the team won’t have a chance to win the SEC Championship or the BCS Championship (barring the unthinkable). In an odd twist, the most dominant team of our era has now won just one division title in the last four years.

Of course, the SRS is not so sensitive to missed field goals that are returned for touchdowns. The Crimson Tide ranked third in last week’s SRS, a ranking which felt one spot too low. Following the Iron Bowl loss, Alabama’s rating dropped from 61.1 to 59.4, moving Nick Saban’s team down to… third. The beauty of a predictive system is that it need not change due to a close road loss to a top team, and that’s what happens here. Auburn jumps from 14 to 11 but no higher, as a 14-point road loss to LSU, a 4-point home win against MSU, and a 7-point home win against Washington State still count.

Ohio State, in fact, actually drops one slot, as the close win in Ann Arbor dropped the Buckeyes behind idle Oklahoma State. Does that mean the Buckeyes don’t deserve to be in the BCS National Championship Game if they defeat Michigan State? Of course not. Last year, Notre Dame was ranked 6th on December 9th in the SRS, but the Fighting Irish surely deserved a spot in the BCSNCG by virtue of being the lone undefeated (and eligible) team in college football. Ohio State deserves the same treatment this year.
[continue reading…]

{ 13 comments }

Oklahoma State won one for the Drinen

Oklahoma State won one for Drinen.

Every year, a few mind-blowing upsets occur this time of year, and every year, we are shocked when it happens. Three of the top five single game performances of the season occurred on Saturday, including the best individual game rating of the year. Oklahoma State’s blowout win against Baylor produced an SRS score of 88.5, topping Florida State’s win at Clemson by three points. Meanwhile, Arizona shocked Oregon, giving the Wildcats (82.9 score) just the third 80+ point SRS rating in a game in 2013. And in less exciting but still noteworthy news: Washington crushed Oregon State (#27 in last week’s SRS ratings) in Corvalis, 69-27.

It looks like we’re headed for a Florida State-Alabama showdown in the BCS National Championship Game. FSU’s last two games should not pose any issues: the Seminoles are rated 27 points higher than Florida, and will be a three-touchdown favorite in the ACC Championship Game. In fact, the difference between the ratings of Florida and Georgia Southern is smaller than the difference between Florida and Florida State (you can view the ratings of FCS teams here). And we’ll get to that Georgia Southern game in a minute.

For Alabama, the schedule is a little more challenging. The Tide are “only” 9 points ahead of Auburn in the SRS, but that’s a little misleading. If we remove Alabama’s games against Colorado State, Georgia State, Chattanooga, Kentucky, and Tennessee — all games the Tide won by over 21 points — their rating would jump to 64.4. For Auburn, the only team they beat by more than three touchdowns that lowered their rating was Western Carolina; do that, and the Tigers are at 52.9. That puts Alabama 11.5 points better than Auburn. The Iron Bowl is in Auburn this year, and the Tigers are 10.5 point underdogs, so perhaps the SRS is still underrating the Tide by a point or two. An SEC Championship Game against Missouri would be another tough test, but first, those Tigers must defeat Johnny Manziel and the Aggies to earn a trip to Atlanta.

Below are the SRS ratings through 13 weeks. As always, thanks to Dr. Peter Wolfe for providing the final scores for every college football game. [continue reading…]

{ 2 comments }

Non-FBS College Football Ratings Through 13 Weeks

Every week, I publish my college football ratings for FBS teams. To generate those ratings – using this methodology — my program also generates ratings for teams at all other levels.  This week, I will separate out the non-FBS teams based on their levels of play (instead of just lumping all non-FBS teams together). As always, thanks to Dr. Peter Wolfe for providing the final scores for every college football game.

Let’s start with the FCS schools:
[continue reading…]

{ 2 comments }
Next Posts Previous Posts