Kaepernick … tuning out the critics?

Kaepernick … tuning out the critics?
Let’s say Josh McCown starts 6 games for the Jets this season. That will give McCown 66 career starts, and shockingly, half of those starts will have come after McCown turned 34 years old. That is remarkable no matter how you slice it, because at the start of the 2013 season, the odds would have been infinitesimal that McCown would start 33 more games in his career. Take a look at his career through 2012: the most likely outcome, I suspect, would be him never starting another game:
| Year | Age | Tm | G | GS | QBrec | Cmp | Att | Cmp% | Yds | TD | Int | Y/G | Rate | Sk | Yds | NY/A | ANY/A |
|---|---|---|---|---|---|---|---|---|---|---|---|---|---|---|---|---|---|
| 2002 | 23 | ARI | 2 | 0 | 7 | 18 | 38.9 | 66 | 0 | 2 | 33.0 | 10.2 | 5 | 50 | 0.70 | -3.22 | |
| 2003 | 24 | ARI | 8 | 3 | 1-2-0 | 95 | 166 | 57.2 | 1018 | 5 | 6 | 127.3 | 70.3 | 25 | 174 | 4.42 | 3.53 |
| 2004 | 25 | ARI | 14 | 13 | 6-7-0 | 233 | 408 | 57.1 | 2511 | 11 | 10 | 179.4 | 74.1 | 31 | 263 | 5.12 | 4.60 |
| 2005 | 26 | ARI | 9 | 6 | 3-3-0 | 163 | 270 | 60.4 | 1836 | 9 | 11 | 204.0 | 74.9 | 18 | 101 | 6.02 | 4.93 |
| 2006 | 27 | DET | 2 | 0 | 0 | 0 | 0 | 0 | 0 | 0.0 | 0 | 0 | |||||
| 2007 | 28 | OAK | 9 | 9 | 2-7-0 | 111 | 190 | 58.4 | 1151 | 10 | 11 | 127.9 | 69.4 | 14 | 92 | 5.19 | 3.75 |
| 2008 | 29 | CAR | 2 | 0 | 0 | 0 | 0 | 0 | 0 | 0.0 | 0 | 0 | |||||
| 2009 | 30 | CAR | 1 | 0 | 1 | 6 | 16.7 | 2 | 0 | 0 | 2.0 | 39.6 | 1 | 6 | -0.57 | -0.57 | |
| 2011 | 32 | CHI | 3 | 2 | 1-1-0 | 35 | 55 | 63.6 | 414 | 2 | 4 | 138.0 | 68.3 | 7 | 43 | 5.98 | 3.73 |
| 2012 | 33 | CHI | 0 | 0 | 0 | 0 | 0 | 0 | 0 |
Adam Steele is back for another guest post. You can view all of Adam’s posts here. As always, we thank him for contributing.
On Monday, I updated my ever-evolving Positive Yards Per Attempt metric. Today’s post will serve as an introduction to its contra metric, Negative Yards Per Attempt (NegY/A). The very simple formula is as follows:
NegY/A = ( – sack yards – INT * 45) / dropbacks
The result will always be either zero or negative, but less negative (i.e., closer to zero) numbers are better. I chose to exclude fumbles because I want to maintain an apples to apples comparison with PY/A, so NegY/A covers passing plays only. I want to be very clear – NegY/A is NOT intended to be a comprehensive measure of QB play and should never be cited on its own. Its primary purpose, as with PY/A, is to estimate the relative importance of the different components of the passing game.
I won’t bore you with more words, so lets get straight to the numbers. Similar to the PY/A table, NegY/A is presented as both value over average and relative to league average on a per play basis. I wanted to cover the same timeframe as the previous article, so this includes all QB seasons since 1992 of at least 224 dropbacks (n = 829). [continue reading…]
Last Tuesday, James “Four Touchdowns” Hanson posted a great article on the support that Peyton Manning, Tom Brady, Drew Brees and Aaron Rodgers have enjoyed throughout their careers. Two days later, he posted Part 2, and both articles were extremely well-received. Today is the third part in his series. As always, we thank our guest posters for contributing. What follows are James’ words.
Elite Quarterbacks: Measuring Team Support by Wins & Losses
Last time, I took a look at the overall support received by four elite quarterbacks – Peyton Manning, Tom Brady, Drew Brees and Aaron Rodgers – throughout the course of their careers. [continue reading…]
Two pretty accurate passers.
Last week, I published two posts on quarterbacks based on their completion percentage and yards per completion averages, relative to league average. The Sam Bradford Index post looks at quarterbacks with high completion percentages and low yards/completion averages, while the Jay Schroeder Index looks at the reverse. Freddy Alejandro made a request for career ratings in the comments, and with the help of Bryan Frye’s formula, I went ahead and generated those ratings.
Note that when calculating single-season standard deviations in both completion percentage and yards per completion, I used two modifications from last week’s posts. One, I used a three-year rolling average, and two, I used all passers (and not just qualifying passers) to calculate standard deviations. These combinations had the effect of making the standard deviations greater, which makes the Z-Scores smaller. As a result, the numbers are more compressed than they were last week, in addition to the fact that career ratings always bring less extreme ratings than a list of single-season leaders.
The most extreme rating belongs to Joe Montana, who for his career was 1.23 standard deviations above average in completion percentage. That’s the second-best rating, behind only Steve Young: each passer led the NFL in completion percentage five different times. From 1980 to 1997, 49ers passers led the league in completion percentage 10 times, with the rest of the league winning just eight crowns.
The difference between Young and Montana: Young had a slightly above-average yards per completion average for his career, while Montana was slightly below-average. [1]Despite Montana finishing with a higher Yd/Cmp average for his career, that is a function of era; Montana never finished higher than 10th in that metric, while Young had three top-5 finishes and … Continue reading And remember, this metric is calculated by taking each passer’s Z-Score in completion percentage and then subtracting their Z-Score in yards/completion, so a negative number in the latter category leads to a higher rating. After all, we are trying to identify the passers who had the highest completion percentages with the lowest yards per completion averages.
Note that this is a measure of style, not quality. Finishing high or low on this list is neither inherently good or bad. Joining Montana in the top 3 is Chad Pennington, although most of the top quarterbacks are Hall of Famers. Take a look: [continue reading…]
References
| ↑1 | Despite Montana finishing with a higher Yd/Cmp average for his career, that is a function of era; Montana never finished higher than 10th in that metric, while Young had three top-5 finishes and three more top-10 finishes. |
|---|
Jones telling George where he put the running plays in the playbook.
This week, James “Four Touchdowns” Hanson had a couple of interesting posts on the support four star quarterbacks received. James provided some very extensive, in-depth analysis, but that doesn’t mean there isn’t still a place for simple, surface-level analysis, either!
I was wondering which quarterbacks received the most and least support from their team’s rushing attacks. Which brings us to Jeff George. There are 179 quarterbacks who have started at least 50 games in the NFL. George started games across five different teams — Indianapolis, Atlanta, Oakland, Minnesota, and Washington. And in the 124 games he started, his teams averaged just 87.9 rushing yards per game, the fewest of any quarterback in NFL history.
In Oakland (23 of 124 starts) in ’97 and ’98, George had an in-his-prime Napoleon Kaufman, so that wasn’t a bad situation: his Raiders averaged 105.9 rushing yards per game. And in 10 starts with the Vikings in 1999, George had the impressive combination of Robert Smith and Leroy Hoard, and the Vikings averaged 126.4 rushing yards per game.
But his fortunes were much different in his other stops. George began his career, of course, with the Colts from 1990 to 1993. In his 49 starts in Indianapolis, the Colts were absolutely terrible on the ground. There were 112 team seasons from 1990 to 1993 — that’s four years during the 28-team NFL — and the four Colts teams ranked 106th, 108th, 111th, and 112th in rushing yards over that period. Over those four years, Indianapolis rushed for just 4,841 yards, more than 1,000 rushing yards behind the second-worst team (Miami). The Colts averaged an anemic 3.38 yards per carry, also worst in the league. In George’s 49 starts, Indianapolis averaged just 75.6 rushing yards per game.
George then went to Atlanta, and from ’94 to ’96 (35 starts), the Falcons rushed for just 82.3 yards per game in George’s starts. George started 16 games in both ’94 and ’95, and Atlanta averaged the fewest rushing yards per game of any team in the NFL during that period. As you probably know, those Falcons famously ran the Run-N-Shoot under head coach June Jones, so some of this was a reflection of philosophy rather than lack of talent [1]It’s also worth noting, even this should always be implied, that rushing yards is highly correlated to team success, and George’s Colts were terrible, going 14-35. In 1994, the Falcons ranked dead last in both rushing attempts and rushing yards, and 3rd in pass attempts and 5th in passing yards.
The personnel was suited for Jones’ offense: Terance Mathis, Andre Rison, [2]Ironically, Rison was traded from the Colts to the Falcons Indianapolis traded up to acquire George when he was the projected first overall selection. Bert Emanuel, and Ricky Sanders were all starters in the Falcons 0-TE/0-FB offense, with Ironhead Craig Heyward and Erric Pegram at running back. That offense worked pretty well (and would likely work even better today), but a high number of interceptions and a bad pass defense caused the team go to 7-9 in 1994. In ’95, Rison (who signed an enormous contract to play in Cleveland) and Sanders (just two catches in his final season) were gone, but Eric Metcalf was acquired in Rison’s place and J.J. Birden (from Kansas City) filled Sanders’ role. Heyward actually made the Pro Bowl and rushed for 1,000 yards, but the Falcons remained a pass-heavy team. George was benched three games into the 1996 season, ending his time in Atlanta. [3]And to complete the story: in the final 7 starts of his career, in Washington, George’s team rushed for only 86.3 yards per game.
The table below shows the rushing yards per game averaged in games started by each quarterback, for the 179 quarterbacks with at least 50 starts. The table is sorted by rushing yards per game, from most to fewest, so George is at the very bottom (the table is fully sortable and searchable). [continue reading…]
References
| ↑1 | It’s also worth noting, even this should always be implied, that rushing yards is highly correlated to team success, and George’s Colts were terrible, going 14-35. |
|---|---|
| ↑2 | Ironically, Rison was traded from the Colts to the Falcons Indianapolis traded up to acquire George when he was the projected first overall selection. |
| ↑3 | And to complete the story: in the final 7 starts of his career, in Washington, George’s team rushed for only 86.3 yards per game. |
Yesterday, I looked at the quarterbacks who were the biggest checkdown artists: i.e., which players had the best completion percentages and lowest yards per completion averages. I measured this by calculating how many standard deviations above/below average each quarterback was in those two categories in each year.
Today, the reverse. And the big winner is rookie Terry Bradshaw. We all know Bradshaw stunk as a rookie. He had a whopping 11.0% interception rate, which was horrible even for 1970. In fact, he has the second most attempts in history by a player with an 11% or worse interception rate. And since Bradshaw also ranked dead last in completion percentage, he ranked 2nd to last in ANY/A that year.
Of course, you might wonder: how could someone with the worst completion percentage and by far the worst interception rate not rank last (by a mile) in ANY/A? Well, it’s because Bradshaw ranked 2nd in the NFL in yards per completion as a rookie. He was your ultimate boom/bust passer, finishing 2.75 standard deviations below average in completion percentage and 2.18 standard deviations above average in yards per completion.
The top of the list features a bunch of interesting names, but I’m calling this the Jay Schroeder Index for a reason. Schroeder only had 8 seasons where he threw at least 200 passes, but he makes the top 200 in 6 of those 8 seasons! Schroeder made the list in ’86, ’87, and ’88 (despite moving from the Redskins to the Raiders this year), and then in ’90, ’91, and ’92. He only missed the list in 1989 during this run, and that’s because he threw just 194 passes. But in 1989, of the 34 quarterbacks with at least 150 pass attempts, Schroeder had the lowest completion percentage (46.9%) and by far the highest yards per completion average (17.0, the best of his career). In other words, Schroeder had a top-200 season in 6 out of 7 straight years, with the lone exception being perhaps his most Schroeder-esque season! Of course, Schroeder’s love of the deep ball isn’t new to readers of this site.
The table below shows the top 200 seasons based on the Schroeder Index, using the same formula as yesterday: [continue reading…]
On Tuesday, James “Four Touchdowns” Hanson posted a great article on the support that Peyton Manning, Tom Brady, Drew Brees and Aaron Rodgers have enjoyed throughout their careers. That was Part 1, and it received over 100 comments, so give it (and the comments section) a read. Today comes Part 2. As always, we thank our guest posters for contributing. What follows are James’ words.
Team Support by Traditional Stats and Expected Points
About 35% to 55% of all offensive plays (depending on game script, offensive philosophy, personnel, etc.) are running plays, so there is value in looking at what each quarterback’s running game produced. Even if teams tend to run more after building a lead, it’s still a key part of closing out games. I’ve included their average league-wide ranks so we can get a better idea of how many seasons they enjoyed with great rushing support.
I’ve also included turnovers minus interceptions, which I assume are fumbles from the WRs, RBs, QBs, and Special Teams – but since I can’t determine who is responsible for what, I’ve included that information here under the assumption that most fumbles aren’t from the quarterback.
I should also note that while the rushing yards and touchdowns have had the quarterback’s contributions subtracted, the rushing first downs and expected points include any first downs gained by quarterback sneaks and scrambles.
The light green indicates the leader in that category, while the pink indicates the least amount of support in that metric.
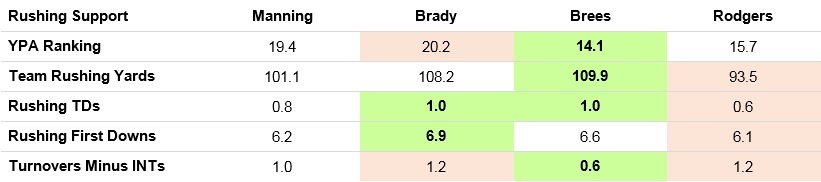
In general, it looks like Brady and Brees have enjoyed the most rushing support while Rodgers has suffered the least amount of support by conventional metrics – and remember, those TD and first down totals include ones he picked up himself, meaning his support in those areas is likely even worse than the numbers indicate. Manning and Brady have had a top ten run game in 7 seasons, while Brees has had one 3 times and Rodgers has had a top ten running game in 2 seasons. [continue reading…]
Today’s guest post comes from James “Four Touchdowns” Hanson, a relative new reader to the site. As always, we thank our guest posters for contributing.
Elite Quarterbacks: Measuring Overall Team Support
It’s easy for football fans to buy into the mainstream logic that if you have an elite quarterback, your team will have a winning record, enjoy trips to the post-season and even win a few championships. The better the quarterback, the more wins and titles you can expect… right?
But that logic doesn’t always hold up. Dan Marino, Fran Tarkenton, Warren Moon, Dan Fouts, Jim Kelly, Sonny Jurgensen, Philip Rivers, and so on, provide examples to the contrary. And while his talents have been unfairly portrayed at times, the fact that Terry Bradshaw has four Super Bowl rings while superior passers have none presents a disconnect if you think great quarterback talent is measured by titles.
If we go by an average time of possession of 30 minutes per team, that means that half the time, a team’s quarterback isn’t even on the field. And if 35% to 55% of your team’s offensive plays are running plays… doesn’t that mean the quarterback really only affects 22% to 33% of the total game time? And once you get into other factors that affect a passer’s game, like play design and coaching, offensive line talent, receiving talent, quality of opposition, etc., attributing credit and blame gets pretty murky.
So while we have a general feeling that some quarterbacks receive more support than others, so how do we go about measuring it through metrics? Unfortunately, due to the nature of passing stats, I don’t know of a way to separate a quarterback from his receivers, pass blocking, scheme and play-calling. Whether it’s passer rating, ANY/A, or passing EPA, none of them can tell you which percentage of the credit (or blame) should be shared with those external factors.
That said, we can measure a quarterback’s support by looking at the numbers produced by his running game, defense and special teams. While I’d love to run these numbers for all quarterbacks, my ability to collect them is fairly limited (basically, cutting and pasting from Pro Football Reference – I don’t know enough about Python or R to run a spider to scrape them all in one go), so I will be focusing on four quarterbacks that are perceived to be “elite” by general mainstream consensus – Peyton Manning, Tom Brady, Drew Brees and Aaron Rodgers.
Due to length, I will be looking at these numbers in three separate articles. This one will focus on what support they received in these areas overall and the second will take a look at team support relative to the quarterback’s performance – how often their teams win when they have below-average performances and how often they lose when they perform at a high level (as measured by stats, natch).
Overall ANY/A, Passer Rating, & Expected Points Metrics
So let’s dig into the numbers. Here are the quarterbacks’ average stats per game for their overall careers including playoff games (which is why you may notice a difference between these and career averages that only include the regular season). The cells shaded blue indicate that quarterback is the leader among the four in that metric. While all of these metrics should be familiar to readers of the site, I have also included a metric I’m calling Relative Passer Rating (rPR) and it’s essentially the same concept as Relative ANY/A – it measures passer rating compared to the average for that season. For example, if the average is 80.0 and the passer earns a 90.0, his rPR would be +10.0.
As Peyton Manning is the only one of the four to suffer a physical decline in a career ending season, I have included his pre-2015 averages for the efficiency metrics in parenthesis next to his actual averages, though this will not affect any of the analysis from this point on – it’s more of a “nice to know”.
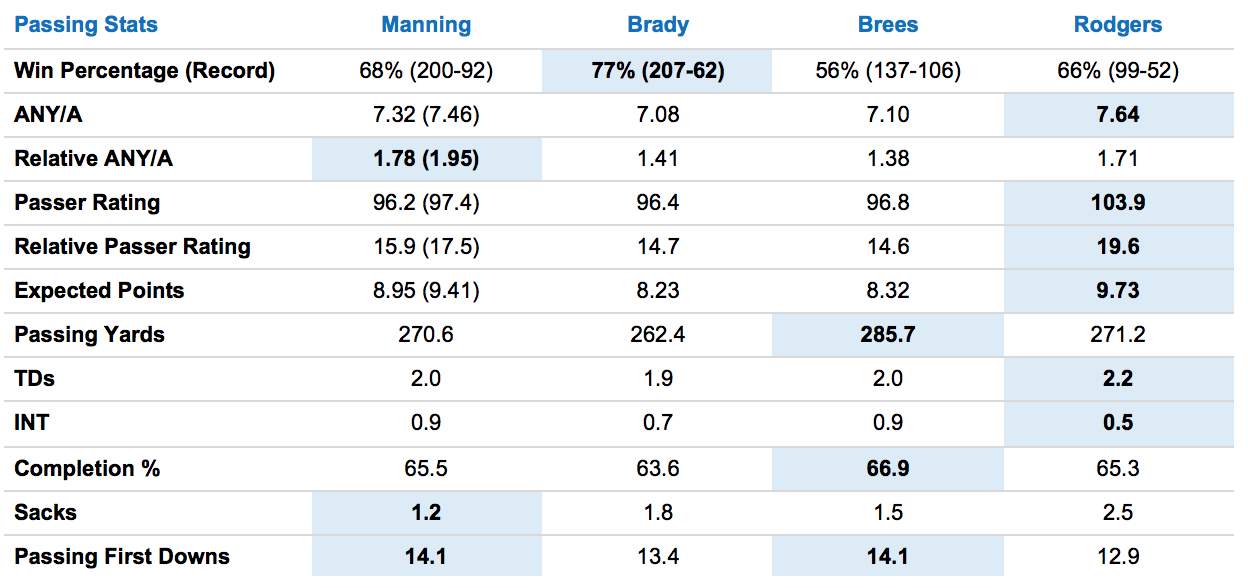 Great numbers across the board, as to be expected by elite players but it’s amazing how much higher Brady’s win percentage is than the other players despite not producing any clear statistical advantage in the efficiency or traditional metrics – and how much lower Brees’ win percentage is than the others despite his numbers being on par with the other three QBs.
Additionally, as their success in the playoffs makes us the biggest difference in the way people perceive these players, I will break out their playoff numbers in a separate table –
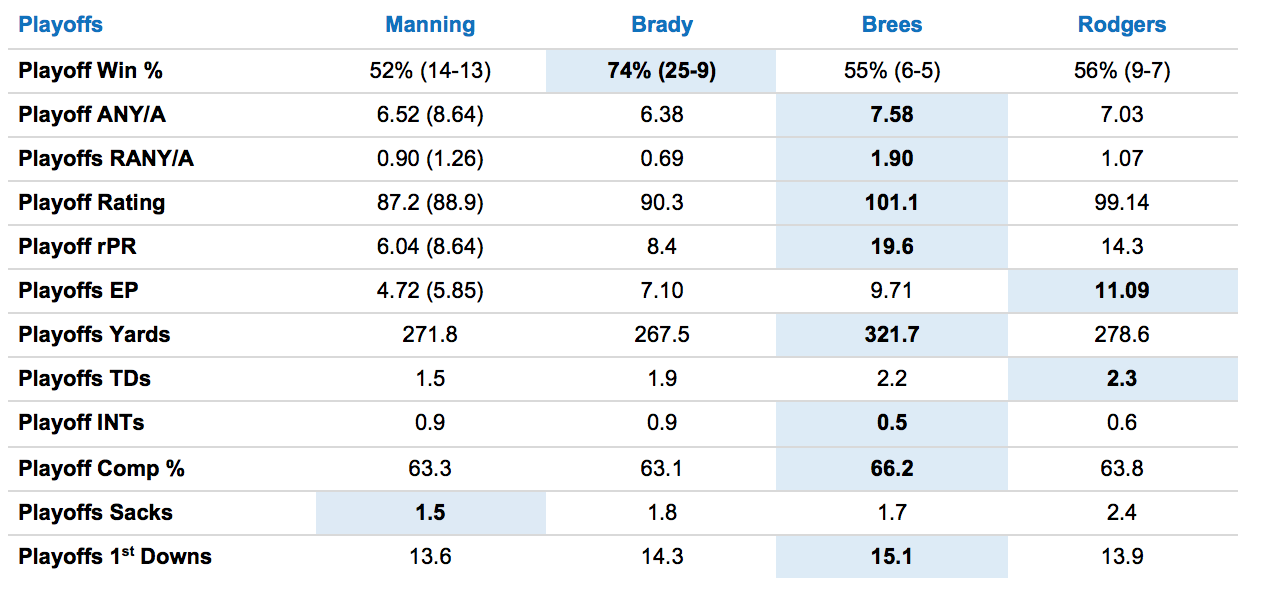 The numbers here probably come as a surprise – I know I didn’t expect Brees to sweep nearly every passing metric for the playoffs. While his smaller sample size comes into play, it doesn’t seem to have affected his win percentage, which is about on par with everyone except Tom Brady.
So there’s our starting point – we can see how each player has performed relative to the others, and while there are some clear leaders in the playoffs, they’ve produced at a similar level overall throughout their careers. Now let’s see how their teams have supported them.
Team Support Measured by Expected Points
As they’re the metrics that seem mostly closely tied to the margin of victory and defeat, I figured we’d start with Expected Points. Mike from Sports Reference defines Expected Points as a way to “break down the contributions each team’s various squads made to the margin of victory.” Those last few words are key; EP are applicable to the margin of victory – or defeat.
With that in mind, I went about measuring the EP of each quarterback’s passing offense against the rest of the team – running game, defense, and special teams. The sum of those three squads make up the Total Support EP number while the point differential is the average margin of wins and losses across their careers.
The EP Gained / Lost metric represents the average EP each quarterback’s running game, defense, and special teams have added or subtracted per game from the passing EP they generated. I also felt that per game average didn’t fully illustrate what effect those added or subtracted points had over the course of each player’s career, so I included the sum or difference in Total EP Gained / Lost.
Finally, since EP is tied to the margin of victory or defeat, I included the Point Differential to give the numbers some context. I also showed what each QB’s passing EP as a percentage of the average point differential in Pass EP % of Outcome so we could see how much credit or blame each quarterback should take for his team’s outcomes on average.
Red indicates negative EP while green indicates positive EP; dark green and dark red indicate who finished first and last in each category respectively.
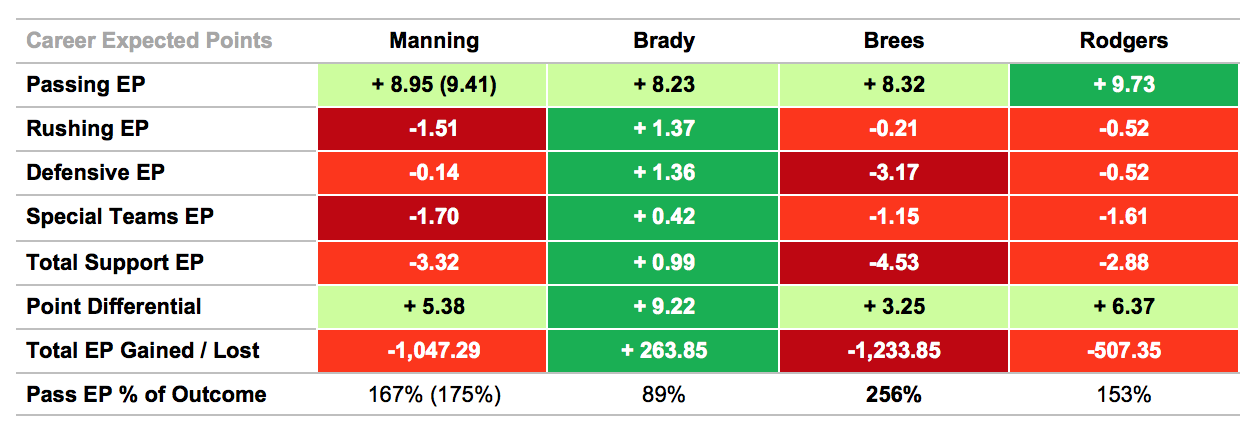
First off, it’s clear that these players’ passing offenses have been the driving force behind their teams’ success. Compare their passing EP to the average margin of victory and you see that it’s each quarterback’s passing game that has created most or all of that point differential – it looks like most of the time, these guys carry their teams.
That said, we can see the EP support (AKA negative plays) has been very different for one player compared to the other three – Brady is the only one to have positive EP support in any category and amazingly has positive EP in ALL support categories. It’s said that the quarterback affects all other players on the field and while that may be true, we’re not seeing it in these results – every other QB has a higher EP average per game than Brady but gets worse support than him.
If we were to round the numbers, it looks like Manning’s and Rodgers’ team support have cost their teams around a field goal in points, on average, while Brees loses roughly 5 points. Meanwhile, Brady’s support has been worth an extra point to his Patriots. We shouldn’t misinterpret these numbers to suggest that somehow Brady is being carried by great support – it’s clear that Brady’s passing game is the engine that drives the Patriots’ success as a team but he’s the only quarterback of the four whose supporting elements haven’t cost him points.
This has led to his teams actually adding positive EP to his games overall, giving Brady nearly 264 expected points to his overall point differential over the course of his career. Manning and Brees, on the other hand, has had their teams cost them over 1,000 expected points and at the rate Rodgers’ offenses have been producing, Rodgers will likely join them by the end of his career.
Of course, there’s only so much we can see from these per game averages – let’s see what that EP looks like spread out over the course of their careers. After all, a team that provides -5 EP in five games and a team that provides +5 EP in two games and -20 EP in three games will both average out to -5 EP per game. But the first team had five straight bad games while the second team had three good games and two catastrophically bad games. Clearly, not the same thing.
So let’s look at how many games each passer and team have provided positive and negative support – and then let’s see how often that support has created a two-possession lead or deficit (9 points), three-possession lead or deficit (17 points), and while I know 24 points is technically three possessions, I think the odds of any team getting three TDs with three two-point conversions is very low – so I set 3 TDs (21 points) as my threshold for three-possessions. Additionally, we should see how often our QBs do the same, so those passing EP numbers are also included.
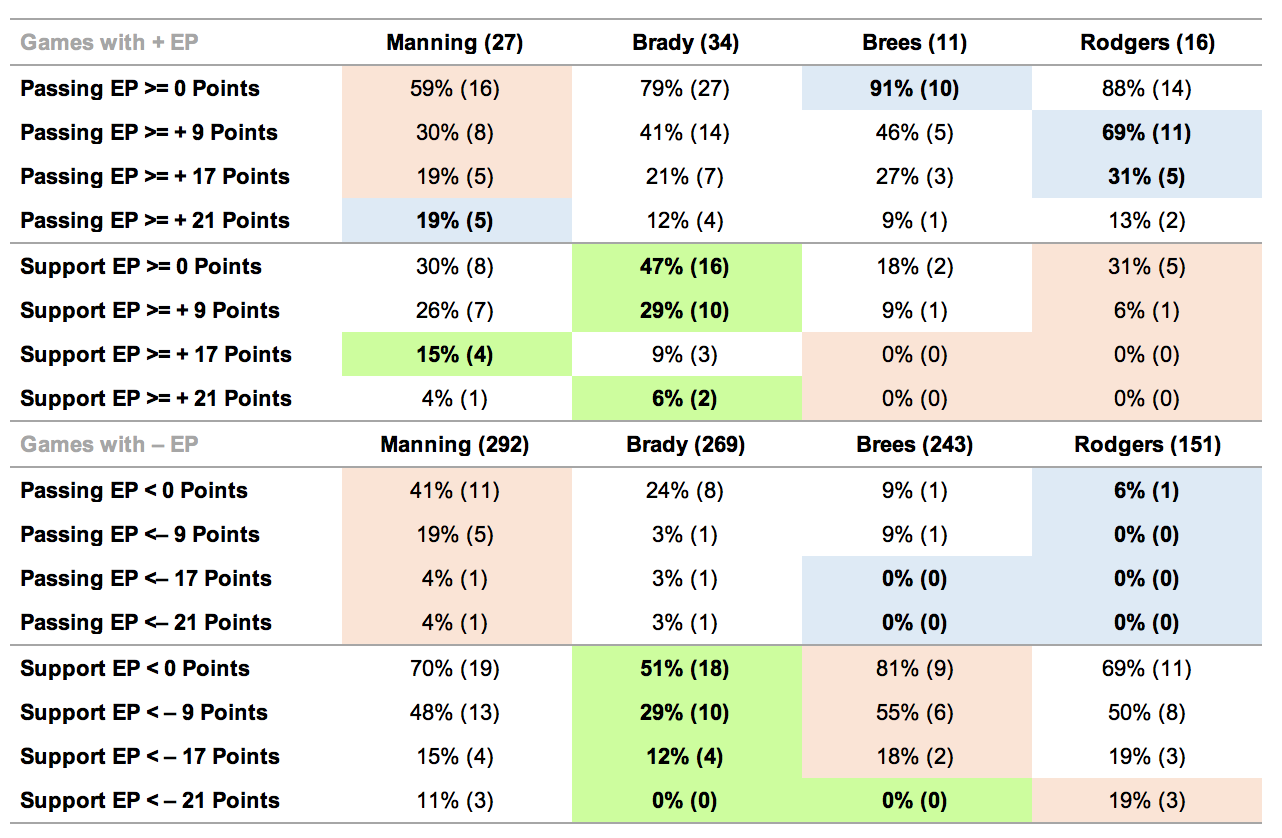
The leaders in passing EP are marked blue, the leaders in support EP are marked green, and ones with the least EP in each category are highlighted in red –
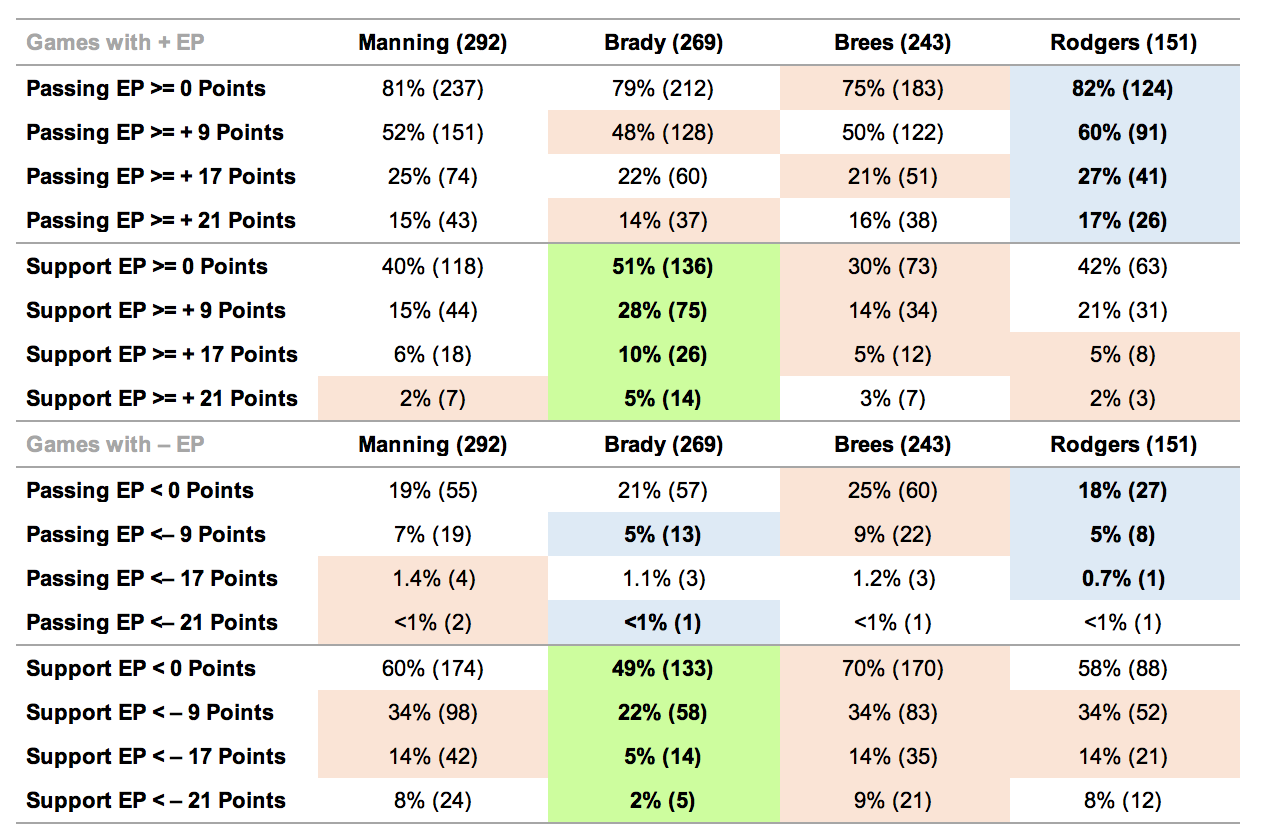
The numbers reflect what we’ve seen before – Aaron Rodgers leads in almost all categories with passing EP, having the largest number of games with positive EP and the fewest with negative EP. Meanwhile, Brady has the most games with positive support and the fewest games with negative support across all categories by a substantial margin, though he’s tied for the lead with Rodgers for the fewest games with negative EP over 9 points.
That all said, when you look at the actual number of games with negative passing EP, it’s really only a handful of difference between these players – they’re all incredible, posting positive EP in the vast majority of their games and two possessions worth of positive EP in about half of their games. These guys are considered the elites of the sport for a reason and these numbers bear that out.
As before, I included their playoff numbers since that’s the core difference in how fans perceive them. One difference here from the previous chart, though – since none of them enjoyed totally positive playoff support, the QB with the smallest deficit of supporting cast EP is highlighted in yellow–
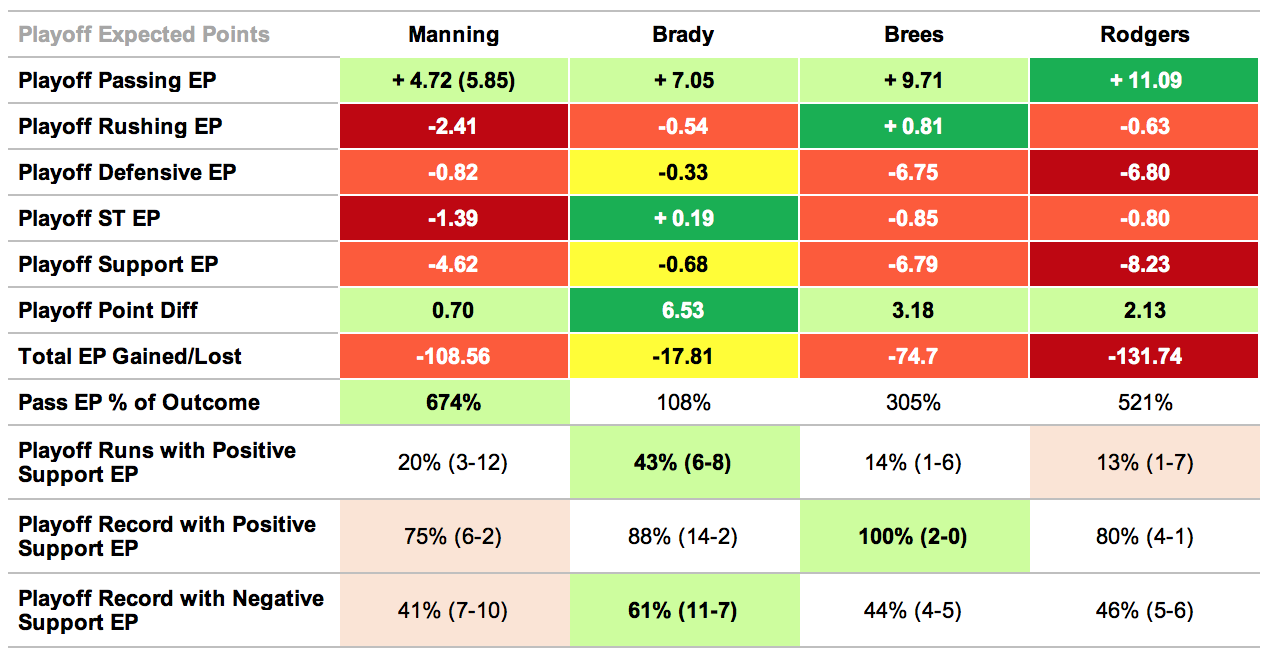 If you think about it, it’s kind of amazing that despite Manning, Brady and Brees playing over 240 games (Rodgers at 151), a small fraction of them determine how the general public sees these players — the playoff games. Manning has played 292 games and the outcome of 27 will determine how he’s remembered. Brady has played 269 and 34 are what makes him the GOAT to most of the public. Brees has played 243 and the outcome of 11 is what keeps him out of most people’s conversation for GOAT. Kinda nuts – but at least Rodgers still has a lot of his career ahead of him. Hopefully, Green Bay will get the man some help!
With that in mind, I decided to add three rows to this column since we’re dealing with such a small sample size for the playoffs so we can understand the narrative behind the averages a little better – how many playoff appearances they had with positive support EP, their record with that support, and then their record with negative support. While they all had negative support in the playoffs, Brady’s did the least amount of damage – despite both Brees and Rodgers having higher passing EP, their playoff point differential is less than half of Brady’s. Meanwhile, it seems Manning has to assume some responsibility for his lack of playoff success as his passing EP drops dramatically in the playoffs.
That said, in terms of win percentage, they all do better with positive support – Manning seems to do worst but still has an incredible 75% win percentage, way up from his 52% overall.
And while the results so far of this study have shown that Brady has received the most support while not always posting the best efficiency metrics or raw stat totals, we have to give him his due – he is the only QB of the four with a winning playoff record in games with negative EP support.
So how does this all translate to Super Bowls? Two of Manning’s three playoff runs with positive support netted him a Super Bowl title (his other was in 2014 when he was hindered by injuries that would ultimately end his career), while Brees’ and Rodgers’ only playoff run with positive support led to them winning a Super Bowl (Brees’ Special Teams EP in his Super Bowl was nearly 10 points alone!). On the other side, Tom Brady has won three Super Bowls with positive support and two Super Bowls with negative support (though all Super Bowl runs featured at least one game with positive support that contributed more to the margin of victory than passing EP), which certainly adds some credibility to the idea that he’s got a bit more “clutch” to him than the other three quarterbacks.
All that said, we can see how much more the other three quarterbacks lost due to poor playoff support – despite having the lowest passing EP by far, Manning also contributed the most to his team’s point differential, suggesting that overall, they would have done much worse without him.
Below, we see the numbers that tell the story of Manning’s playoff struggles – he’s generated the fewest games with positive EP and the most games with negative EP as a percentage and his poor games have been more catastrophic than the others, while his great games have been more dominant than the others. His passing offenses seem to be “feast or famine” in the playoffs. Beyond that, the story stays the same for the other QBs – Rodgers and Brees generate the best playoff passing EP but suffer the worst support EP of the four QBs, while Brady’s great EP performances seem to be hindered the least by his supporting squads.
 So, what is the deal with Manning in the playoffs? We’ve established his support was poor in general, but poor support hasn’t hindered the other QBs as much as it has Peyton (though both Brees and Rodgers playoff sample size is much smaller than Manning’s). It’s a question many have asked and for my money, probably most satisfyingly answered in Scott Kacsmar’s two-part article on Football Outsiders, which you can read here and here.
His critics seem to feel that the pressure and anxiety caused by the high-stakes “lose and you’re out” playoffs format causes Manning to play worse. Perhaps this is true – but I find it hard to believe that he can, for example, run the same “levels” play over and over in the regular season but once the playoffs start, he suddenly can’t make the reads and throws he’s made literally thousands of times before. I’d need to see film study done to believe this theory – if someone can show me that Manning consistently made more bad reads and missed open receivers in the playoffs, while under the same amount of pressure as usual, I can believe it was psychological.
But there are other possible explanations. The first is that the small number of playoff games can skew numbers due to a high degree of variability found in small sample sizes. Perhaps Manning was just unfortunate that he had a higher percentage of his poor games in the playoffs than the other QBs. After all, his career efficiency averages, even when adjusted for opponent like DVOA, suggest he’s had the same percentage of bad games overall as the other three QBs. I find this plausible but perhaps a bit unsatisfying.
Ultimately, it’s something we won’t be able to figure out here, so let’s move on to looking at support measured by traditional metrics. That will come in Part II.
In 1981, the Chargers and Bengals met in the AFC Championship Game. That game isn’t the most memorable game played that day, in part because of the cold weather: nicknamed the Freezer Bowl, San Diego struggled on the road in a game played with a windchill of -32 degrees.
But the bad weather obscured the fact that Dan Fouts and Ken Anderson — by far the top two passers in the NFL that season — were facing off for the right to play in the Super Bowl. Over in the NFC, the 5th and 6th leading passers in ANY/A — Danny White and Joe Montana — were meeting in what would turn out to be one of the most memorable games in NFL history. [continue reading…]
Yesterday, I analyzed whether having a great quarterback is more important than ever when it comes to winning it all. The evidence provides a straightforward answer: no.
Today I want to examine the question from another perspective: what about how the eventual Super Bowl-winning quarterback looked prior to the season? From ’99 to ’02, we had four straight quarterbacks come out of nowhere to win the Super Bowl. In 1998, Kurt Warner threw 11 passes. In ’99, Warner won the Super Bowl, while Trent Dilfer ranked 29th among qualifying passers in ANY/A. But in 2000, Dilfer won the Super Bowl, while Tom Brady threw just three passes. In 2001, Brady won the Super Bowl, while a 33-year-old Brad Johnson looked past his prime, as he ranked 24th in ANY/A; the next year, of course, Johnson won the Super Bowl.
Nobody even thought about Warner or Brady in May of the year they won their first Super Bowls, and Dilfer and Johnson were veterans who did not fit within any definition of the words “great quarterback.” And yet, for four straight years, they shocked the football world.
So I wondered: how did each passer rank the year before they won the Super Bowl? A brief departure:
Failed to Qualify
In addition to Warner and Brady (and ignoring Hostetler and Williams), there were 7 other quarterbacks who failed to register enough attempts to qualify for the passing crown the year before they won the Super Bowl. That includes 5 straight quarterbacks in the early ’70s.
In 1970, Roger Staubach was the backup to Craig Morton, but Staubach won the championship with an all-time great season the next year. In ’71, Morrall was the backup to Bob Griese, but Morrall was the main starter for the ’72 Dolphins due to Griese’s injury. And that means Griese ’72 makes our list, too, since Griese won it all in ’73. Terry Bradshaw in 1973 had just 180 pass attempts, so he didn’t have the 196 passes necessary to qualify for the passing crown (but he was so bad that if he did qualify, he would have ranked just 21st out of 24 passers in ANY/A). The next year he started 7 of 14 games for the ’74 Steelers but ranked 2nd on the team in pass attempts with just 148; as a result, he doesn’t have enough attempts to qualify when looking at Year N-1 performances, which is relevant since the ’75 Steelers won it all. So the ’71 Cowboys, ’72 Dolphins, ’73 Dolphins, ’74 Steelers, and ’75 Steelers all get labeled as having starting quarterbacks who the year before, did not have enough pass attempts to qualify for the passing crown.
The other two quarterbacks are Jim Plunkett and Jim McMahon. In 1979, Plunkett threw 15 passes for the Raiders and was viewed as a draft bust; a year later, he won the Super Bowl. In 1984, McMahon suffered a season-ending injury after just 143 attempts. [continue reading…]
Today’s guest post comes from Damon Gulczynski, a longtime reader, Seattle sports fan, and part-time writer. He also wrote this book on baseball names. As always, we thank our guest posters for contributing.

A journeyman quarterback appears here
At this point, both McCown and Fitzpatrick have surely already attained the venerated title of “journeyman,” but it goes beyond this. I contend that by the end of the 2017 NFL season, McCown and Fitzpatrick will be the two journeyman-est quarterbacks in NFL history. To support this contention, I introduce a new metric I developed called Journeyman Score (JM score). [continue reading…]
The Broncos thought they had found their heir apparent.
I looked at all teams since 1967 that:
There are 15 examples that fit those specific criteria. Let’s review: [continue reading…]
In 1973, the 14 AFC teams housed 8 Hall of Fame quarterbacks. The AFC East had Joe Namath and Bob Griese with the Jets and Dolphins, the AFC Central had Pittsburgh’s Terry Bradshaw, and the AFC West had five HOF QBs: Len Dawson was with the Chiefs, while the Chargers had a first-year Dan Fouts and a last-year Johnny Unitas. The Raiders? They had Ken Stabler and George Blanda. And in the NFC, Sonny Jurgensen and Roger Staubach were the signal callers for Washington and Dallas, while Fran Tarkenton was the Vikings quarterback. That means the ’73 NFL (along with the ’70 and ’71 versions, which didn’t have Fouts but did have Bart Starr) housed 11 future Hall of Fame passers. And that excludes Ken Anderson, of course, who entered the league in ’71.
Meanwhile, in ’81 and ’82 — at a time, I’ll note, when Ken Anderson was doing pretty darn well — there were just four active HOF QBs. Stabler, who finally made it as a seniors’ nominee last year, Fouts, Bradshaw, and Joe Montana. On average, there have been about 7-8 active HOF quarterbacks at any one time. [continue reading…]
Today’s guest post comes from James “Four Touchdowns” Hanson, a relative new reader to the site. As always, we thank our guest posters for contributing.
[Editor’s note: There were a couple of minor bugs in the original data. This post has now been updated.]
There may be no two quarterbacks more often measured against each other than Tom Brady and Peyton Manning. One simply has to do a Google search of the topic to see that fans and sports writers have compared the two numerous times, using a vast array of criteria from the simple counting of championships to using advanced analytics to make their case.
So it’s surprising to me that I still haven’t come across a comparison of Manning and Brady against the same defenses. It’s an idea that occurred to me when Manning critics pointed out that much of his record-breaking 2013 season came against the mediocre teams of the 2013 NFC East and AFC South, while Tom Brady’s record-breaking 2007 was against a tougher strength-of-schedule. [1]While I am a Peyton Manning fan, I feel the point is valid and logical. We compare stats so often but don’t always take into account that most of those numbers were earned against different teams … Continue reading If we’re genuinely after the fairest assessment possible – which is why I assume fans of advanced analytics prefer to measure individual players by their own production rather than team results like wins and championships – what better way to measure each player than by how they performed against the same competition?
So I decided to take a look at the seasons in which Manning and Brady were both active and played against the same teams in the same season. Of course, like any statistical analysis, this one comes with its own set of flaws. When the two quarterbacks play each other’s divisions or one plays the same team in the regular season and the playoffs, one of them may have played the same team twice or even three times in a single season while the other has played them only once.
This can be good or bad for the player’s results – sometimes it allows the opposing defense to learn from the first encounter and make life difficult for the passer the second time around. One example is Peyton Manning’s encounters with the Steelers in 2005; he defeated Pittsburgh with a 102.9 rating and 8.67 ANY/A during the regular season, only to see his performance suffer the second time around during the post-season with a 90.9 rating and 6.21 ANY/A in a loss. Meanwhile, Tom Brady’s single game against the Steelers, where he won with a 92.7 rating and 6.84 ANY/A, stands alone – could he have done better or worse in a second encounter? We’ll never know.
Other times, it can allow the quarterback another opportunity to do well against that defense. When Brady played the Jets for the first time in 2010, he earned a mediocre 72.9 rating and 5.11 ANY/A in a loss. He bounced back to win with an extraordinary 148.9 rating and 12.00 ANY/A in their second meeting and then fell somewhere in between when they met in the playoffs, losing with an 89 passer rating and 5.08 ANY/A. Meanwhile, Manning met the Jets just once in the post-season, where he suffered a loss despite earning a 108.7 rating and 8.85 ANY/A in his last game wearing a Colts uniform. How would he have done if he played the Jets three times? Again, we’ll never know.
In fact, the sometimes vast difference in which each QB has performed against the same defense in the same season should encourage us to take these results with a grain of salt – in-game conditions, game plans from coaches, the play from supporting casts, how one team’s strengths and weaknesses match differently with an opponent, playing at home or away, key injuries on either side, etc. can all effect a player’s performance in any given game.
And there’s always the possibility that Brady or Manning just had a bad day and their performance isn’t indicative of their true abilities: the small sample size of a football season made even smaller by singling out common opponents isn’t ideal in determining a fair and scientific measurement for how good each player actually is. On the other hand, it’s the only evidence we have available, so we’ll have to roll with it.
I bring this up because I don’t intend this to be a definitive attempt at determining which player is better – most people already have made up their minds (and I personally tend to rate quarterback on tiers anyway). Some say Manning would have more championships if he had Belichick and the Patriots organization at his side, while others say Brady would have bigger numbers if he had the receiving talent Manning had during his career. I think both can be true.
I’d also like to mention that I pulled this list manually and despite several reviews, there still may be errors in the data – this is unintentional and I welcome any corrections.
So without further ado, here’s a list of the common opponents they faced in each season, with both 2008 (Brady played one game) and 2011 (Manning was inactive) removed as both players weren’t active during those seasons:
• 2001: Jets, Bills, Dolphins, Raiders, Saints, Falcons, Broncos, Rams
• 2002: Dolphins, Jets, Steelers, Titans, Broncos
• 2003: Dolphins, Jets, Bills, Browns, Broncos, Jags, Texans, Titans, Panthers
• 2004: Ravens, Chiefs
• 2005: Steelers, Jaguars, Chargers
• 2006: Bills, Jets, Dolphins, Titans, Jags, Texans, Broncos, Bengals, Bears
• 2007: Chargers, Ravens, Jaguars
• 2009: Bills, Jets, Dolphins, Titans, Jags, Texans, Ravens, Broncos, Saints
• 2010: Chargers, Jets, Bengals
• 2012: Texans, Ravens
• 2013: Colts, Ravens
• 2014: Bills, Jets, Dolphins, Raiders, Chiefs, Chargers, Colts, Bengals, Seahawks
• 2015: Colts, Steelers, Chiefs
And here are their career averages against common opponents from 189 total regular season and playoff games played (93 Manning, 96 Brady):

Except for interception percentage, Manning seems to have a slight advantage across the board. Most differences are so small that I personally consider them basically even in most categories. The biggest differences seem to be that Manning’s interception rate is substantially higher, while Brady’s sack numbers are substantially higher – and in Brad Oremland’s TSP and Career Value metrics, where Manning holds a commanding lead.
To delve a little further into the numbers, let’s look at the advanced stats of each player by season. The highlights indicate which player did better that year in each metric, while the bolded numbers indicate that season’s number marks a career best (against common opponents) –

The leader in both ANY/A and Passer Rating match in every season, with Manning’s rates beating Brady’s in 8 of the 13 seasons compared. QBR results are also is very similar, with the only difference being Brady having the edge in 2014, putting them even at 4-4.
Interestingly, it seems that for most seasons, one player clearly played better against common opponents by a substantial amount – in Passer Rating, the two only play at a similar level in 2001 and 2007, while the rest of the time the winner often beats the other by ten points or more! What’s really surprising to me is that Manning surpasses Brady in every metric for 2007, which was when Brady led perhaps the greatest offense of all time to a record-breaking season and an AFC Championship.
I also wanted to compare their performances against common opponents in each season by TSP but since it’s a raw sum instead of an average like the other advanced stats, I needed to take each season’s statistical averages and multiply them to get 16 games worth of production. The results were –

The first thing that jumps out at you is Manning’s preposterous 2013 prorated across 16 games – over 6,500 yards and 75 TDs with only 5 INTs. That alone tells us to take these results with a grain of salt.
But accepting the numbers for what they are, we see that the leader in TSP for each season matches the leader in Passer Rating and ANY/A. We also see that Manning’s highs and lows are quite extreme in comparison to Brady’s – Brady doesn’t have a season that matches Manning’s 2004 and 2013, but Brady’s TSP never dips into negative numbers as Manning’s does in 2002 and 2015.
And again, Manning’s 2007 results manage to top Brady’s numbers for his most legendary statistical season (though that probably means nothing since the sample size we’re working with is so small).
So what does this all prove? Well, nothing really. As said, I think the majority of people already have their opinions set for these players – this is just for fun. Hope you enjoyed!
References
| ↑1 | While I am a Peyton Manning fan, I feel the point is valid and logical. We compare stats so often but don’t always take into account that most of those numbers were earned against different teams of varying quality – after all, it’s not fair to compare passing numbers if one guy is going up against the 2002 Bucs while the other is playing the 2015 Saints, right? |
|---|
On Thursday, I looked at quarterbacks from 2016 who started at least 8 games and threw at least 150 passes. For those passers, I calculated how many standard deviations above average they were in Relative ANY/A (i.e., how much better they were, statistically, than average) and in winning percentage. I sorted the list by the difference between the two, to find the quarterbacks whose stats and winning percentages diverged by the largest amounts. And yesterday, I looked at the quarterbacks whose passing stats most greatly exceeded their winning percentage in any given season.
Today, the reverse: the quarterbacks whose winning percentages were much more impressive than their passing numbers. And the 1973 season had by Terry Bradshaw stands out as the most extreme example. In ’73, Bradshaw went 8-1, despite passing stats that were bad even by 1973 standards: he threw 10 TDs, 15 interceptions, and averaged just 4.89 NY/A. Bradshaw ranked 21st in ANY/A at just 2.56 out of 24 qualifying passers. [continue reading…]

Manning didn’t have much help during his career
Yesterday, I looked at quarterbacks from 2016 who started at least 8 games and threw at least 150 passes. For those passers, I calculated how many standard deviations above average they were in Relative ANY/A (i.e., how much better they were, statistically, than average) and in winning percentage. I sorted the list by the difference between the two, to find the quarterbacks whose stats and winning percentages diverged by the largest amounts.
What about historically? I performed the same study going back to 1970. And the season that stands out the most is Archie Manning’s 1980 season. That year the Saints were the worst team in the league: New Orleans went 1-15, and every other team won at least 4 games. [1]The Saints’ troubles continued into the draft; New Orleans selected George Rogers first overall, when two of the top four, and three of the top eight players went on to be Hall of Famers. Manning started every game for the team because he actually had a strong season, at least statistically: he ranked 9th out of 30 qualifying passers in ANY/A, and had a Relative ANY/A of +0.53. That, of course, is pretty unusual given his team’s 1-15 record.
That stands out as the biggest example of a divergence of stats being more impressive than team record. The best 100 seasons (although by default, the table only lists the top 20) are below: [continue reading…]
References
| ↑1 | The Saints’ troubles continued into the draft; New Orleans selected George Rogers first overall, when two of the top four, and three of the top eight players went on to be Hall of Famers. |
|---|

Kessler in a losing effort.
In 2016, Browns rookie quarterback Cody Kessler had an uneven year. He went 0-8, but he ranked 24th in ANY/A out of the 31 quarterbacks who started at least 8 games and threw at least 150 passes. His stats weren’t great, but they weren’t 0-8 bad, either. In PFR’s Adjusted Net Yards per Attempt Index, which attempts to adjust for era, Kessler ranked 15th out of the 43 rookie passers to meet the 8 start/150 attempt threshold. It was a pretty good rookie season that came with an 0-8 record.
And then there was Brock Osweiler. The Texans quarterback — now on the Browns — was dead last with a pitiful 4.34 ANY/A average last season. But for the second year in a row, Osweiler produced a winning record despite poor play; Houston went 8-6 with Osweiler under center.
I calculated the winning percentage and Relative ANY/A (i.e., ANY/A adjusted for era) for each passer since 1970 to meet the 8 start/150 attempt threshold. I then calculated the standard deviations above/below average each passer was in each category. Here are the results for 2016, and here’s how to read the Kessler line: he started 8 games for the Browns and had a 0.000 winning percentage. His Relative ANY/A was -0.34, so just a hair below league average. He was 2.53 standard deviations below average in winning percentage, but only 0.28 standard deviations below average in RANY/A. As a result, he was 2.24 standard deviations better in RANY/A than he was in winning percentage; that was the highest number on the list. Passers at the top had much better stats than wins; passers at the bottom (highlighted by Osweiler) had better wins than stats. [continue reading…]
Adam Steele is back to recap his Wisdom of Crowds work. As always, we thank him for that. Football Perspective wouldn’t be what it is without contributions like this from folks like Adam.
I’d like to thank everyone who voted in this year’s Wisdom of the Crowds, and I also appreciate your patience in waiting for the long overdue recap article. I’m not much for small talk, so let’s get right to it.
Originally, my plan was to simply tally the scores and use the totals for the QB ranking. However, it quickly became evident that this wasn’t going to work, as we had very large discrepancies in how voters allocated their points. Some people awarded 25 points to their pick for best ever, while others didn’t give any QB more than six points. It would be just plain wrong for one voter’s GOAT to be weighted four times more than the next voter. My solution (helmet knock to commenter hscer [1]I highly encourage you to check out hscer’s collection of Sporcle quizzes., since he came up with it) is to tabulate points in proportion to the highest score on each ballot. Thus, a QB who scores five points on a ballot with a 25 maximum receives 0.2 ranking points, while a five-pointer on a ballot with a maximum of six is awarded 0.83 ranking points. This levels the playing field for all ballots, and in my opinion yields a far more honest result than the simple tally method. Since the abstract concept of ranking points is tough to put in proper context, I’ve translated them into Share %, which is the percentage of possible points earned. We had 51 legal ballots submitted this year, so Share % = ranking points / 51.
Results
In order to qualify for a WOC ranking, a quarterback had to be listed on a minimum of three ballots, leaving us with 36 qualifying QB’s. The table below lists the quarterbacks’ Share %, ballot appearances, “pantheon” appearances (ballots where he received at least 0.5 ranking points), and ballots where he received the highest score (including ties). I also included the ranking each QB earned in the 2015 edition of this exercise, as well as the number of positions gained or lost from 2015 to 2017. [continue reading…]
References
| ↑1 | I highly encourage you to check out hscer’s collection of Sporcle quizzes. |
|---|
Touchdown/Interception ratio isn’t an official statistic, so here’s something you probably didn’t know. Among qualifying passers (minimum 14 pass attempts per team game), either Tom Brady or Aaron Rodgers has led the league in this category in 6 of the last 7 seasons. The one exception? Nick Foles in 2013.
Brady has lead the NFL in TD/INT ratio four times: 2007, 2010, 2015, and 2016. That’s tied for the most in football history, with Roger Staubach and Charlie Conerly. The table below shows the leaders in pro football (combining the AAFC and AFL with the NFL) in each year since 1946:
Last year, Tyrod Taylor led all quarterbacks with 580 rushing yards. Colin Kaepernick, in 12 games, ranked 2nd with 468 rushing yards, and no other quarterback had even 400 rushing yards. But Aaron Rodgers, Blake Bortles, Cam Newton, Marcus Mariota, and Andrew Luck all had at least 300 rushing yards, so 7 out of 32 teams had a quarterback with at least that many yards.
How does that compare historically? Two years ago, in one of my favorite posts/methodologies, I looked at how to measure quarterback rushing yards. Here’s what I did.
1) Calculate the percentage of league-wide passing yards by each player in each season. For example, Tyrod Taylor was responsible for 2.3% of all passing yards in 2016.
2) Calculate the weighted average league-wide rushing yards for each season. So we take the result in step 1 and multiply that by each player’s number of rushing yards. For Taylor, this means multiplying 2.3% by 580 for a result of 13.4 rushing yards. Perform this calculation for each player in each season and sum the results to obtain a league-wide total. For 2016, this total was 150.9 rushing yards (obviously Taylor was the biggest contributor among quarterbacks).
3) For non-16 game seasons, pro-rate to 16 games.
Perform this calculation for each season since 1950, and you get the following results: [continue reading…]
Ben Roethlisberger takes a lot of sacks. Since entering the league in 2004, he has nearly 100 more sacks than any other quarterback. I thought it would be interesting to look at the leaders in sacks taken over rolling 5-year periods.
Over the last 5 years, the most sacked quarterback is Ryan Tannehill, who may be going down a Roethlisberger-like path. Tannehill has surprisingly only missed 3 games in his 5-year career, but I’d say the odds of him continuing to take sacks at a high rate and playing 16 game seasons is pretty low.
As for Roethlisberger, he had the most sacks taken from ’04 to ’08, ’05 to ’09, ’06 to ’10, ’07 to ’11, and ’09 to ’13; he was 2nd from ’08 to ’12, just four sacks behind Aaron Rodgers. That was the only thing stopping Ben from leading for a whopping 6 straight 5-year periods.
Here’s a list of the leader for every 5-year period beginning in 1969, which is as far back as PFR’s sack data goes: [continue reading…]
Brad Oremland is a longtime commenter and a fellow football historian. Brad is also a senior NFL writer at Sports Central. There are few who have given as much thought to the history of quarterbacks and quarterback ranking systems as Brad has over the years. What follows is Brad’s latest work on quarterback statistical production.
Author’s Note: This is a very long post, but I discourage you from skimming it. Wait to read it until you can go over it without feeling distracted.
Two years ago, I wrote an exhaustive series on the greatest quarterbacks of all time. That was a subjective ranking, but I also discussed the formula for Quarterback Total Statistical Production, QB-TSP. This post concerns that stat, QB-TSP, so you may want to read that link if you haven’t already.
I’ve made three minor adjustments to the formula since that writing: [continue reading…]
For his career, Jay Cutler is 68-71, which would put him just a hair below .500. He’s also 1-1 in the playoffs.
For his career, Jay Cutler has averaged 5.88 Adjusted Net Yards per Attempt, while the league average over that span has been 5.85 ANY/A, putting him just a hair above average.
Cutler wasn’t drafted to be league average, and he’s been a polarizing player for much of his career. He hasn’t quite fulfilled the high potential he had as a prospect, but he’s also been a bit better than the critics suggest, too. He’s not great, he’s not bad, he’s… average.
One thing that’s kind of interesting: his record hasn’t really correlated with his passing efficiency numbers. The correlation coefficient between his Relative ANY/A — that is, his ANY/A minus league average — and his winning percentage is just 0.21. [continue reading…]
With the 2nd pick in the 2nd round of the 2016 Draft, the Cowboys drafted Notre Dame linebacker Jaylon Smith at 34th overall. Smith tore his ACL and MCL in the Fiesta Bowl, but Dallas was willing to take the risk with by giving Smith a redshirt season.
With the 41st pick, Buffalo traded up for linebacker Reggie Ragland, who wound up missing his entire rookie season after tearing the ACL in his left knee in training camp. With the 50th pick, Houston drafted offensive lineman Nick Martin, who also was injured in training camp and wound up missing his entire rookie year.
Those three players, and Bengals first round pick William Jackson (who tore his pec in August), were four of the five players selected in the first two rounds of the 2016 Draft who failed to see the field. Jets second round pick, quarterback Christian Hackenberg, was the fifth.
That makes Hackenberg the 17th quarterback since the common draft (1967) to fail to make the field as a rookie despite being drafted in the first or second round. For the most part, that’s because those quarterbacks were behind entrenched starters. [continue reading…]
Adam Steele is back with some Wisdom of Crowds work. As always, we thank him for that.
In 2015 we ran a pair of Wisdom of the Crowd exercises, one for quarterbacks and one for running backs. Participation was high and the ensuing discussions were plentiful, so I decided to bring the idea back this year. First up are quarterbacks, but there will be new rules this time around. The previous edition asked voters to rank their quarterbacks 1-25, with points scored in linear fashion based on the ranking from each ballot. While that method was simple, it left a lot to be desired. Most notably, voters weren’t able to indicate the magnitude of difference between the QB’s on their lists, so the difference between 24th and 25th was worth the same as the difference between 1st and 2nd. That’s just plain wrong.
New Rules
1) Each voter will be allotted 100 Greatness Points to distribute to quarterbacks as he or she wishes, with a few caveats.
2) The maximum points given to a single QB may not exceed 25.
3) Ballots must include a minimum of ten quarterbacks, with a maximum of 40.
4) Points must be assigned as whole numbers.
Just as before, you are free to use whatever definition of Greatness you see fit. If you have trouble getting started, it’s helpful to list every quarterback that you consider Great, then distribute points based on the relative standing among the quarterback you listed. In order for this exercise to work properly, please submit your ballot before reading anyone else’s; we want each opinion to be as independent as possible. Your ballot will not be counted if the points don’t add up to exactly 100, although I will let you know and give you a chance for revision. Here is an example of how I’d like your ballot to look (of course yours may include more quarterbacks): [continue reading…]
Today’s guest post/contest comes from Thomas McDermott, a licensed land surveyor in the State of California, a music theory instructor at Loyola Marymount University, and an NFL history enthusiast. As always, we thank him for his hard work. You can view all of his work at Football Perspective here.
I wrote this article last year, when I generated the statistics and then ranked all starting quarterbacks in 2015 based on how well they played in “clutch” [1]Note that throughout this post, anything that happens within this situation is termed “clutch”; as in “clutch yards”, “clutch plays”, “clutch touchdown”, etc. situations. I used a simple definition: if it occurred in the 4th quarter or overtime, when the game was tied or the quarterback’s team was trailing by as much as one score (8 points), then it was a clutch situation.
The main metric used was Bryan Frye’s Total Adjusted Yards per Play, and today we’ll use the same methodology [2]In my post last year, I included a 2-point conversion bonus of 15 yards which I’m going to leave out for now. Besides not really adding much to the study, when I started collecting the data for the … Continue reading to find the 2016 Clutch Value Leader as well as the single season leaders since 1994. Here’s Bryan’s TAY/P formula, which Chase supports as an all-encompassing basic measure of quarterback performance:
(passing & rushing yards + (touchdowns * 20) – (interceptions * 45) – (fumbles lost * 25) – ( sack yards)) / (pass attempts + rush attempts + sacks) [3]Note that Bryan uses a 25-yard penalty for all fumbles (lost or recovered) while this study uses that penalty for lost fumbles only (which are the only ones being counted here).
The other change I’m making from the previous post, is that I’ll be using a 3-year rolling league average, as opposed to a single year league average, when adjusting for era. Thanks to Bryan (through his great website GridFe) for providing me with that information.
So let’s get to it. Below are the quarterbacks in 2016 who had at least 30 clutch action plays, [4]For 2015, I used 24 actions plays as the cutoff, after looking at the numbers more when doing the single-season rankings, 30 seemed more appropriate. and here’s how to read the table: [continue reading…]
References
| ↑1 | Note that throughout this post, anything that happens within this situation is termed “clutch”; as in “clutch yards”, “clutch plays”, “clutch touchdown”, etc. |
|---|---|
| ↑2 | In my post last year, I included a 2-point conversion bonus of 15 yards which I’m going to leave out for now. Besides not really adding much to the study, when I started collecting the data for the single season and career leaders in this metric, I found that the data on 2-point conversions is somewhat spotty before 2005; in fact, in most cases before 1998, the players involved aren’t even mentioned. So, for those of you who read the last post, taking away that conversion bonus means Eli Manning is at the top for 2015 and not Jay Cutler. |
| ↑3 | Note that Bryan uses a 25-yard penalty for all fumbles (lost or recovered) while this study uses that penalty for lost fumbles only (which are the only ones being counted here). |
| ↑4 | For 2015, I used 24 actions plays as the cutoff, after looking at the numbers more when doing the single-season rankings, 30 seemed more appropriate. |
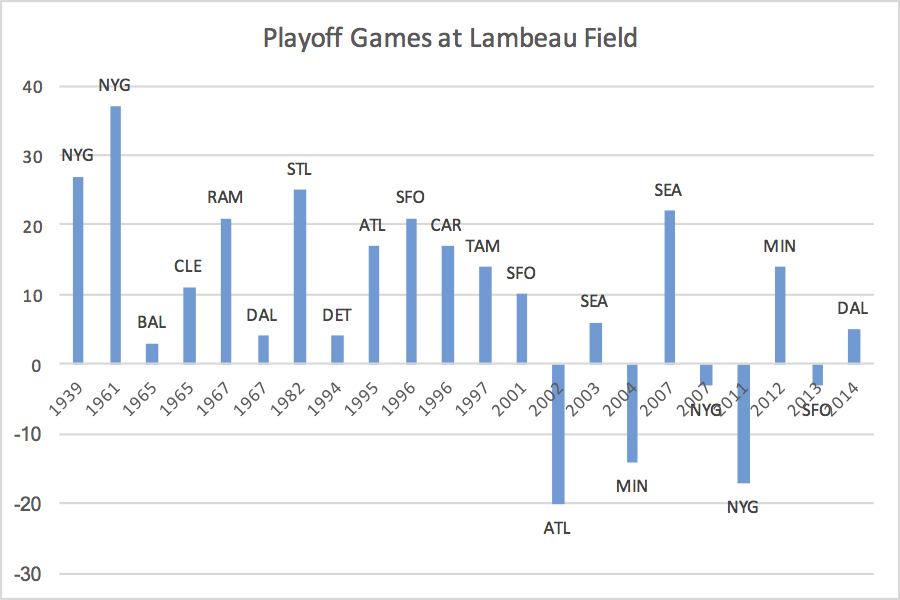
The Packers won every home playoff game for over 60 years. Green Bay was 13-0 at home in playoff games until Michael Vick and the Atlanta Falcons won as 6.5-point underdogs at the end of the 2002 season. Since that 13-0 start, the Packers are a much less intimidating 5-4 in the postseason. Below is the points differential in every playoff game in Green Bay in NFL history:
Nobody wants to be compared to Ryan Leaf, so it tells you all you need to know about Jared Goff‘s rookie season that such a headline doubles as a legitimate question. Let’s start with the raw stats, even though we know the passing environment has changed significantly since 1998:
| Passing | Rushing | ||||||||||||||||||||||
|---|---|---|---|---|---|---|---|---|---|---|---|---|---|---|---|---|---|---|---|---|---|---|---|
| Rk | Player | Year | G | QBrec | Cmp | Att | Cmp% | Yds | TD | Rate | Lng | Int | Sk | Yds | Y/A | AY/A | NY/A | ANY/A | Att | Yds | TD | Y/A | Lng |
| 1 | Jared Goff | 2016 | 8 | 0-7-0 | 112 | 205 | 54.6 | 1089 | 5 | 63.6 | 66 | 7 | 26 | 222 | 5.3 | 4.26 | 3.75 | 2.82 | 8 | 16 | 1 | 2.0 | 6 |
| 2 | Ryan Leaf | 1998 | 10 | 3-6-0 | 111 | 245 | 45.3 | 1289 | 2 | 39.0 | 67 | 15 | 22 | 140 | 5.3 | 2.67 | 4.30 | 1.93 | 27 | 80 | 0 | 3.0 | 20 |
Provided by Pro-Football-Reference.com: View Original Table
With the 2016 season in the books, let’s take a look at the final ANY/A differential numbers. As regular readers know, ANY/A is simply yards per attempt that includes sack data and has a 20-yard bonus for passing touchdowns and a 45-yard penalty for interceptions.
ANY/A differential is one of the best measures of team play. This season, Atlanta very narrowly edged New England for the ANY/A differential crown. No team finished in the top 8 of both offensive ANY/A and defensive ANY/A – a sign of how compressed the league was this season — but the Patriots were closest, ranking 2nd in offensive ANY/A and 9th in defensive ANY/A. But because Atlanta had such a large lead in offensive ANY/A, the Falcons were number one in ANY/A differential even with the 18th best pass defense. [continue reading…]