by Chase Stuart
on January 28, 2014
On Friday, I explained the idea behind Playoff Leverage. That post is required reading before diving in today, but the summary is that the Super Bowl counts for more than the conference championship games, which count for more than the division round games, which count for more than the wild card games. The value that is assigned to each game — the Super Bowl is currently worth 3.14 times as much as the average playoff game — is then used to adjust the stats of the players in those games.
For quarterbacks, the main stat used to measure passing performance is Adjusted Net Yards per Attempt. In case you forgot, ANY/A is defined as
[math]Pass Yards + 20*PassTDs – 45*INTs – SackYards)/(Attempts + Sacks)[/math]
Today, we’re going to look at every quarterback since 1966. Players like Bart Starr and Johnny Unitas who played before 1966 will count, but their stats from 1965 and earlier will not be included. This obviously is a serious disservice to Starr in particular, but for now, I’m going to only focus on the Super Bowl era. [continue reading…]
Tagged as:
Leverage
{ }
by Chase Stuart
on January 24, 2014
Even for Football Perspective, this is a very math-heavy post. I’ve explained all the dirty work and fine details behind this system, but if you want to skip to the results section, I’ll understand. Heck, it might even make more sense to start there and then work your way back to the top.
Background
In 2012, Neil Paine wrote a fascinating article on championship leverage in the NBA, building on Tom Tango’s work on the same topic in Major League Baseball. Championship Leverage was borne out of the desire to quantify the relative importance of any particular playoff game. Truth be told, this philosophy has more practical application in sports where each playoff round consists of a series of games. But Neil applied this system to the NFL playoffs and crunched all the data for every playoff game since 1965. Then he was kind enough to send it my way, and I thought this data would make for a good post.
The best way to explain Championship Leverage is through an example. For purposes of this exercise, we assume that every game is a 50/50 proposition. At the start of the playoffs, the four teams playing on Wild Card weekend all have a 1-in-16 chance of winning the Super Bowl (assuming a 50% chance of winning each of four games). This means after the regular season ended, the Colts had a 6.25% chance of winning the Super Bowl. After beating Kansas City, Indianapolis’ win probability doubled to 12.5%. Win or lose, the Colts’ Super Bowl probability was going to move by 6.25%, a number known as the Expected Delta.
New England, by virtue of a first round bye, began the playoffs with a 12.5% chance of winning the Lombardi. With a win over Indianapolis, the Patriots’ probability of winning the Super Bowl jumped 12.5% to 25%; had New England lost, the odds would have moved from 12.5% to zero. Therefore, the Expected Delta in a Division round game is 12.5%. [continue reading…]
Tagged as:
Leverage
{ }
by Chase Stuart
on January 20, 2014

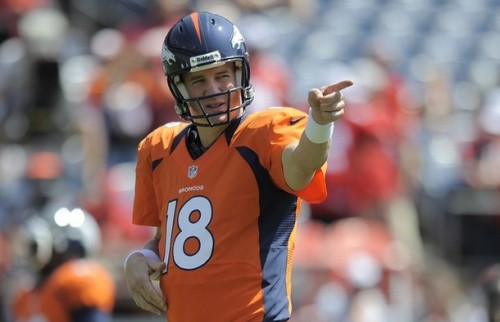
No, Peyton, you're the man.
In 1984,
Dan Marino set an NFL record with 48 touchdown passes, but his Dolphins lost in the Super Bowl. Twenty years later,
Peyton Manning broke Marino’s record, but he lost to the eventual Super Bowl champion Patriots in the playoffs. In 2007,
Tom Brady broke Manning’s touchdowns record, but
he lost in the Super Bowl, too.
When the greatest quarterback seasons of all time are discussed, these three years dominate the discussion. And with good reason. But if you include the playoffs — and frankly, there’s no reason not to include the playoffs — which quarterback produced the greatest season of all time? I’m going to stipulate that the greatest quarterback season ever has to end in a Lombardi Trophy, because otherwise, I think we’ll end up back in the world of Marino ’84/Brady ’07/Manning ’04. Of course, now another Manning season has entered the mix: and with a Super Bowl win, Manning’s 2013 should and would be remembered as the greatest quarterback season of all time.
So, the question becomes, which season would he knock off the top rung? I think there are six seasons that stand out from the rest, based on regular and postseason performance.
Honorable Mention [continue reading…]
Tagged as:
Dan Marino,
Joe Montana,
Kurt Warner,
Peyton Manning,
RANY/A,
Steve Young,
Tom Brady
{ }
by Chase Stuart
on January 19, 2014
The table below shows each Super Bowl champion since 1970 and its rank in various categories. At the top, I’ve included an average of the ranks of the teams over the last 10 years and since 1970, and each team is hyperlinked to its Pro-Football-Reference team page. The categories in this first table are record, points for, points allowed, Pythagenpat record, offensive yards, defensive yards, yards differential, offensive pass yards, offensive rushing yards, defensive passing yards (i.e., passing yards allowed), and defensive rushing yards. [continue reading…]
Tagged as:
Super Bowl
{ }
by Chase Stuart
on January 17, 2014
It’s Carroll-Harbaugh X! Okay, the Whats Your Deal Bowl may not have quite the hype of Brady/Manning XV, but don’t tell that to folks on the West Coast. Pete Carroll and Jim Harbaugh are longtime rivals who have managed to alienate 31 other fanbases in the NFL. For the record, Harbaugh holds a 6-3 record over Carroll, including a 4-2 mark in the NFL. Of course, Carroll’s Seahawks won the last two games at CenturyLink Field, the site of the NFC Championship Game.
Let’s begin our preview by analyzing each team’s passing offense:
Sadly, this post is not sponsored by beats by Dre.
Picking between Colin Kaepernick and Russell Wilson feels like an exercise in hair-splitting. Over the last two seasons, these two have nearly identical passing numbers, ranking 4th and 5th in ANY/A. Kaepernick was slightly better last year, Wilson slightly better this year, and then Kaepernick has been better in the playoffs. By ANY/A standards, this is a complete wash.
What about the weapons? That’s one area where it at least appears like the 49ers have the edge. Michael Crabtree, Anquan Boldin, and Vernon Davis are legitimate stars who combine to give Kaepernick three versatile weapons on every play. A healthy Percy Harvin changes things for Seattle, but with Harvin declared out for the game, Golden Tate, Doug Baldwin, and Zach Miller represent a clear downgrade from the 49ers bunch.
But remember, when we look at the passing statistics of Kaepernick and Wilson, those numbers already incorporate the quality of each quarterback’s targets. After all, a quarterback’s ANY/A or NY/A averages are not mere reflections of the passer, but of the passing offense as a whole. On the other hand, Kaepernick hasn’t had those three players together for most of his career. In fact, the trio has only been available in 7 of Kaepernick’s 28 career starts. In 10 starts, only Crabtree and Davis were on the team, and in another 10, Kaepernick had just Boldin and Davis. The table below shows Kaepernick’s numbers as a starter depending on the availability of his three weapons: [continue reading…]
Tagged as:
49ers,
Colin Kaepernick,
Jim Harbaugh,
Pete Carroll,
Russell Wilson,
Seahawks
{ }
by Chase Stuart
on January 13, 2014
By all accounts, this was an underwhelming quartet of games played on The Best Weekend in Football. Last year, the division round gave us an incredible Russell Wilson comeback where the Seahawks scored three fourth quarter touchdowns before falling short against the Falcons and the Peyton Manning–Joe Flacco–Rahim Moore classic. Seattle won this year but in boring fashion, and Broncos fans undoubtedly prefer this year’s rendition of Neutral-Zone-Infraction to last year’s heartbreak. In 2011, the 9-7 Giants pulled off the rarest of upsets: outclassing the 15-1 Packers and winning a game as huge underdogs while managing to look like the better team in the process. The day before, Alex Smith lead the 49ers in a home upset over the Saints in one of the more exciting playoff games of our generation. In 2009 and 2010, the brash Jets won road games as heavy underdogs in convincing fashion against the Chargers and Patriots. This was the halcyon era of the Mark Sanchez–Rex Ryan Jets, also known as years 3 and 2 Before The Buttfumble. In 2008, the Ravens (over the Titans), Eagles (Giants), and Cardinals (Panthers) all won as road underdogs. The year before, the Giants shocked the Cowboys before that was our Tony Romo-adjusted expectation, and the Chargers won as 11-point underdogs in Indianapolis preventing a Tom Brady–Peyton Manning upset (no such road bump this year).
In some ways, the results this weekend were a good thing. Perhaps we will remember this as the year the division round of the playoffs felt like eating a salad – a bit unsatisfying at the time, but better for us in the long term. No one would complain about seeing more Andrew Luck — actually, maybe some of us would — but getting an AFC Championship Game of Manning and Brady just feels right. We have become so accustomed to seeing fluky teams like the Chargers make runs that we’ve forgotten that it can be very good when the results match our intuition. Back in April I said that the Patriots and Broncos were on a collision course for the AFC Championship Game, although my reasoning wasn’t exactly spot on (“the key to their success is keeping Rob Gronkowski, Aaron Hernandez, and Danny Amendola healthy, although the Patriots will be fine as long as two of them are on the field.”)
But it’s not as if I had some special insight: as noted by Will Brinson, the 49ers, Seahawks, Patriots, and Broncos were the four teams with the best preseason odds. No one would complain about seeing more from the Saints and Panthers, but I don’t think many would argue with the idea that the 49ers and Seahawks are the two most talented teams in the league. A few years from now, there won’t be much we remember from the division round. But I have a feeling it set up two conference championship games that will be very memorable. [continue reading…]
Tagged as:
49ers,
Broncos,
Chargers,
Chuck Pagano,
Colts,
Panthers,
Patriots,
Ron Rivera,
Saints,
Seahawks
{ }
by Chase Stuart
on January 12, 2014
I’m not going to do it again. This time last year, I thought I wrote a very good preview of the Denver/Baltimore game. I looked at both teams, decided that Denver was much, much better, and ended with this:
I think it’s best not to over think this one.
Prediction: Denver 31, Baltimore 13
A year later, and we’re in the same boat. The Broncos just had another marvelous run, again capturing the #1 seed in the AFC on the back of a spectacular season by Peyton Manning. The opponent looks overmatched, at least on paper: the 2012 Ravens had an Simple Rating System score of +2.9, while the 2013 Chargers are at +2.7. The 2012 Broncos had an SRS grade of +10.1, a number that has risen to +11.4 this year. About the only good thing we could say about the 2012 Ravens (relative to Denver) was that they were getting healthier. About the only good thing we can say about the 2013 (relative to Denver) is that they’re getting hotter. And, I suppose, they’re healthier, too, at least compared to a Broncos team that is missing Von Miller, Ryan Clady, Rahim Moore, and Dan Koppen. So no, I’m not just going to assume Denver will win and move on.
I suppose some of you out there are thinking, “Hey, wait a minute. The Chargers beat the Broncos in Denver in the regular season. Doesn’t that mean something?” Well, tell that to the 1934 Bears, who went 13-0 and beat the Giants in the Polo Grounds in the regular season only to lose 30-13 at that same spot in the playoffs! Okay, presumably Denver/San Diego won’t flip on the shoe selection of the competitors, but the larger point remains: road teams that played a rematch in the playoffs against a team they beat at that same venue in the regular season are just 18-32.
Here’s how to read the table below. In 2010, the Seahawks went on the road to play the Bears after beating them in the regular season, 23-20. Seattle met in Chicago in the Division Round of the playoffs, and the Seahawks were 10-point underdogs. Seattle lost, 35-24.
[continue reading…]
Tagged as:
Broncos,
Chargers
{ }
by Chase Stuart
on January 11, 2014
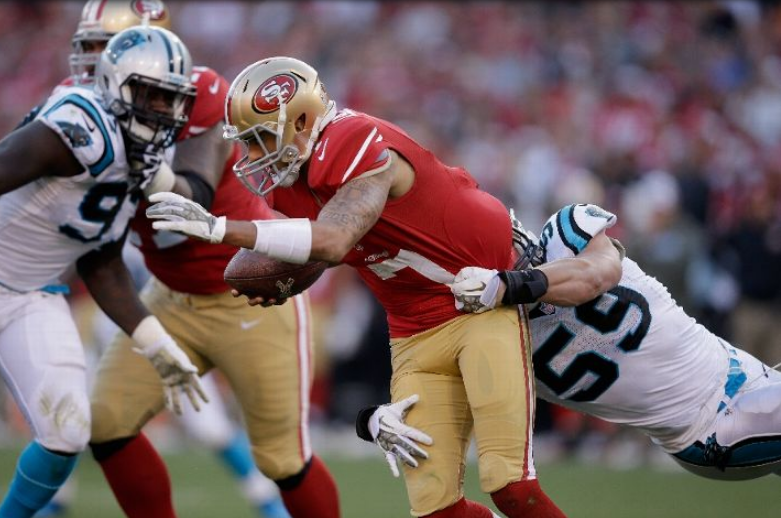
At least 400 total yards were gained in every game this season. When Nick Foles threw 7 touchdowns against the Raiders, Oakland actually out-gained Philadelphia, and the two teams combined for a season-high 1,102 yards that day. On the other end of the spectrum was San Francisco/Carolina I, when the two teams combined for just 401 yards. That first game was essentially the NFL’s version of LSU/Alabama, and I don’t think the rematch will be very different.
When these two teams take the field on Sunday, the opponent will feel familiar for a couple of reasons. One, of course, is because of the week ten match-up. But these teams are also mirror images of each other. Consider:

Kuechly and Kaepernick are just two of the many stars in this game.
Tagged as:
49ers,
Cam Newton,
Colin Kaepernick,
Panthers
{ }
by Chase Stuart
on January 10, 2014
When it comes Patriots/Colts, it’s easy to want to focus on Tom Brady vs. Andrew Luck. Or to marvel at the sheer number of star players these teams have lost in the last 12 months. If you played college in the state of Florida, you’re probably not going to be playing in this game: T.Y. Hilton is the last star standing with Vince Wilfork, Aaron Hernandez, Brandon Spikes, and Reggie Wayne gone. The Patriots also have placed Rob Gronkowski, Sebastian Vollmer, Jerod Mayo, Tommy Kelly and Adrian Wilson on injured reserve, while Devin McCourty and Alfonzo Dennard are both questionable. Also, of course, Brady is probable with a shoulder.
The Colts just put defensive starters Gregory Toler and Fili Moala on injured reserve, adding to a list that already included Wayne, Ahmad Bradshaw, Vick Ballard, Dwayne Allen, Donald Thomas, Montori Hughes, and Pat Angerer. LaRon Landry and Darrius Heyward-Bey are both questionable, and the latter’s injury caused the team to sign ex-Patriot Deion Branch.
All the injuries and changing parts make this a pretty tough game to analyze. So I’m not going to, at least not from the usual perspective. Instead, I want to take a 30,000 foot view of the game. According to Football Outsiders, the Patriots were the most consistent team in the league this season, while the Colts were the fourth least consistent team. Rivers McCown was kind enough to send me the single-game DVOA grades for both teams this season, and I’ve placed those numbers in the graph below with the Colts in light blue and the Patriots in red. The graph displays each team’s single-game DVOA score for each game this season, depicted from worst (left) to best (right). For Indianapolis, the graph spans the full chart, from the worst game (against St. Louis) to the best (against Denver). As you can see, the portion of the graph occupied by New England is much narrower, stretching from Cincinnati to Pittsburgh. [continue reading…]
Tagged as:
Andrew Luck,
Colts,
Normal Distribution,
Patriots,
Tom Brady
{ }
by Chase Stuart
on January 10, 2014

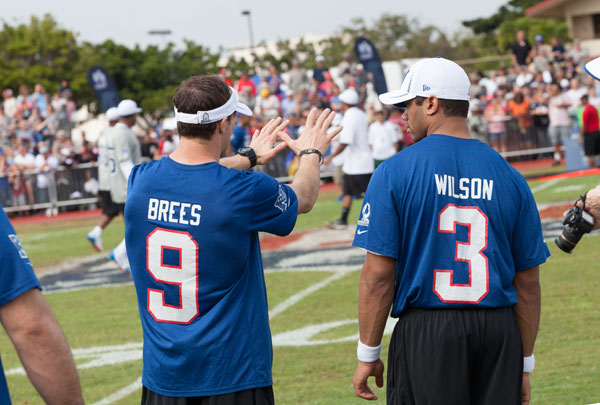
Brees and Wilson scheming to get on an amusement park ride.
On the surface, this does not appear to be a very even matchup. In home games in 2013, Seattle outscored opponents by 15.4 points per game, an average that includes the loss to Arizona. In road games during the regular season, the Saints were outscored by 4.6 points per game. Both of those averages, of course, include Seattle’s
27-point demolition of the Saints in Seattle just six weeks ago. The 20-point difference between Seattle’s average home margin and the New Orleans’ average road margin — which, for brevity’s sake, I’m going to call the “projected MOV” — is very high, even by historical standards. In fact, only 20 playoff games since 1950 featured a game with a larger projected MOV.
The table below shows the 50 playoff games with the largest projected MOV since 1950, measured from the perspective of the home team. For games since 1978, I’ve also shown the pre-game points spread. The largest projected MOV came in 1998, when the Vikings hosted the Cardinals in the playoffs. That year, Minnesota outscored teams by 23.6 points per game at home, while Arizona was outscored by 9.1 PPG on the road. Those numbers combine for a projected MOV for Minnesota of nearly 33 points! The game took place during the division round of the playoffs and the Vikings were 16.5-point favorites. You can click on the boxscore link to see the PFR boxscore for the game, which Minnesota won, 41-21.
| Year | Home | Road | Hm PD/G | Rd PD/G | Proj MOV | Rd | Spread | Boxscore | PF | PA | W/L |
| 1998 | MIN | ARI | 23.63 | -9.13 | 32.75 | D | -16.5 | Boxscore | 41 | 21 | W |
| 1991 | WAS | DET | 22.88 | -7.5 | 30.38 | C | -14 | Boxscore | 41 | 10 | W |
| 1973 | MIA | CIN | 21.86 | -6.71 | 28.57 | D | | Boxscore | 34 | 16 | W |
| 1991 | WAS | ATL | 22.88 | -4 | 26.88 | D | -11.5 | Boxscore | 24 | 7 | W |
| 1999 | STL | TAM | 24.63 | -2 | 26.63 | C | -14 | Boxscore | 11 | 6 | W |
| 1969 | MIN | CLE | 24.29 | -1.86 | 26.14 | C | | Boxscore | 27 | 7 | W |
| 1978 | DAL | ATL | 14.75 | -11.25 | 26 | D | -15 | Boxscore | 27 | 20 | W |
| 1987 | SFO | MIN | 20.29 | -4.13 | 24.41 | D | -11 | Boxscore | 24 | 36 | L |
| 1979 | PIT | HOU | 20.38 | -4 | 24.38 | C | -9.5 | Boxscore | 27 | 13 | W |
| 1950 | RAM | CHI | 23.5 | -0.17 | 23.67 | D | | Boxscore | 24 | 14 | W |
| 2008 | CAR | ARI | 15.38 | -7.88 | 23.25 | D | -10 | Boxscore | 13 | 33 | L |
| 1999 | STL | MIN | 24.63 | 1.38 | 23.25 | D | -7 | Boxscore | 49 | 37 | W |
| 1977 | RAM | MIN | 18.86 | -4 | 22.86 | D | | Boxscore | 7 | 14 | L |
| 1997 | DEN | JAX | 22 | -0.38 | 22.38 | W | -6.5 | Boxscore | 42 | 17 | W |
| 2011 | NOR | DET | 23.25 | 1 | 22.25 | W | -10.5 | Boxscore | 45 | 28 | W |
| 2007 | NWE | JAX | 21.5 | 1 | 20.5 | D | -13.5 | Boxscore | 31 | 20 | W |
| 1996 | PIT | IND | 15 | -5.38 | 20.38 | W | -8 | Boxscore | 42 | 14 | W |
| 1996 | CAR | DAL | 16.5 | -3.75 | 20.25 | D | 3.5 | Boxscore | 26 | 17 | W |
| 1996 | DEN | JAX | 14.38 | -5.88 | 20.25 | D | -12.5 | Boxscore | 27 | 30 | L |
| 1979 | PIT | MIA | 20.38 | 0.25 | 20.13 | D | -9.5 | Boxscore | 34 | 14 | W |
| 2004 | ATL | STL | 6.88 | -12.88 | 19.75 | D | -6.5 | Boxscore | 47 | 17 | W |
| 2011 | GNB | NYG | 18.75 | -0.88 | 19.63 | D | -8 | Boxscore | 20 | 37 | L |
| 2007 | NWE | SDG | 21.5 | 1.88 | 19.63 | C | -14 | Boxscore | 21 | 12 | W |
| 1989 | SFO | MIN | 14.88 | -4.38 | 19.25 | D | -7.5 | Boxscore | 41 | 13 | W |
| 1985 | CHI | RAM | 19.5 | 0.25 | 19.25 | C | -10.5 | Boxscore | 24 | 0 | W |
| 1969 | MIN | RAM | 24.29 | 5.14 | 19.14 | D | | Boxscore | 23 | 20 | W |
| 1969 | DAL | CLE | 17.29 | -1.86 | 19.14 | D | | Boxscore | 14 | 38 | L |
| 2009 | NWE | BAL | 18.38 | -0.63 | 19 | W | -4 | Boxscore | 14 | 33 | L |
| 1973 | MIA | OAK | 21.86 | 2.86 | 19 | C | | Boxscore | 27 | 10 | W |
| 1998 | NYJ | JAX | 16.38 | -2.5 | 18.88 | D | -9 | Boxscore | 34 | 24 | W |
| 2012 | DEN | BAL | 16.13 | -2.63 | 18.75 | D | -9 | Boxscore | 35 | 38 | L |
| 2005 | SEA | WAS | 16.75 | -1.88 | 18.63 | D | -8.5 | Boxscore | 20 | 10 | W |
| 1985 | MIA | CLE | 13 | -5.63 | 18.63 | D | -10.5 | Boxscore | 24 | 21 | W |
| 1979 | SDG | HOU | 14.63 | -4 | 18.63 | D | -8 | Boxscore | 14 | 17 | L |
| 1977 | DAL | MIN | 14.57 | -4 | 18.57 | C | | Boxscore | 23 | 6 | W |
| 1998 | MIN | ATL | 23.63 | 5.25 | 18.38 | C | -11 | Boxscore | 27 | 30 | L |
| 1998 | DEN | MIA | 14.63 | -3.25 | 17.88 | D | -13.5 | Boxscore | 38 | 3 | W |
| 2011 | SFO | NYG | 16.75 | -0.88 | 17.63 | C | -2 | Boxscore | 17 | 20 | L |
| 1999 | JAX | MIA | 13.63 | -3.88 | 17.5 | D | -8 | Boxscore | 62 | 7 | W |
| 1954 | CLE | DET | 21.67 | 4.17 | 17.5 | C | | Boxscore | 56 | 10 | W |
| 1991 | HOU | NYJ | 15.63 | -1.75 | 17.38 | W | -9 | Boxscore | 17 | 10 | W |
| 2001 | PIT | BAL | 14.5 | -2.75 | 17.25 | D | -5.5 | Boxscore | 27 | 10 | W |
| 1963 | SDG | BOS | 12.86 | -4.29 | 17.14 | C | | Boxscore | 51 | 10 | W |
| 2012 | BAL | IND | 9.38 | -7.63 | 17 | W | -7 | Boxscore | 24 | 9 | W |
| 1997 | SFO | MIN | 15.38 | -1.63 | 17 | D | -11.5 | Boxscore | 38 | 22 | W |
| 1998 | DAL | ARI | 7.75 | -9.13 | 16.88 | W | -7 | Boxscore | 7 | 20 | L |
| 1969 | OAK | HOU | 13.71 | -3.14 | 16.86 | D | | Boxscore | 56 | 7 | W |
| 1967 | OAK | HOU | 21.71 | 4.86 | 16.86 | C | | Boxscore | 40 | 7 | W |
| 1996 | GNB | CAR | 18.88 | 2.13 | 16.75 | C | -12 | Boxscore | 30 | 13 | W |
| 1988 | CIN | SEA | 15.38 | -1.38 | 16.75 | D | -6.5 | Boxscore | 21 | 13 | W |
[continue reading…]
Tagged as:
Drew Brees,
Russell Wilson,
Saints,
Seahawks
{ }
by Chase Stuart
on January 9, 2014
Steve Buzzard has agreed to write another guest post for us. And I think it’s a very good one. Steve is a lifelong Colts fan and long time fantasy football aficionado. He spends most of his free time applying advanced statistical techniques to football to better understand the game he loves and improve his prediction models.
Last month, I wrote about how to project pass/run ratios using offensive Pass Identities and the point spread. However, this methodology only considers one side of the ball. Can we actually improve our projections model using both offensive and defensive Pass Identities? As it turns out the answer is yes.
First, I started off by creating defensive Pass Identities using the same methodology found here. The first thing I noticed was the standard deviation of pass ratios for defenses was only 3.0% compared to 5.1% for offenses. This led me to believe that offenses control how much passing goes on in a game more than defenses. I was glad to see this as it confirmed most of my previous research as well. Given this, it wasn’t appropriate to use a standard deviation of 3.0% for defenses in my projection while using a standard deviation of 5.1% for offenses. Instead, I used the combined standard deviation of all 64 offensive and defensive pass ratios, which turned out to be 4.17%. This doesn’t change the order of passer identities much but obviously does increase the deviation from the mean for the offensive side of the ball and decrease it for the defensive side. [Chase note: Determining the best way to handle the differing spreads between offensive and defensive pass ratios is a good off-season project; in the interest of time, I advised Steve to split the difference and move ahead with the analysis.]
Now that we have a Pass Identity grades for both sides of the ball, we can add a strength of schedule adjustment, too. To make the SOS adjustment, I simply took the average of the defensive Pass Identities played by each offensive unit and the average of the offensive Pass Identities played by each defensive unit. As expected the SOS adjustments had a much larger impact on the defensive Pass Identities than the offensive Pass Identities.
[continue reading…]
Tagged as:
Game Scripts,
Guest Posts,
Pass Identity
{ }
by Chase Stuart
on January 8, 2014
Did notice the lack of yellow flags this weekend? In the first round of the 2013 playoffs, just 31 penalties were called over four games, a 7.75 per-game average. That’s the lowest per-game average from any week this season, and the 63.25 penalty yards assessed also represent the floor on a per-game basis for any week in 2013.
In 2012, Wild Card weekend was also the least penalized weekend of that season, on both a penalty and penalty yards basis. That is, until the later rounds of the playoffs. As it turns out, these examples are part of a broader trend in the NFL for over a decade.
The graph below shows the average number of penalties called per team game in both the regular season and the postseason going back to 2000. Obviously for 2013, we’re looking at just four games, but for each other postseason, I included all 11 games. [continue reading…]
Tagged as:
Penalties
{ }
by Neil Paine
on January 6, 2014
Love the Bowl Championship Series or (more likely) hate it, tonight marks the end of college football’s 16-year BCS experiment. Designed to bring some measure of order to the chaotic state college football had been in under the Bowl Alliance/Coalition, the BCS did streamline the process of determining a national champion — though it was obviously not without its share of controversies either.
If various opinion polls conducted over the years are any indication, the public is ready to move on from the BCS to next season’s “plus-one”-style playoff system. But before it bids farewell forever, how does the BCS grade out relative to other playoff systems in terms of selecting the best team as a champion?
Back in 2008, I concluded that it didn’t really do much worse of a job than a plus-one system would have. But that was more of an unscientific survey of the 1992-2007 seasons than a truly rigorous study. Today, I plan to take a page from Doug’s book and use the power of Monte Carlo simulation to determine which playoff system sees the true best team win the national title most often.
(Note: If you just want the results and don’t want to get bogged down in the details, feel free to skip the next section.) [continue reading…]
{ }
by Chase Stuart
on January 5, 2014
The table below shows the results of every game in the division round of the playoffs from 1990 to 2012. Each game is displayed from the perspective of the home team. For example, last year, Denver hosted Baltimore in the second round of the playoffs, and you can click on the Boxscore link to see the full boxscore at Pro-Football-Reference. Denver lost 38-35 as a 9-point favorite, and the Over/Under was 44.5. The “dnc” means that the Broncos did not cover.
Overall, home teams are 67-25 and 49-42-1 against the spread.
{ }
by Chase Stuart
on January 5, 2014
After the projections for most of the week was below-zero weather, the latest reports indicates that by kickoff, the temperature in Green Bay should be in the single digits. The temperature of a game is more open to interpretation than you think: in a lot of the games below, there are different reports depending on which source you use. That said, I’ve found six playoff games that had a temperature of zero degrees or colder:
- The Ice Bowl: The classic cold-weather game: the temperature was reportedly −15 degrees with an average wind chill around −36, although PFR has it at -2 degrees and -23, respectively. The Packers won 21-17, after Bart Starr‘s quarterback sneak for the winning score in the final seconds.
- The Freezer Bowl: In 1981, the Chargers played in Cincinnati in -9 degree weather; add in the 27 miles per hour winds, and it felt more like −37 degrees. PFR has those numbers at -6 degrees, wind 24 mph, wind chill -32. Cincinnati won 27-7, to advance to the Super Bowl.
- The 2007 NFC Championship Game: This was the Giants/Packers game where half of Coughlin’s face turned Giants red. New York won in overtime, 23-20, before upsetting the Patriots in Super Bowl XLII. The gamebook lists the temperature at -1 degrees, with a wind chill of -23. PFR has it at -7 degrees, with a brutal wind chill of -27.
- Washington at Chicago, 1987: PFR has this one at -3 degrees with a wind chill of -20. Classic Ditka weather! Here’s the video to the CBS intro with John Madden and Pat Summerall (note that the broadcast states it was 12 degrees, with a wind chill feel of -5.). Washington won, 21-17, and eventually won the Super Bowl.
- Indianapolis at Kansas City, 1995. Lin Elliott misses three field goals for the Chiefs, and the Colts win 10-7. PFR has it at 0 degrees, – 15 with wind chill.Some other playoff games come closer.
- When Los Angeles traveled to Buffalo in 1993, it was zero degrees with, according to NFL.com, a wind chill at -32! Jeff Hostetler, who never had a bad playoff game, lost his only playoff game here despite throwing for 230 yards and a touchdown (with no interceptions) on 20 passes. Jim Kelly threw a game-winning touchdown pass to Bill Brooks, and Buffalo won 29-23. PFR lists the temperature at 3 degrees with a wind chill of -14
A pair of playoff games in Lambeau Field in 1996 and Soldier Field in 1963 probably could have been sub-zero games, but noon-time starts kept the temperature on the positive side of the ledger. Ten years ago, the Titans game in New England got the Saturday Night treatment, which allowed the temperature to drop down to 4 degrees with a wind chill -14. And the Browns/Raiders game known simply as Red Right 88 was at 2 degrees with a wind chill of -20.
It looks like today’s game will join the list of freezing playoff games, but may not make the top five.
San Francisco’s Turnover Margin
I think the 49ers are the vastly superior team here, so my pregame analysis will be limited. The Packers are a very average team, and a healthy Aaron Rodgers only makes them above-average. San Francisco led the league in points differential through two quarters and through three quarters, and I can still see this team becoming the next Lombardi Packers. But here’s an interesting stat from Bill Barnwell: [continue reading…]
Tagged as:
49ers,
Packers
{ }
by Chase Stuart
on January 5, 2014
Every few years, a team like the 2013 Chargers makes the playoffs. This season, San Diego’s offense ranked 3rd in Adjusted Net Yards per Attempt, while the defense ranked 3rd to last in the same metric. And these teams, without exception, have flamed out in the playoffs. The Chargers also ranked 2nd in NY/A and 2nd to last in NY/A allowed, but I’m going to focus on ANY/A for the rest of this post.
The worst pass defense to win the Super Bowl was the 1976 Raiders. That year, Oakland’s pass defense produced the 10th worst ANY/A allowed average in the league. The only other Super Bowl champion that ranked in the bottom half of the league in ANY/A allowed was the 2011 Giants, who just barely qualify (New York ranked 17th in ANY/A allowed, or 16th from the bottom).
The table below shows each team since 1970 that ranked in the top five in ANY/A and in the bottom five in ANY/A allowed. Because of the different numbers of teams throughout the league’s history, I ranked teams from worst to best when calculating the ANY/A allowed ranks. The most recent team prior to the ’13 Chargers to make the playoffs while meeting those thresholds was the 2005 Patriots. That team, quarterbacked by Tom Brady and coached by Bill Belichick, ranked 5th in ANY/A and 4th from the bottom in ANY/A allowed. New England went 10-6 that year, and then 1-1 in the playoffs. As you can see, the postseason results for this group have been pretty uninspiring. And, as Chargers fans will notice, it includes a pair of Air Coryell teams: [continue reading…]
Tagged as:
Bengals,
Chargers
{ }
by Neil Paine
on January 4, 2014
One of my favorite sabermetric baseball articles of all time was written by Sky Andrecheck in 2010 — part as a meditation on the purpose/meaning of playoffs, and part as a solution for some of the thorny logical concerns that arise from said mediation.
The basic conundrum for Andrecheck revolved around the very existence of a postseason tournament, since — logically speaking — such a thing should really only be invoked to resolve confusion over who the best team was during the regular season. To use a baseball example, if the Yankees win 114 games and no other AL team wins more than 92, we can say with near 100% certainty that the Yankees were the AL’s best team. There were 162 games’ worth of evidence; why make them then play the Rangers and Indians on top of that in order to confirm them as the AL’s representative in the World Series?
Andrecheck’s solution to this issue was to set each team’s pre-series odds equal to the difference in implied true talent between the teams from their regular-season records. If the Yankees have, say, a 98.6% probability of being better than the Indians from their respective regular-season records, then the ALCS should be structured such that New York has a 98.6% probability of winning the series — or at least close to it (spot the Yankees a 3-0 series lead and every home game from that point onward, and they have a 98.2% probability of winning, which is close enough). [continue reading…]
{ }
by Chase Stuart
on January 4, 2014

I have to deal with Chip Kelly?
Kansas City/Indianapolis Preview
New Orleans Saints (11-5) (+2.5) at Philadelphia Eagles (10-6), Saturday 8:10 PM ET
We’re fully immune to the Saints offense at this point. Drew Brees just threw for for 5,162 yards and 39 touchdowns and it didn’t even register on most radars. One reason for that: both of those numbers represent three-year lows for the Saints star. Jimmy Graham shook off early-season leg injuries to lead the league with 16 touchdowns, and rookie Kenny Stills led the NFL in yards per target. Both Pierre Thomas and Darren Sproles topped 70 receptions — two of just five running backs this year to do so — and I didn’t even know that until five seconds ago. Pinball numbers are the expectation when dealing with the Saints offense.
But the real change is on defense, as the team just finished one of the most remarkable turnarounds in NFL history. Did you know that the Saints finished fourth in points allowed this year? That’s only the fourth time New Orleans has ranked in the top five in that statistic in franchise history, with the other three occurrences all coming during the Dome Patrol era. What makes New Orleans’ success even more remarkable is that the team ranked last in points allowed in 2012. New Orleans is the first team in NFL history to jump 27 spots in the points allowed rankings. Prior to this year, the 2011 Houston Texans (4th after ranking 29th) and 1993 New York Giants (1st after ranking 26th) had been the most improved defenses with 25-slot jumps. Now the Saints probably aren’t as good as their points allowed rank would imply (Football Outsiders has them 9th, Advanced NFL Stats ranks the unit 10th), but unparalleled feats remain astounding.
The main reason for the team’s improvement is the pass defense. The Saints ranked last in Net Yards per Attempt allowed last year, but 7th this season, another remarkable jump. In fact, only 10 teams have ever made a jump of 25 spots in the NY/A allowed rankings: [continue reading…]
Tagged as:
ANY/A,
Eagles,
RANY/A,
Saints
{ }
by Chase Stuart
on January 1, 2014
In my final article of the year at the New York Times, I look at one key statistic for each team.
Denver Broncos: Quarterback Curse
Can Peyton Manning break the hex? Only four quarterbacks — Tom Brady (2007), Rich Gannon (2002), Kurt Warner (2001) and Dan Marino (1984) — have played in a Super Bowl in the season in which they won the passing yards title, with none of the four winning the game. Since 1950, only Johnny Unitas in 1959 and George Blanda in 1961 (in the American Football League) have led their league in passing yards and won a championship in the same season.
Some quarterback will become the first player to pull off this feat at a Super Bowl, and Manning seems as strong a candidate as any: he broke the single-season record for passing yards, a record which is under league review.
The last player to be named the N.F.L.’s most valuable player and win the Super Bowl in the same season was Warner, in 1999. Manning will almost certainly be named the M.V.P. for the fifth time in his career, which means he can end two streaks with one Super Bowl title.
…
Indianapolis Colts: Giant Killers Have Slain San Francisco, Denver and Seattle
Only six teams have ever beaten three teams in the regular season that won 12 or more games. Two of those teams, the 1990 Bills and the 1999 Titans, went on to play in the Super Bowl, while another, the 2003 Patriots, won the Super Bowl. The 2011 Ravens team that lost in the final seconds of the A.F.C. championship game, to New England, is also on the list. The 2002 Saints are the only outlier on the list: New Orleans swept the eventual Super Bowl champion Buccaneers but missed the playoffs.
Indianapolis, of course, is the sixth such team. Few teams run hot and cold like Indianapolis: countering those mammoth victories were embarrassing blowout losses to St. Louis, Arizona and Cincinnati. The Colts would be wise to put the game in Andrew Luck’s hands and waste fewer carries on Trent Richardson, but Indianapolis will not lack confidence entering the playoffs.
…
San Francisco 49ers: Best Team Through Three Quarters
The 49ers followed an N.F.C. championship in 2012 with 1-2 and 6-4 starts this season. As a result, San Francisco is one of the more underappreciated 12-4 teams in recent memory. The 49ers have averaged 18.1 points through the first three quarters of every game, while allowing just 9.6; that 8.5-point differential is the best in the N.F.L. San Francisco has a habit of dominating teams early and letting up on them late: the 49ers have been outscored in the fourth quarters of games this season, 119-117. But will the team be more ruthless in the postseason?
Last year, Jim Harbaugh waited until the playoffs to unleash the full potential of the Pistol offense under Colin Kaepernick. Against the Packers, Kaepernick set an N.F.L. record for rushing yards by a quarterback in a game. San Francisco has operated conservatively this year, and easing up in the fourth quarter of games has hidden how dominant the 49ers can be. Does Harbaugh have another trick up his sleeve for January?
You can view the full article, and the statistics for the other nine teams, here.
Tagged as:
NYT
{ }
by Neil Paine
on January 23, 2013
Those are some clutch shirts.
Eight years ago — almost to the day — our old
PFR colleague Doug Drinen wrote
a Sabernomics post about “The Manning Index”, a metric designed to roughly gauge the clutchness (or chokeitude) of a given quarterback by looking at how he did relative to expectations (he revived this concept in
version two, six years ago). In a nutshell, Doug used the location of the game and the win differential of the two teams involved to establish an expected winning percentage for each quarterback in a given matchup. He then added those up across all of a quarterback’s playoff starts, and compared to the number of wins he actually had. Therefore, quarterbacks who frequently exceeded expectations in playoff games could be considered “clutch” while those who often fell short (like the Index’s namesake,
Peyton Manning) might just be inveterate chokers.
Doug ran that study in the midst of the 2004-05 playoffs, so it shouldn’t be surprising that Tom Brady (who was at the time 8-0 as a playoff starter and would run it to 10-0 before ever suffering a loss) came out on top, winning 3.5 more games than you’d expect from the particulars of the games he started. Fast-forward eight years, though, and you get this list of quarterbacks who debuted after 1977:
[continue reading…]
Tagged as:
Eli Manning,
Peyton Manning,
Playoffs,
Tom Brady
{ }