≡ Menu

In week 9, the Dolphins lost 21-14 to Kansas City. That game was notable because Tua Tagovailoa passed for 193 yards, slightly outgaining Patrick Mahomes, who threw for 185 yards in a winning effort. That doesn’t sound so unusual, especially given how close the totals were: Miami’s quarterback passed for more yards than Kansas City’s quarterback, and Miami lost the game.

But that was unusual: in fact, that is the only game this season where that happened for the Dolphins. In 12 games this year, Miami has had more gross passing yards (excluding sacks) than they have allowed; in those games, the Dolphins are 11-1. In four other games, opposing passers have more passing yards than Dolphins passers; the Dolphins are 0-4 in those games. So in 15 of 16 Miami Dolphins games, the team with more gross passing yards has also won the game.

And that is both rare and a perfect example of the 2023 season.  Because while Miami with Mike McDaniel  and Tua are outliers, the 2023 season is pretty big outlier, too.  In general, throughout the course of NFL history, there is not much of a correlation between which team has more passing yards and which team wins the game. As we know, teams that are trailing late in games throw more frequently — and can rack up the passing yards — than teams with a lead. The same reason you hear starts like “Team X is 15-2 when RB Y has 20 carries or more” is why passing yards isn’t all that correlated with winning. [continue reading…]

{ 0 comments }

There are still three games left to play in the 2023 NFL regular season. And for San Francisco, that includes a game Monday night against the AFC’s best team, the Baltimore Ravens. But let’s just pause for a moment and appreciate how dominant San Francisco has been this year.

On offense, the 49ers are averaging 9.45 Adjusted Net Yards per Attempt. [1]ANY/A is simply yards per attempt, with a 20-yard bonus for sacks, a 45-yard penalty for interceptions, and includes sack data. That is significantly better than the rest of the league; Miami ranks second at 7.89, and Houston ranks third at 7.07. The league average this season is 5.79 ANY/A, meaning San Franciso is averaging 3.66 ANY/A more than the average team. How remarkable is that? Well, if it holds up, it would finish as the third best of the Super Bowl era:

Yes, that means this San Francisco offense — with Brock Purdy, Christian McCaffrey, Deebo Samuel, George Kittle, Brandon Aiyuk, and Trent Williams — is already one of the best of the Super Bowl era even after you adjust for era. [2]Without adjusting for era, the 49ers rank as the 2nd-best passing offense ever. Think about that: every other offense in the Super Bowl era, besides Peyton Manning in his best year and Dan Marino in his best year, has been less efficient than this year’s 49ers team. [continue reading…]

References

References
1 ANY/A is simply yards per attempt, with a 20-yard bonus for sacks, a 45-yard penalty for interceptions, and includes sack data.
2 Without adjusting for era, the 49ers rank as the 2nd-best passing offense ever.
{ 4 comments }

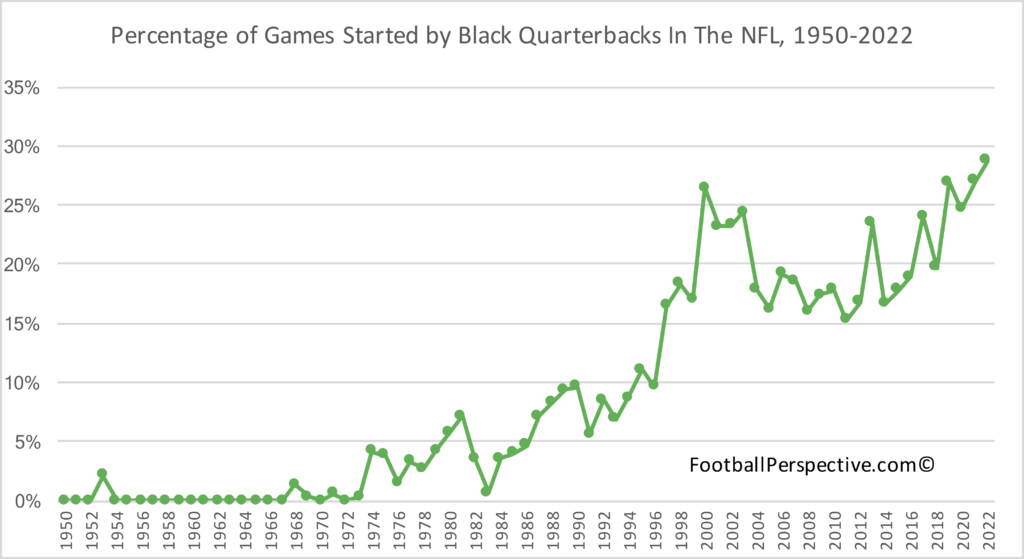
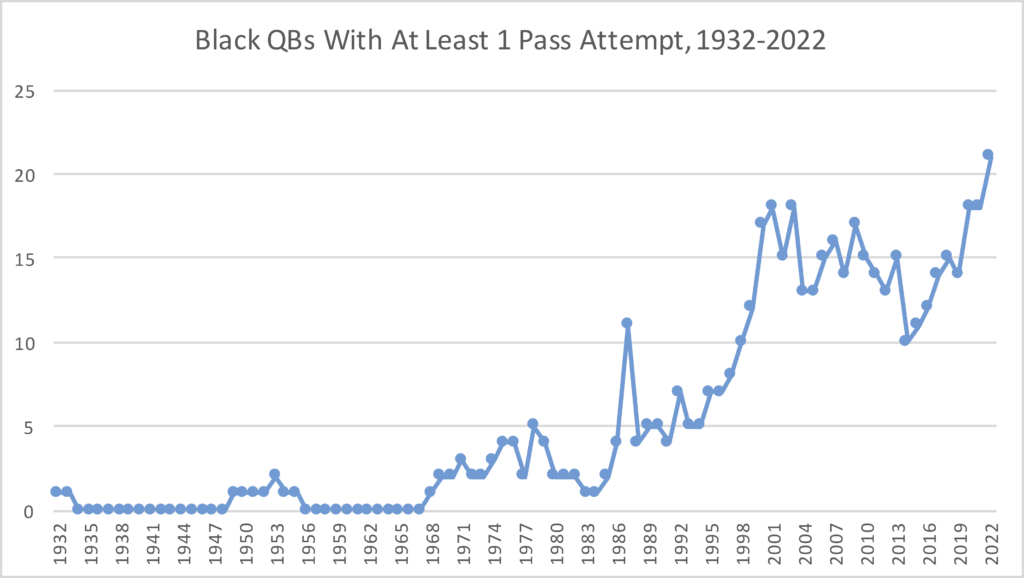
The 2022 season was another groundbreaking season for black quarterbacks in the NFL. There were 21 black quarterbacks who threw at least one pass this year, the highest number in a single season in NFL history. The graph below shows how many black quarterbacks in the NFL [1]Or AFL or AAFC. threw at least one pass in each season since the league began recording passing statistics in 1932:

Black quarterbacks also started 29% of all games, another high-water mark for the league. In 2022, 15 of the league’s 32 teams started a black quarterback in at least one game, including the PFWA Comeback Player of the Year (Seattle’s Geno Smith), the Most Valuable Player in the league (Kansas City’s Patrick Mahomes) and the quarterback of the league’s best team during the regular season (Philadelphia’s Jalen Hurts).

The charts above tell a remarkable story. Consider that the year of the first Super Bowl (1966), there were no black quarterbacks in the AFL or NFL. When Tom Brady was born (1977), there had never been an NFL game where both teams started black quarterbacks. And when Brady was drafted, there had never been two black quarterbacks to face off in an NFL playoff game. Now, on the day that Brady is retiring, it’s a noteworthy sign of progress that we are just days away from the first Super Bowl featuring two black quarterbacks (Mahomes and Hurts). It has been a remarkable journey for black quarterbacks in the NFL, one that started over one hundred years ago. [continue reading…]

References

References
1 Or AFL or AAFC.
{ 4 comments }

San Francisco 49ers rookie quarterback Brock Purdy is on the verge of making NFL history. If the 49ers can upset the Eagles in the NFC Championship Game, Purdy would become the first rookie quarterback to ever start in a Super Bowl.

Only a few rookie “quarterbacks” have ever led a team to an NFL title, with quarterbacks in quotation marks the farther back in time we go. In 1946, a 25-year-old Otto Graham led the Cleveland Browns to an AAFC title in his first season. The prior year, a 25-year-old Bob Waterfield led the NFL in touchdown passes as a rookie and then threw two touchdown passes in the NFL title game to help lead the Rams to their first ring. Perhaps the best rookie season of them all came from Sammy Baugh in 1937, as he led Washington to the championship. And three years earlier, rookie Ed Danowski helped the Giants stage a fourth quarter comeback to beat the Bears in a famous title game.

Purdy has only started five regular season and two playoff games in his NFL career so far, and he sports a perfect 7-0 record. An appearance in Super Bowl LVII would be his 9th NFL start; believe it or not, that would only rank as the third fewest by a starting quarterback in the Super Bowl. On the other hand, at just over 23 years old, Purdy would in fact be the youngest quarterback to start a Super Bowl. [continue reading…]

{ 1 comment }

Zach Wilson and The Worst Passer Rating In The NFL

When the Jets drafted Zach Wilson, the hope was that the kid from BYU would end a long line of Jets draft busts. Because after having their hopes dashed by Mark Sanchez, Geno Smith, and then Sam Darnold, the Jets were due for some good luck. Right?

[continue reading…]

{ 2 comments }

Throughout NFL history, having a strong running offense and a dominant pass defense has been a recipe for success. But the 2022 Eagles are currently doing something that hasn’t been done in 40 or 45 years, depending on your view of the 1982 strike season. Through 13 games, the Eagles have one of the top running games in the NFL. Powered by quarterback Jalen Hurts and running back Miles Sanders, Philadelphia is tied for 2nd in the NFL in rushing yards and leads the NFL in rushing first downs. The Eagles are also averaging 4.87 yards per carry, good enough for 5th best. Meanwhile, Philadelphia’s pass defense has been phenomenal. Even ignoring the NFL-best 15 interceptions (and NFL-best 3.4% interception rate), Eagles opponents are averaging just 4.80 net yards per pass attempt, the top rate in the league.

Yes, that means the Eagles gain more yards per rush than their opponents average per pass. Which is pretty ridiculous!

It’s not unusual for teams to come pretty close here: the Buffalo Bills nearly pulled this one off last season with very similar numbers. Buffalo averaged 4.79 yards per carry and allowed 4.84 net yards per attempt in 2021. [continue reading…]

{ 6 comments }

Let’s Ride Away From The End Zone

In 1946, the Pittsburgh Steelers went 5-5-1. While the sum of the team’s parts may have been perfectly average, their components were far from it. The head coach was newly-hired Jock Sutherland, who had been a local hero after taking the Pitt Panthers to four Rose Bowls. After a stint in the Navy during World War II, he returned to the city and coached the Steelers for two seasons, beginning in 1946. In the 10-team NFL, Pittsburgh allowed the fewest points in the NFL at 10.6 per game, a mark that would not be matched again until the Lombardi Packers in 1962. The NFL average in 1946 was 18.9 points per game, and every other team allowed at least 14.4 points per game. Unfortunately, the Steelers offense was as bad as the defense was good: the black and gold finished last in the league in scoring at 12.4 points per game.

That 1946 team was led by Bill Dudley, an all-world star who won the league’s MVP award. In addition to leading the league in rushing yards… and punt return yards and average… Dudley intercepted 10 passes that season! That remarkable fact came despite the Steelers only facing 162 pass attempts that season, meaning Dudley intercepted one out of every 16.2 passes the Steelers defense saw that season. It remains arguably the greatest season of thievery in NFL history.

Those ’46 Steelers were otherwise an unremarkable team, notable for this one fact: Pittsburgh is the last team to finish as the league’s lowest scoring team and to also allow the fewest points in the league. But this year, the 2022 Denver Broncos are challenging that mark. Through 9 games and 10 weeks of the season, Denver ranks last in scoring and first in points allowed. The Broncos have 131 points scored through 9 games — a very bad number although not a particularly low mark for the league’s worst-scoring team. [1]Last year, Houston scored 128 points through 9 games, and this year, the Colts have just one more point than Denver And they have allowed 149 points despite facing 11.8 drives per game (thanks, offense), tied for the most in the NFL.

A few teams have come close to pulling off this rare achievement, but it’s remarkable to consider that no team has done this since Sutherland’s Steelers. [2]Only one team has gone in the other direction: the 2000 Rams led the league in scoring but also ranked last in points allowed. There have been just 31.1 points per game scored in Broncos games this season.  In the last 25 seasons, only two other times has that happened: the famed 2000 Ravens teams, and the 2005 Bears team that tried to replicate that approach, using Brian Urlacher as Ray Lewis and Kyle Orton as Trent Dilfer. [continue reading…]

References

References
1 Last year, Houston scored 128 points through 9 games, and this year, the Colts have just one more point than Denver
2 Only one team has gone in the other direction: the 2000 Rams led the league in scoring but also ranked last in points allowed.
{ 2 comments }

The Final Score Is: 20-17

October 5th, 1924 was not the most exciting day in pro football history. The Cardinals defeated the Packers 3-0 in a game that was representative of things to come. Elsewhere, the Duluth Kelleys beat the Minneapolis Marines 3-0, the Akron Pros won in Rochester against the Jeffersons by a 3-0 score, and the Milwaukee Badgers hosted and defeated the Kansas City Blues by the score of — you guessed it — three to zero. It was the only time in NFL history that four games all finished with the same score on the same day. [continue reading…]

{ 0 comments }

Football in the Northeast is Back

The New England Patriots, New York Giants, New York Giants and Philadelphia Eagles are undeniably in the northeast. I think most would include the Buffalo Bills are as well, although they do play in western New York. The state of Pennsylvania is commonly included in the northeast, but I don’t think it’s reasonable to include Pittsburgh, on the western border, in as a team in the northeast. The Baltimore Ravens are only 100 miles away from Philadelphia, but they are also only 40 miles from Washington, D.C., and no sensible definition of “Northeast” should include the nation’s capital.

So I’m going to stick with the NE-NYG-NYJ-PHI-BUF pairing as the definition of Northeast football. And only two years ago, it looked really bad: [continue reading…]

{ 1 comment }

Third Down Performance: How Much Is A 3rd Down Worth?

From 2002 to 2021, NFL teams converted 38.9% of all third down attempts. Third down performance is really meaningful when it comes to winning games, but it can also be pretty random from sample to sample. So as a result, third down performance has an outsized performance on who wins and loses that game, but is probably not all that predictable as to who will win the next game.

I thought it would be interesting to look at this in the context of the pre-game point spread. Let’s start with a few basic numbers, looking at this 20-year period.

  • Teams that were favored by 1 to 5.5 points won 58.7% of their games.
  • Teams that were favored by 6 to 8 points won 73.6% of their games.
  • Teams that were favored by more than 8 points won 83.4% of their games.

But let’s say you know that the favorite would lose the third down battle. How does that change things?

  • Teams that were favored by 1 to 5.5 points but were worse on third downs won only 43.4% of their games.
  • Teams that were favored by 6 to 8 points but were worse on third downs won only 54.2% of their games.
  • Teams that were favored by more than 8 points but were worse on third downs won 68.2% of their games.

Now, saying an underdog just needs to win the third down battle is not very helpful, and only a little more precise (and about as useless) as saying they just need to score more points. But it does help to provide some guardrails about the magnitude of third down performance. It can flip a big favorite into a coin flip, and a huge favorite suddenly has a real chance of losing.

Can we quantify exactly how important third down success is? I’m glad you asked. As we know, each team has a 38.9% chance of converting an average third down. Suppose each team has 15 third down attempts in the game. Let’s say one team coverts 10 of 15, while the other only converts five opportunities. The expected number of third down conversions for both teams is 5.8 (0.389 multiplied by 15), so one team converted 4.2 more first downs than expected, while the other converted 0.8 fewer than expected. The net difference, of course, is five conversions — let’s call that the net third downs added. [continue reading…]

{ 3 comments }

Ten years ago, I looked at the passing distribution of NFL teams since 1970. Let’s revisit that post today, with an expanded look at what’s happened over the last decade.

I examined every season in the NFL since 1970, when the AFL and NFL merged. [1]It is not lost on me that NFL history is not linear, and in many ways, the 1960s is more similar to the 1980s than the 1970s. That said, out of laziness, I only went back to 1970. I then calculated the percentage of receiving yards for each team that went to its running backs, tight ends and wide receivers. The graph below shows the breakdown from each season from 1970 through 2021. [2]Some caveats: Obviously many players straddle the line across multiple positions. There are some judgment calls involved with H-Backs, tight ends turned wide receivers, running backs turned tight … Continue reading. There are two large trends: wide receivers have become slightly more important over time, jumping from 53% of the receiving pie during the ’70s to 63% over the last ten years. The entire jump, though, came in the aftermath of the 1978 rules changes, as the percentage of receiving yards that went to wide receivers steadily rose form 53% in 1977 to 62% in 1987 and 1988.

The other notable change is the switch in primacy of the tight end relative to the running back. From 1970 to 1983, running backs gained 27% of all receiving yards while tight ends picked up just 19% of the pie. That breakdown was pretty consistent each season: tight ends were at 18%, 19%, or 20% almost every season, and running backs consistently gained between 25% and 29& of the receiving game. The 1984 season was a weird outlier: running back production was way down while tight end production was up, but that was mostly a one year blip. From 1985 to 1994, running backs averaged 22% of the pie, a noticeable decrease from the pre-1984 era, but tight ends dropped, too, down to 15% during that decade. And from 1986 through 2007, tight ends were under 20% of the receiving pie each year. But tight ends have held steady at 20 or 21 percent, while running back production in the receiving game has dropped to about 16%. In 2004, tight ends gained more receiving yards as a group than running backs, and it has remained that way in every season since. This is strongly tied, of course, to the near-elimination of the fullback position from the modern game. [continue reading…]

References

References
1 It is not lost on me that NFL history is not linear, and in many ways, the 1960s is more similar to the 1980s than the 1970s. That said, out of laziness, I only went back to 1970.
2 Some caveats: Obviously many players straddle the line across multiple positions. There are some judgment calls involved with H-Backs, tight ends turned wide receivers, running backs turned tight ends, etc. I did my best to make the appropriate call in each case. Note also that for this article, I’ve eliminated all players who ended the season with negative receiving yards, and am only looking at receiving yards by running backs (which includes fullbacks), receivers and tight ends.
{ 0 comments }

In 1999 and 2000, no team in NFL history relied on one running back quite like the Indianapolis Colts.  During those two seasons, Edgerrin James was responsible for 98% of all carries given to Colts running backs, 99% of all rushing yards from Indianapolis running backs, and 98% of all yards from scrimmage and 97% of all touchdowns scored by Colts running backs.  The table below shows the stats from the nine running backs to play for the Colts during these two seasons: [continue reading…]

{ 1 comment }

Twenty years ago, in the summer of 2002, Doug Drinen wrote this about Running Back By Committee:

Any way you want to look at it, the use of RBBC has been decreasing for about three decades. In 2000, RBBC was at an all-time (since 1970) low. In 2001, it was back up slightly, but was still lower than it has ever been.

Drinen labeled a running back by committee (RBBC) if the team’s top running back scored less than half of the team’s total fantasy points by running backs. How do things look over the last 20 years? [1]In my effort re-create Drinen’s study, I am defining fantasy points as (receptions / 2) + (rushing yards + receiving yards) / 10 + (rushing TDs + receiving TDs ) * 6. [continue reading…]

References

References
1 In my effort re-create Drinen’s study, I am defining fantasy points as (receptions / 2) + (rushing yards + receiving yards) / 10 + (rushing TDs + receiving TDs ) * 6.
{ 16 comments }

The 2022 NFL Schedule

Every year, I publish a color-coded version of the NFL schedule the night it is released. This year, things were delayed a bit, but it’s ready now. [continue reading…]

{ 0 comments }

Overtime in the Playoffs From 2011 Through 2021

The 2009 NFC Championship Game was a classic game featuring two future Hall of Fame quarterbacks in Brett Favre and Drew Brees. The Vikings battled the Saints in the Superdome to a 28-28 tie after four quarters. New Orleans won the coin toss, giving Brees and the offense the ball first. The Saints appeared to go three-and-out, but an incomplete pass on third down was negated by a defensive holding penalty. The Saints got to the Vikings 41-yard line, and a pass interference penalty gave them another 12 yards. A couple of minutes later, and Garrett Hartley hit a 40-yard field goal to send New Orleans to the Super Bowl.

It was an anticlimactic ending to a great game. After battling for four quarters, the Saints — aided by a pair of penalties — drove 39 yards in 10 plays to set up a chip shot field goal and won the game. The coin toss was too significant a factor in the game, critics felt, especially as kickers were becoming automatic at longer and longer distances.

So beginning in 2011, the NFL changed the rules: the team that wins the coin toss can’t win the game on a field goal. It must score a touchdown, or else the other team would get the ball, too. That would make the flip of the coin a bit less valuable, or so we were told.

Since then, there have been 11 overtime games played during the NFL playoffs. The team that won the coin toss has won 10 of those games. Let’s walk down memory lane: [continue reading…]

{ 2 comments }

Jonathan Taylor had a season for the ages. Here are the top 10 yards per carry seasons by a running back with at least 300 carries:

 
Games Rushing
Rk Player Age Draft Tm Lg Year
G GS Att Yds Y/A TD Y/G
1 Jonathan Taylor 22 2-41 IND NFL 2021 17 17 332 1811 5.45 18 106.5
2 Adrian Peterson 27 1-7 MIN NFL 2012 16 16 348 2097 6.03 12 131.1
3 Chris Johnson 24 1-24 TEN NFL 2009 16 16 358 2006 5.60 14 125.4
4 Frank Gore 23 3-65 SFO NFL 2006 16 16 312 1695 5.43 8 105.9
5 Barry Sanders* 29 1-3 DET NFL 1997 16 16 335 2053 6.13 11 128.3
6 Barry Sanders* 26 1-3 DET NFL 1994 16 16 331 1883 5.69 7 117.7
7 Eric Dickerson* 24 1-2 RAM NFL 1984 16 16 379 2105 5.55 14 131.6
8 Walter Payton* 23 1-4 CHI NFL 1977 14 14 339 1852 5.46 14 132.3
9 O.J. Simpson* 28 1-1 BUF NFL 1975 14 14 329 1817 5.52 16 129.8
10 O.J. Simpson* 26 1-1 BUF NFL 1973 14 14 332 2003 6.03 12 143.1


He joined Jim Brown, Jim Taylor, O.J. Simpson, Walter Payton, and Clinton Portis as the only players to average 100 rushing yards and 1 rushing TD per game while having a YPC average of at least 5.4. But perhaps most remarkably, he won the rushing crown by over 500 yards. If that sounds like a lot to you, it’s because it is. The last time a player run the rushing crown by such a large margin was Simpson back in his record-breaking 2,000 yard 1973 season. [continue reading…]

{ 0 comments }

Pick a QB, any QB: there are no right answers.

The 2018 NFL Draft was supposed to change the landscape of the NFL at the quarterback position. Maybe not right away, of course, but in a few years — say, 2021? — the five quarterbacks selected in the first round of the 2018 NFL Draft would be the stars of the day. Instead, Josh Rosen flamed out immediately, Sam Darnold proved to be underwhelming under three different coaches, and Baker Mayfield’s stock fell dramatically in his fourth year. Even Lamar Jackson, the 2019 AP MVP, has fallen off; after a notable dropoff in play from 2019 to 2020, he fell further in an injury-plagued 2021. At this point, only Josh Allen is an unimpeachable franchise quarterback, but even he has seen a significant decline in passing efficiency this season.

All told, the 2018 first round quarterbacks as a group have been decidedly below average as passers this season, with three of the four starters (excluding Rosen) being in the bottom five of the NFL in interception rate.

This made me curious: which draft classes have been the most productive in 2021? With 17 weeks in the books — a traditional NFL regular season — here’s what I did. [continue reading…]

{ 0 comments }

Cowboys cornerback Trevon Diggs has  recorded 11 interceptions through 15 team games this season. That’s already the most in the NFL by any player since 40 years ago, when another Dallas corner — Everson Walls — also had eleven picks.  Last year, I wrote about Xavien Howard and J.C. Jackson, the two AFC East cornerbacks who were doing something pretty remarkable. Both players had absurdly high interception numbers given the context of the modern game, which involves adjusting for era.

While teams throw more often now than they did throughout the history of the game, the frequency of interceptions per pass attempt has dipped at an even more severe rate than the quantity of pass attempts has risen. That’s why, despite more passing, there are fewer interceptions per game in the modern era than there has been at any other time since World War II. The graph below shows interceptions per team game in the NFL from 1945 through week 16 of the 2021 season: [continue reading…]

{ 1 comment }

The Minnesota Vikings have played a lot of close games this season.  In fact, all but one of their games was decided by 8 or fewer points, and the average margin of victory — regardless of who won the game — has been just 5.15 points.

Results Table
Points
Rk Tm Year Date Time LTime Opp Week G# Day Result OT PF PA PD PC
1 MIN 2021 2021-09-26 4:25 2:25 SEA 3 3 Sun W 30-17 30 17 13 47
2 MIN 2021 2021-12-09 8:20 6:20 PIT 14 13 Thu W 36-28 36 28 8 64
3 MIN 2021 2021-11-14 4:05 1:05 @ LAC 10 9 Sun W 27-20 27 20 7 47
4 MIN 2021 2021-10-17 1:00 1:00 @ CAR 6 6 Sun W 34-28 OT 34 28 6 62
5 MIN 2021 2021-11-21 1:00 11:00 GNB 11 10 Sun W 34-31 34 31 3 65
6 MIN 2021 2021-10-10 1:00 11:00 DET 5 5 Sun W 19-17 19 17 2 36
7 MIN 2021 2021-09-19 4:05 2:05 @ ARI 2 2 Sun L 33-34 33 34 -1 67
8 MIN 2021 2021-12-05 1:00 1:00 @ DET 13 12 Sun L 27-29 27 29 -2 56
9 MIN 2021 2021-09-12 1:00 1:00 @ CIN 1 1 Sun L 24-27 OT 24 27 -3 51
10 MIN 2021 2021-11-07 1:00 1:00 @ BAL 9 8 Sun L 31-34 OT 31 34 -3 65
11 MIN 2021 2021-10-31 8:20 6:20 DAL 8 7 Sun L 16-20 16 20 -4 36
12 MIN 2021 2021-10-03 1:00 11:00 CLE 4 4 Sun L 7-14 7 14 -7 21
13 MIN 2021 2021-11-28 4:25 1:25 @ SFO 12 11 Sun L 26-34 26 34 -8 60

[continue reading…]

{ 0 comments }

The Most Run-Heavy Games In NFL History

On Monday Night Football, the Bills and Patriots squared off in a game defined by the elements. The temperature was 36 degrees at kickoff, with heavy winds and some mix of rain and snow. There was a 15-yard punt by the Patriots going into the wind in the 1st quarter, and a 71-yard punt by New England kicking with the wind in the 4th quarter. New England opted for a 2-point conversion try after the team’s only touchdown of the game. But by far the most meaningful impact came in the Patriots pass/run run ratio: New England wound up passing on just three of 49 plays! That’s a 6.1% pass ratio, highlighted by a stretch of 32 consecutive runs in the middle of the game.  Bill Belichick will be remembered as coming up with a great game plan in poor weather, asking almost nothing out of his rookie quarterback Mac Jones.

Since 1950, that made this just the fifth game where a team ran on at least 93% of its plays. Let’s review the the other four now: [continue reading…]

{ 0 comments }

InIn one of the first posts at Football Perspective, I looked at the leaders in rushing yards over every 10-year period. The question asked in that article was who would ultimately lead the NFL in rushing yards from 2012 to 2021. We can now answer that question.

The answer may surprise you.  I suggested that Trent Richardson was the obvious favorite. Among the names I offered as potential candidates were Mark Ingram, Dion Lewis, Jacquizz Rodgers, LeSean McCoy, Beanie Wells, DeMarco Murray, Doug Martin, David Wilson, Ronnie Hillman, Lamar Miller, Isaiah Pead, Kendall Hunter, and LaMichael James. I said that we could not rule out college stars like Marcus Lattimore or Michael Dyer or Montee Ball or Malcolm Brown or De’Anthony Thomas.

I said Ray Rice and Ryan Mathews, at 25-year-old in 2012, were probably too old to consider.  That logic applied to 26-year-old stars Arian Foster and Marshawn Lynch.  And while they may have been stud running backs, a quartet of 27-year-olds in Maurice Jones-Drew, Matt Forte, Adrian Peterson and Chris Johnson were clearly too old to consider.

I did not include Ezekiel Elliott or Derrick Henry, as both players were still in high school.  As it turns out, barring injury in 2021, they will both finish in the top 5 of rushing yards from 2012 to 2021 despite both entering the league in 2016.  Ingram, who was a 2nd-year player in 2012, will fall to 6th when Henry and Elliott pass him.  The top 3?  In a big surprise, the 27-year-old Peterson — then still recovering from a torn ACL — will wind up third on the list, and just over 300 yards away from the decade-lead. I named the 24-year-old McCoy one of the top candidates, and he will wind up 2nd on the list.   But the leader in rushing yards from 2012 to 2021? [continue reading…]

{ 0 comments }

The greatest kicker ever made the greatest kick ever. His team celebrated.

In the first fifty years of pro football, long kicks were more prayers than plans. The NFL in 1934 was very different than the one we watch today; back then, you could have a player like Glenn Presnell play quarterback, tailback, defense, and kicker… and also choose his team’s colors, as he and his wife did with the Detroit Lions and their Honolulu blue and silver. A few months later, Presnell made a big in-game contribution for Detroit: with the wind at his back and in front of 8,000 fans, he connected from 54 yards away to provide the sole points in a 3-0 win over rival Green Bay.  It was the longest kick in the young history of the NFL.

Kicks over 50 yards were very rare over the ensuing two decades.  A few of the top kickers like Lou Groza and Ben Agajanian would connect from long range time to time, but both players maxed out at 53 yards.  In 1952, the Chicago Cardinals made just two field goals all season.  That year, the Cleveland Browns used a first round pick on Tennessee defensive back and running back Bert Rechichar.  As a rookie, Rechichar started every game and turned six interceptions; playing in Cleveland with Groza, the idea of Rechichar ever attempting a field goal would have been silly.  But in 1953, the NFL expanded and brought football back to Baltimore.  As a result, Rechichar found his way on the expansion Colts.  In the second quarter of the opening game, he returned an interception for a touchdown to provide the first ever points for the new team.  Teammate Buck McPhail, who was the Colts regular kicker in the preseason, hit the extra point to tie the game at seven apiece. [continue reading…]

{ 0 comments }

My preferred way to come up with NFL team ratings and NFL strength of schedule ratings is to trust the experts: in this case, the Vegas oddsmakers. Every year (or at least the years where I remember to do so), after Vegas releases the point spreads for every game, I take those weekly “ratings” to derive the Vegas ratings are for each team. Hence the title of today’s post: we can use the Vegas point spreads in each game to derive the implied ratings by the oddsmakers (in this case, Action Network) for each team.

The way to generate team ratings is to take the point spread in each game, adjust for home field (except for the two international games), and then determine by how many points Vegas thinks Team A is better than Team B. For example, when the Jets are 4.5-point underdogs to the Panthers in Carolina, we can imply that Carolina is viewed as 2 points better than the Jets (I am using 2.5 points for home field advantage). Using the iterative SRS process, and because the transitive property of point spreads applies, we can generate team ratings based on the 272 point spreads involved. [continue reading…]

{ 0 comments }

The 2021 NFL Schedule

Every year, I publish a color-coded version of the NFL schedule the night it is released. Tonight is that night.

Download the Excel file here. [continue reading…]

{ 1 comment }

The Bengals had to choose between Chase and a left tackle.

The debate was intense this spring.  The Cincinnati Bengals desperately needed to help young quarterback Joe Burrow, and there were likely going to be two outstanding offensive prospects available for Cincinnati.  But those players would help the offense in drastically different ways.

One option was to draft Burrow’s former teammate, LSU WR Ja’Marr Chase. The other was to draft Oregon OT Penei Sewell, which would help the offense in a very different way.  Many chimed in on the debate, and the most interesting part of the analysis was the value placed on each position.  Few debated whether Chase or Sewell were elite prospects; both were blue chip players at their position in college, and little of the argument centered on how they compared to others at the same position.  Rather, the question could be boiled down to this: was adding a great WR prospect better or worse than adding a great OT prospect?

On a pass play, the wide receivers are attackers and the offensive linemen are mitigators. Grouping players into attackers and mitigators can be a helpful way to analyze what each position brings to the game.  An elite attacker is always valuable, although his value might be limited if he’s lined up against a great mitigator.  But a mitigator is only as valuable as the person he’s trying to mitigate and the other mitigators on his team. This is easiest to think about when it comes to cornerbacks.  Nnamdi Asomugha was a shutdown, Hall of Fame level cornerback for three years in Oakland at a time when the Raiders pass defense was below average. Asomugha was targeted to an absurdly low degree, and while teams were forced to throw away from him, that didn’t matter much because the other mitigators were below average. [continue reading…]

{ 0 comments }

Cincinnati added not only a familiar weapon, but one with a great name.

One of the most unique parts of the 2021 NFL Draft was the reuniting of college teammates in the passing game. The Cincinnati Bengals drafted LSU quarterback Joe Burrow first overall last season; holding the 5th overall selection this year, Burrow was rumored to be pushing his organization to draft his former teammate, Tigers WR Ja’Marr Chase. The Bengals did in fact pull the trigger on Chase, making them the extremely rare combination of quarterback and receiver to get drafted out of the same college and to the same team in the first round in back to back years.

But it didn’t stop there.  With the very next pick, Miami drafted Alabama WR Jaylen Waddle, a year after drafting Crimson Tide quarterback Tua Tagovailoa with the fifth overall pick.  But it didn’t stop there: Alabama WR DeVonta Smith was selected by the Eagles with the 10th overall pick, and that reunites him with Jalen Hurts, the Eagles starting quarterback and a member of the 2017 and 2018 Crimson Tide teams. [continue reading…]

{ 12 comments }

In Part I, we learned that there is a correlation between 40-yard dash times and wide receiver success in the NFL.

In Part II, we learned that there is a correlation between 40-yard dash times and where a wide receivers gets drafted.

Today: have NFL teams been properly evaluating 40-yard dash times when drafting wide receivers?

My plan *was* going to be as follows.  Let’s break things down into two buckets: wide receivers who were drafted much higher than their 40 time would indicate, and wide receivers who were drafted much lower than their 40 time would indicate. Then, see which category fared better. Should be easy, right?

On one hand, you have players like Larry Fitzgerald and Peter Warrick: wide receivers who were bringing something to the table besides their 40-time. Fitzgerald ran the 40 in 4.48 seconds yet was drafted 3rd overall. Warrick ran it in 4.58 seconds and was the 4th overall pick! Both players were dominant in college but not known for their speed: NFL executives certainly didn’t put too much weight in their 40 times when evaluating those guys. To the extent you think NFL teams always overweight the 40, Fitzgerald and Warrick are too good reminders that that is not the case. [continue reading…]

{ 0 comments }

Update:

The 2021 NFL Draft saw 156.7 points of draft value spent on quarterbacks, the 2nd-most in NFL history behind only 1999.  As expected, Lawrence and Wilson were the first two picks, with Lance going third overall.  The fourth quarterback didn’t go off the board until the 11th pick, which was a bit of a surprise: that was Fields to Chicago, and the fifth quarterback (Jones) went to New England at 15.  Trask, Mond, and Mills were indeed seen as the best of the rest, and went in the span of four picks in the 60s.  The margin was so close that had Fields been selected with the 8th overall pick, and the rest of the quarterbacks were chosen in the same spot, then the 2021 Draft would have exceeded the ’99 Draft in terms of draft capital spent on quarterbacks.

The rest of the original article is below.

The 2021 NFL Draft looks to be extremely quarterback heavy. The Jaguars are going to select Clemson quarterback Trevor Lawrence with the first overall pick, and the expectation is that the Jets will draft BYU passer Zach Wilson with the second selection.  The 49ers will likely draft a quarterback with the third pick, too, and the rumors are that it could be Alabama QB Mac Jones, or Ohio State’s Justin Fields, or even North Dakota State’s Trey Lance; regardless, all five quarterbacks are expected to go in the first round, and perhaps even all in the top ten!  Three other quarterbacks — Stanford’s Davis Mills, Florida’s Kyle Trask, and Texas A&M’s Kellen Mond could have early picks used on them, too.

The most QB-heavy draft in NFL history was not the famous 1983 Draft — which featured three HOF passers and six quarterbacks selected in the first round — but rather the 1999 Draft.  That year, quarterbacks were taken with the first three picks, and two more were drafted in the top fifteen; second, third, and two fourth round picks were also used on quarterbacks.

I looked at every NFL Draft since 1950 and calculated how much draft capital was spent on quarterbacks each year.  The picture below shows those results, using the Football Perspective Draft Value Chart.
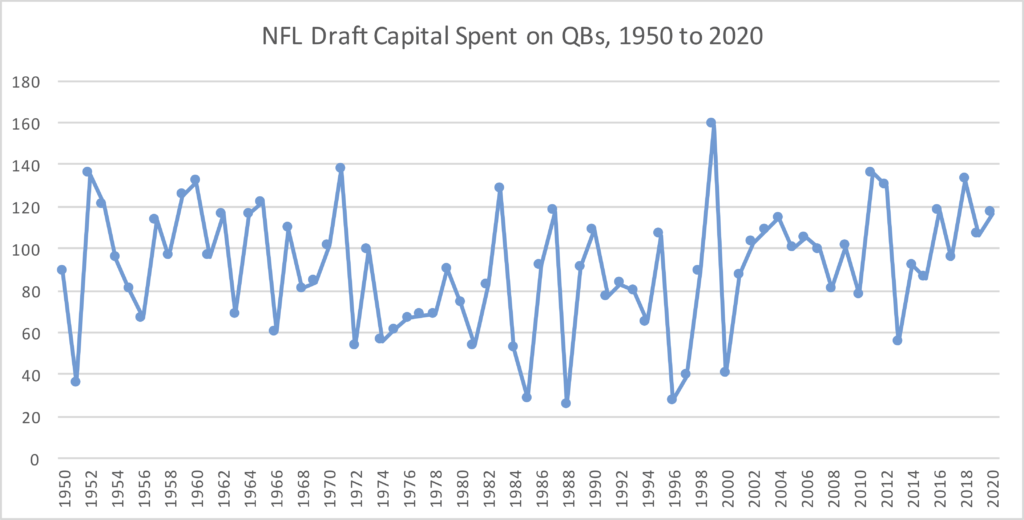
Let’s say that in the 2021 Draft, Lawrence/Wilson/Fields go with the first three picks, Lance and Jones get selected at 7 and 9, and as The Athletic’s Mock Draft by Dane Brugler provides, Mills goes to the Patriots in the middle of the second round, Mond is taken by the Bears a few picks later, and Trask is a fourth round pick by the Vikings.  If no other quarterbacks are selected in the top 224, that would mean that the draft capital spent on quarterbacks in 2021 was equal to 159 points using the Football Perspective Draft Value Chart.  That would, by a hair, make this the most quarterback-heavy draft in NFL history, as the ’99 Draft had 158.6 points of draft capital spent on quarterbacks. And if quarterbacks go 1-2-3-4 to start the Draft, that would up the allocation to 162.6 points. It seems very likely that 2021 will be either the #1 or #2 quarterback draft in NFL history, at least according to draft capital spent on the position.

{ 0 comments }

Once Again, A Team Overpays For The #3 Pick

It was just three years ago that the New York Jets decided they absolutely needed to trade into the top 3 of the 2018 NFL Draft. The decision was bad at the time and looks worse in hindsight: not only did New York whiff by drafting Sam Darnold, one of the biggest draft busts in recent history, but the Jets could have taken either Josh Allen or Lamar Jackson with the team’s original pick.

The package that New York sent to Indianapolis for the 3rd pick was massive: New York sent the 6th overall pick (Quenton Nelson), along with the 37th (Braden Smith) and 49th (Dallas Goedert) picks, plus a 2019 2nd round pick (34th overall, Rock Ya-Sin) for the rights to acquire whoever would be there at three. The Jets got “lucky” in that Darnold, for much of the pre-draft process considered the presumptive first overall pick, was even available to them at three. As I wrote at the time, the Jets chose the rights to the third quarterback [1]Which, after the Giants drafted Saquon Barkley, turned into the second available quarterback. available in the draft over getting Lamar Jackson plus four second round picks. It has worked out to such a poor degree that the Jets are one month away from using the #2 overall pick that the Darnold-led Jets very much earned on Darnold’s successor.

Well, the 49ers decided what was bad for the Jets would be good for them. Because San Francisco decided to acquire Miami’s 3rd overall pick in the 2021 NFL Draft — ostensibly the right to select the third quarterback in the draft after the Jaguars and Jets have their picks — for a similarly enormous haul. San Francisco sent the 12th overall selection, along with its 1st and 3rd round picks in 2022, and its first round pick in 2023 in exchange for that third overall selection.

Can we calculate just how much the 49ers overpaid for the rights to the third pick? Under my draft value chart, the 3rd pick is worth 27.6 points while the 12th pick is worth 18.8 points; of course, those are just average values, and the 49ers feel like the dropoff in quality between a quarterback available at 3 and a quarterback available at 12 is enormous.

Let’s assume that the 49ers two first round picks will be average; pick 16 is valued at 16.9 points. If we assume a 10% discount rate on future picks for each season, that puts those two picks at 15.2 and 13.5 points, respectively. The 49ers are also sending a 2022 3rd round pick which is a comp pick (in this case, compensation for the Jets hiring Robert Saleh as head coach); that pick should be right around pick 100, worth 5.3 points. Apply a 10% discount, and we get 4.8 points.

So the 49ers gave up draft picks worth 18.8, 15.2, 13.5, and 4.8 points, for a total of 52.3 points. That is, obviously, a significant package, equivalent to the first overall pick in the draft plus another top-15 pick. To move up from 12 to 3, the 49ers gave up more than the Jets did when they moved up from 6 to 3; the Jets overall sent more total value to draft Darnold than San Francisco did to draft QB3 this year, but overall, the teams are pretty similar: [continue reading…]

References

References
1 Which, after the Giants drafted Saquon Barkley, turned into the second available quarterback.
{ 0 comments }

In Part I, we learned that there is a correlation between 40-yard dash times and wide receiver success in the NFL. Today, I want to look at a third variable: NFL Draft status.

My sample once again comprises the 853 wide receivers who ran the 40-yard dash at the NFL combine from 2000 to 2017. All data is publicly available from PFR, via Stathead Football. If you think there was a strong correlation between 40-yard dash time and NFL production, wait until you see the correlation between 40-yard dash time and draft status.

In the table below, the average draft value represents the FP draft value associated with each pick. A higher number means more draft value — i.e., an earlier pick — was used to select those players. [continue reading…]

{ 0 comments }
Previous Posts