
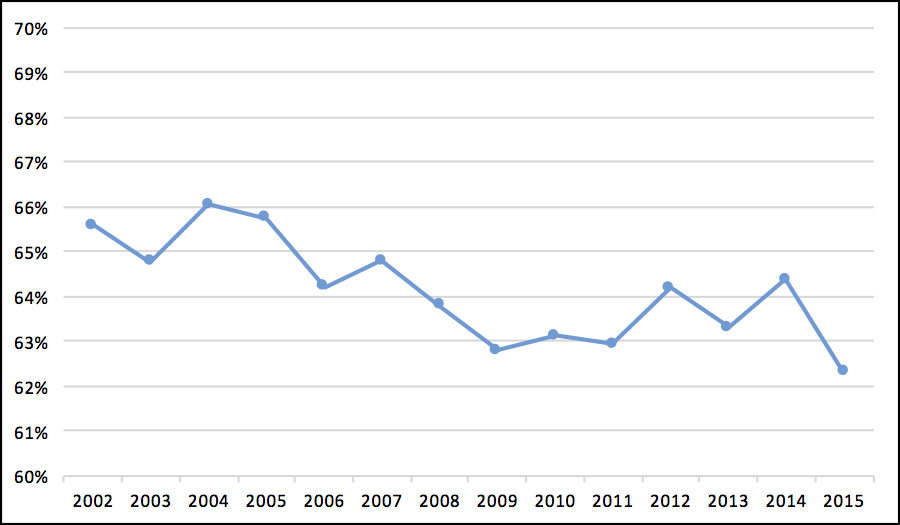
Some quick but interesting data dumps today. First, let’s take a look at receiving yards by wide receivers as a percentage of league-wide receiving yards in each year since 2002. In the early part of that era, wide receivers had about 2/3 of all receiving yards, but that number dipped to just 62% this year, the lowest during this period.
In 2015, there were just 15 games where a player rushed for at least 150 yards in a single game. That’s the smallest number since 1996, when just 14 players hit that mark. Thomas Rawls (!) was the only player with multiple games of 160+ rushing yards, and Adrian Peterson was the only other player with two 150+ yard rushing games.
Games with at least 150 rushing yards were much more common in the early ’00s, but they have not exactly been frequent throughout history. The graph below shows the number of times players rushed for 150+ yards in a game in each season since 1960. Note that in seasons with fewer than 32 teams/16 games, the number of instances were prorated as if it was a 512-game league season.

The same trend holds up if we look at 125+ rushing yard games, with 2015 representing a modern low. Again, throughout this post, I have pro-rated non-512 game seasons. [continue reading…]
Adam Steele is back, this time with some playoff support stats for eight more quarterbacks. You can view all of Adam’s posts here.
Two weeks ago, I published a study detailing the playoff supporting casts of Tom Brady and Peyton Manning. Today I’m going to look at eight more notable quarterbacks under the same microscope. Below are the career tables for each QB, in no particular order. [continue reading…]
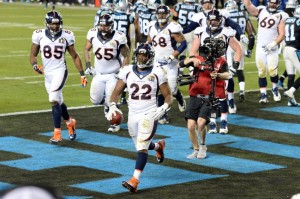
Anderson clinches the title for Denver
The player with the most yards from scrimmage in a single postseason is John Riggins, who rushed for an incredible 610 yards and picked up 625 yards from scrimmage for Washington after the 1982 season. But on a per-game basis, Marcus Allen a year later was even better: in three games, Allen rushed for 466 yards and four touchdowns, while also gaining 118 yards through the air. That gave him an incredible 584 yards from scrimmage and 5 touchdowns in three games, and one of the most famous highlights in NFL history.
Allen also holds the record for most yards from scrimmage during the postseason among the 50 Super Bowl champions. Anderson ranks a respectable 15th in this category: [continue reading…]
A quick checkdown today, looking at the net points allowed in the playoffs by each of the 50 teams that won the Super Bowl. What do I mean by net points? It’s pretty simple:
(Touchdowns allowed to opposing offenses) * 7 + (Field Goals allowed) * 3 – (Touchdowns scored by the defense) * 7 – (Safeties scored by the defense) * 2
I have decided to ignore special teams touchdowns — both for and against that team — as this is just a look at defenses. And obviously this is a very basic look: it doesn’t incorporate number of drives faced, average starting field position, missed field goal attempts, or quality of opposing offense (or era). But hey, I said it was a quick checkdown!
Here’s how to read the table below. Let’s use the 1985 Bears as an example. You may know that Chicago shut out both NFC opponents en route to the Super Bowl, where the Bears allowed 10 points. But that’s a bit misleading, because Chicago’s defense was better than that. The 1985 Bears played in three playoff games, and the defense scored two touchdowns and recorded a safety (total of 16 points). The defense did allow 10 points, via a touchdown and a field goal, but that means the Bears defense allowed -6 net points in the playoffs, or -2 NP/G. [continue reading…]
Today’s guest post comes from Adam Harstad, a co-writer of mine at Footballguys.com. You can follow Adam on twitter at @AdamHarstad.
On Saturday, the Hall of Fame selection committee will meet, lock themselves in a room, and debate the relative merits of the 15 modern-era finalists for induction. After an intense discussion, the results will be announced nationally as the final event in the festivities leading up to Sunday’s Super Bowl.
While the list of 15 finalists includes several names who have been waiting longer than they should for their call, the one that stands out the most to me is Terrell Davis, who has been a semi-finalist more than anyone else in this year’s class, reaching the top 25 ten times in his ten years of eligibility.
Hopefully the Hall of Fame committee can manage to make room for him in what could easily be a stacked class. Whatever they do this Saturday, however, will not change one simple fact: Terrell Davis should have long ago been elected to the Hall of Fame. [continue reading…]

This pass probably wasn’t completed.
That’s bad, but nowhere near as bad as the worst performance from even this year’s playoffs (Brian Hoyer) or the last Cardinals playoff loss (thank you, Ryan Lindley). But the reason Palmer’s performance appeared so bad was precisely because it came from someone like Carson Palmer, and not a Hoyer or a Lindley. Palmer, after all, was arguably the best passer in the NFL this season. He led the NFL in Adjusted Net Yards per Attempt, at 8.11, which was 2.14 ANY/A better than league average. [continue reading…]
Antonio Brown has 1,586 receiving yards, most in the NFL, which puts him on pace for 1,813 receiving yards this season.
Adrian Peterson has 1,314 rushing yards, most in the NFL, which puts him on pace for 1,502 rushing yards in 2015.
That’s pretty weird. In general, the rushing leader usually gains more rushing yards than the receiving yardage leader picks up through the air. From 1970 to 2014, the receiving yards leader “outgained” the rushing yards leader in only 10 of 45 seasons. And in only three of those years did the receiving leader “win” by more than 100 yards: in 1999 (Marvin Harrison had 1663 receiving yards; his teammate Edgerrin James had 1553 rushing yards), 1990 (Jerry Rice over Barry Sanders, 1502 to 1304), and 1982 (Wes Chandler over Freeman McNeil in the strike-shortened season, 1032to 786). On a per-game basis, it’s tough to beat what Chandler did, but Brown is on pace to become the first receiving leader since the merger (in fact, the first in the NFL since 1952) to “outgain” the rushing leader by over 300 yards. [continue reading…]
I’ve published the Game Scripts data from every game this year at the 2015 Game Scripts page, available here. What would it look like if we plotted Game Script score (on the X-Axis) against Pass Ratio (on the Y-Axis) for every game this year? Something like this:

(Note that this looks pretty similar to how it was through seven weeks last year, although the constant (i.e., league-average pass ratio) has increased by nearly a full percentage point.)
[continue reading…]

GronkSmash
Rob Gronkowski is in a scoring slump. It’s one of the worst scoring slumps of his career. But more on that in a bit.
Jerry Rice once [1]Well, he actually did it three times, although the same 55 games were in all three stretches. caught 67 touchdowns over a 57-game period. This stretch was during all of 1987, 1988, and 1989 (including playoffs) and the start of the 1990 season. That pro-rates to an insane 19-touchdown per-season average for three-and-a-half seasons. Then again, the weirder thing is when Rice doesn’t top a receiving category.
Lance Alworth once caught 55 touchdowns [2]Three times, like Rice, with 55 of the same games. over one 57-game stretch from 1963 to 1967.
Only three other players since 1960 have ever had more than 50 touchdowns in any 57-game stretch (including playoffs): Randy Moss, Terrell Owens, and Art Powell, each of whom topped out at 53 touchdowns in 57 games. Cris Carter, Sonny Randle, Sterling Sharpe were at 49, Larry Fitzgerald was at 58, and Gary Collins, Anthony Freeman, Marvin Harrison, and Andre Rison were at 47. Calvin Johnson topped out at 46 at one point in 2013. Dez Bryant hit 46 in his last 57 after the Lions playoff game, but then went three straight games without a touchdown catch. [continue reading…]
The Jets are 4-3, and it would not be an exaggeration to say that the team’s success is heavily tied to New York’s ability to control games on the ground. The Jets running backs have rushed for over 150 yards in three games this year, wins over Washington (190), Miami (173), and Cleveland (155). The Jets have also had three games with 60 or fewer rushing yards, losses against New England (60), Philadelphia (34), and Oakland (28). The seventh game, a win over the Colts, saw the Jets running backs operate at a reasonably effective pace of 26 carries for 95 yards.
In other words, when the Jets run well, they win, and when they don’t, they lose. That sounds simplistic, and it is: it’s a bit of an over exaggeration, although one grounded in some truth. In general, teams run more when they win — or, more precisely, when they have favorable Game Scripts — and run less often when they have negative Game Scripts. And the Jets games have had pretty strong Game Scripts in the four wins, scoring a +6.1 against Washington, +6.5 against Cleveland, +7.3 against the Colts, and +11.9 against Miami. Those are the sorts of games where it’s easy to produce good numbers, and Jets running backs [1]This is meant to exclude Ryan Fitzpatrick and other non-running backs. have averaged 153.25 rushing yards in these four wins.
The losses to Philadelphia (-10.6) and Oakland (I haven’t calculated it yet, but it will certainly be in the double digits) were ugly; the Patriots game (-0.6) was the only game that unfolded with a neutral Game Script. Still, in three losses, the Jets running backs have rushed 54 times for just 122 yards. So the causation arrow isn’t pointing only one way here: the Jets are winning when they run more effectively, and losing when they aren’t, on top of whatever bonus the raw totals get out of Game Scripts. [continue reading…]
References
| ↑1 | This is meant to exclude Ryan Fitzpatrick and other non-running backs. |
|---|
Jamaal Charles, Matt Forte, Chris Johnson, Justin Forsett, Jonathan Stewart, Danny Woodhead, Mike Tolbert, Darren McFadden, Marcel Reece, and Jerome Felton all entered the NFL in 2008. So did Steve Slaton, the rookie rushing leader that year, and Ray Rice, Rashard Mendenhall, Michael Bush, Peyton Hillis, and Felix Jones. Analyzing where the ’08 class ranks in NFL history is a project for the offseason, but today, I thought it would be fun to look at rushing yards by running backs by class year.
The graph below shows that data through six weeks of the 2015 season. As you can see, players in their 8th NFL season — those who entered the league in 2008 — are doing quite well.

The class with the most rushing yards so far in 2015 are the rookies. That class is currently led by Thomas Rawls, but has also received strong production from higher picks like Todd Gurley, Melvin Gordon, and T.J. Yeldon. After the class of ’15, there’s a gradual decline with respect to production by older classes. And then, there’s the class of 2008. [continue reading…]
This week at the Washington Post, a look at some of good and bad fourth down decisions in both week 5 and this season.
The Atlanta Falcons are 5-0, and are quickly becoming one of the major stories of the 2015 NFL season. With a win tonight in New Orleans, the Falcons will match the team’s entire win total from the 2015 season. But without some aggressive coaching from Dan Quinn last weekend, the Falcons likely wouldn’t be among the league’s five remaining unbeaten teams.
With just under five minutes left in the third quarter, the Falcons faced a 4th-and-6 from the Washington 40-yard line, trailing by four points. Given that Atlanta had thrown incomplete passes on the previous two plays, most coaches would have punted or tried a long field goal. Instead, Quinn played to his team’s strengths, and Matt Ryan connected with Julio Jones for a nine-yard gain. Atlanta wound up scoring a field goal on that drive, which put the team in a position to tie the game late in the fourth quarter, and eventually win in overtime.
You can read the full article here.
I’m short on time this week, so I will present the data and leave the commentary to you guys. Here are the Game Scripts data from week 4.
Well, okay, allow me one comment. Under Joe Philbin, the Miami Dolphins have been incredibly pass-happy, despite the fact that the team has often been more effective on the ground than through the air. Well, in Philbin’s last game as head coach, Miami passed on 81% of dropbacks, the highest rate of any team in week four. And, of course, while some of that was due to the team’s poor Game Script, note that Tampa Bay had nearly the same Game Script and passed on only 61% of all plays.
Miami rushed 11 times for 59 yards, so it was not as though the Dolphins rushing attack mandated a pass-happy approach. And Ryan Tannehill averaged 2.49 ANY/A on 47 dropbacks. You can probably figure out why Philbin was fired. [continue reading…]
In week 3, Arizona picked off two Colin Kaepernick passes and returned them for touchdowns… in the first six minutes of the game. The Cardinals led 28-0 before we were halfway through the second quarter! On average, Arizona led by 24.3 points during every second of game play, the most dominant Game Script so far in 2015 (it would rank 5th last year).
But while the Cardinals provided the biggest blowout of week three, it was hardly the only one. A full half of all 16 games had a double digit Game Script, and only the Jets managed to finish within one score of their opponent. Three other games finished with double-digit margins; there simply weren’t that many nail biters last weekend.
The Falcons, though, did pull off an impressive upset: Atlanta trailed 14-0 midway through the first quarter against the Cowboys, and then 21-7 midway through the second. Atlanta even went into halftime down 11, but scored three second half touchdowns while shutting out the Cowboys to pull away with the victory. In the process, the Falcons became just the 11th team since 1990 to trail by at least 11 at halftime and still win by at least 11 points.
Below are the week 3 game scripts: [continue reading…]
It’s safe to say that no team has exceeded expectations through two weeks quite like the Jets. In week 1, New York was a 3.5-point home favorite against the Browns, but won by 21 points (a 17.5-point cover). In week 2, the Jets won 20-7 in Indianapolis, despite being 7-point underdogs (a 20-point cover). The Jets are the only team to cover by 17+ points in each of the first two weeks; in fact, Arizona (+10 against New Orleans, +23 against Chicago) is the only other team to even cover by at least five points in both games so far.
The last team to pull off this feat? The 2007 Patriots. Yes, another day, another Tom Brady/Ryan Fitzpatrick comparison. From 1978 to 2014, there were 19 teams that covered by at least 17 points in each of their first two games. How did those teams do the prior year, and during the rest of that season?
I’ve included the relevant data for each team in the table below. Here’s how to read the line of the ’06 Chargers. San Diego covered by 24 points in week 1, and 21 points in week 2. The Chargers won 9 games in 2005, but the hot start in ’06 was a sign of things to come, as San Diego won 14 games. That was an improvement of 5 wins, although the Chargers season ended in the Division round of the playoffs. [continue reading…]
On Sunday, New England defeated Buffalo by the misleading score of 40-32. The Patriots may have won by only one score, but New England held an 11-point lead at halftime and a 24-point lead after three quarters. The Patriots were in control of the game for most of the contest, and held an average lead of 9.8 points during each second of game play (the “Game Script”).
Teams with large leads don’t pass very often; in general, you’d expect a team with a Game Script of +10.0 to pass around 50% of the time. But New England threw on 80% of all snaps! That even includes three Tom Brady kneels, and one run each by wide receivers Julian Edelman and Danny Amendola. Excluding those plays, New England passed on 61 of 71 plays, an astonishing 86% pass rate. Much of that number owes to a stout Buffalo run defense, but that’s a remarkable pass-happy performance regardless of Game Script or opponent; given that it came in a game where New England dominated, it was even more noteworthy. By comparison, Minnesota had a Game Script of +10.4 against Detroit, and passed on just 31.7% of plays. In fact, none of the other 31 teams passed as often as New England in week two. [continue reading…]
Yesterday, we looked at what Tennessee’s offensive explosion in week 1 might mean for the rest of the year. Today, let’s do the same but for the 49ers defense. The 49ers were 2.5-point underdogs against Minnesota in week one, and the Over/Under in the game was 41.5 points. This translates to a projected a final score of 22-19.5 in favor of Minnesota. As it turns out, San Francisco won the game, 20-3, which means the Vikings were held 19 points below their expected total. That’s the 4th best performance by a team by this methodology since 2002.
The most impressive game? That came in 2003, in the Lawyer Milloy game. The Bills shut out New England, 31-0, while the pre-game spread projected New England to score 21.75 points. That wasn’t a sign that Buffalo was about to break through (the team finished 6-10), but it did provide some insight into a Bills defense that jumped from 27th (in 2002) to 5th (in 2003) in points allowed. [continue reading…]
The Titans were 3-point underdogs against Tampa Bay in week one, and the Over/Under in the game was 41 points. This translates to a projected a final score of 22-19 in favor of Tampa Bay. Of course, Tennessee scored 42 points, outscoring its projection by a whopping 23 points, tied for the fourth biggest number in all week 1 games since 2002. In the graph below, I’ve plotted each team’s expected points scored in week 1 on the X-axis, and their actual week 1 score on the Y-axis. [continue reading…]
Six years ago, I took my first crack at analyzing field goal kickers. I have been meaning to update that article for each of the last three offseasons, and with the sun setting on the 2015 offseason, I didn’t want to let this slip yet again.
Ranking field goal kickers is not difficult conceptually, but it can be a bit challenging in practice. One thing I’ve yet to refine is the appropriate adjustments for playing surface, stadium, time of game, temperature, and wind. That’s a lot of adjustments to deal with, all on top of the most obvious adjustment: for era.
But as I understand it, Rome was not built in a day; further, I believe that a journey of a thousand miles begins with one step. As a result, I’m okay with only getting part of the way there for now, and punting (which is very, very different from kicking) the rest of this process to next offseason.
Let’s begin with the obvious: era adjustments are really, really, important. To provide some examples, I looked at the field goal rates at four different increments: 22-24 yard kicks, 31-33 yard attempts, kicks from 40-42 yards away, and finally, field goal attempts from 49-51 yards. In the graph below, I’ve plotted the success rate at those four distances for each year since 1960, along with a “best-fit” curve at each distance. Take a look: [continue reading…]
It’s been nearly a decade since Bill Cowher stopped coaching, but that hasn’t done much to keep his name out of the rumor mill every December and January. After all, Cowher was both very successful and very young when he retired, and NFL folks believe those dots can be connected to mean he won’t stay retired forever.
That made me wonder: how much of an outlier is Cowher with respect to his age and how successful he was? In particular, Cowher was successful at the end of his stint, which differentiates him from someone like Jon Gruden. Defining “success” is challenging when it comes to coaches, but I want to just generate a set of comparable modern coaches and see how they fared at the ends of their careers and when they retired. I don’t need a particularly precise coaching formula, just something that gets the job done.
As it turns out, six years ago, I created a rudimentary formula to rank head coaching records. Let’s use Cowher’s last three years as an example. This formula gives credit for wins above losses, so Cowher gets a 0 for his work in 2006, his final year, when Pittsburgh went 8-8. The prior year, the Steelers went 11-5, so that’s +6, but I also gave a 12-point bonus for winning the Super Bowl, so he gets a +18 for that season. And in ’04, Pittsburgh went 15-1, so that’s +14. Add it up, and Cowher has a +32 score over his last 3 years. And he was just 49 years old during his final season. [continue reading…]
There are many advanced projection systems that do a great job of projecting teams wins. I’m not interested in recreating that or coming up with my own system, but rather setting a baseline for what a projection system should hope to accomplish. You’ll see what I mean in a few moments.
Test #1: Every Team Is The Same
This is the simplest baseline: let’s project each team to go 8-8. If you did that in every season from 1989 to 2014, your model would have been off by, on average, 2.48 wins per team. This is calculated by taking the absolute value of the difference between 0.500 and each team’s actual winning percentage, and multiplying that result by 16. So that should be the absolute floor for any projection model: you have to come closer than that.
Test #2: Every Team Does What They Did Last Year
Looking at all teams from 1990 to 2014, I calculated their winning percentages in that season (Year N) and in the prior season (Year N-1). If you used the previous year’s record to project this year’s record, you would have been off by, on average, 2.84 wins per team. That’s right: you are better off predicting every team to go 8-8 than to predict every team to repeat what they did last season. [continue reading…]
Yesterday, we looked at offensive Pass Identity grades. Today, we are going to use the same process to analyze the data for defenses. Yesterday’s post is required reading to understand how Pass Identity grades are calculated, but here’s one update. While we can use the same numbers for Game Script (including the 3.27 number for standard deviation and 0 for average), that’s not the case for defensive Pass Ratio. There, while the average is roughly the same at 58.29%, the standard deviation is much smaller at 2.84% (it was 4.66% for the offenses).
Let’s use the Lions as an example. Detroit had an average Game Script of +0.4 last year, meaning the Lions were leading by, on average, 0.4 points during every second of every game. That was 0.11 standard deviations above average. [continue reading…]
As we did last year, today I’m going to calculate the final 2014 Game Scripts and Pass Identity data. Every week during the season, I write about the Game Scripts from the previous weekend. For new readers, the term Game Script is just shorthand for the average points differential for a team over every second of each game. You can check out the updated Game Scripts page, which shows the results of all 256 games from 2014, and you can read the history behind the metric here.
Let’s begin by looking at the 2014 Game Scripts numbers. The Packers held an average lead of 6.9 points during their regular season games, the highest average in all of football. Because Green Bay was so good, Aaron Rodgers and the Packers weren’t very pass-happy; in fact, the Packers ranked just 21st in pass attempts. That’s why Jordy Nelson and Randall Cobb, as good as their raw numbers were, look even better in some advanced metrics. In some ways, the Packers were the victims of their own success last year, as Green Bay was — by far — the best first half team in the NFL in 2014. That led to the high Game Script number, and a lot of casual dress second halves. [continue reading…]
Yesterday, I looked at a new way to measure punting statistics. Let’s review by using the top single performance from 2014, which surprisingly came from Jets second-year punter Ryan Quigley in a 31-0 loss to San Diego. Yes, the Jets were terrible, but that doesn’t mean it was Quigley’s fault! He had 8 punts, and all but 1 was an above-average punt. Let’s review:
- Punt 1: Quigley punts from the Jets 39-yard line. On average, when a team punts at the 39, the opposing team takes over at the “78.9” yard line, which means just a hair in front of that team’s 21-yard line. Instead, Quigley pinned San Diego back to their 11; that 51-yard punt therefore provided 11.1 more yards of field position than we would expect.
- Punt 2 was a 44-yard punt from the Jets 29. On average, punts from the 29 pin the other team back at their 29.7 yard line. The 44-yarder had no return, giving San Diego the ball at their 27, so Quigley added 2.3 yards of field position over average.
- Punt 3 was from the Jets 20, so San Diego would have been expected to take over at their 38.4-yard line. Instead, following a whopping 64 yard punt, a 2-yard return, and 9-yard lost by San Diego due to an illegal block, and the Chargers were back at their own 9-yard line. That goes down as +20.4 for Quigley. Is it fair to give the punter credit when the return team loses yards on a penalty? I don’t know, although I’m not sure if that’s more or less fair than return yards that team gains (or yards the punting team loses due to a penalty). Think of these more as punt unit ratings than punter ratings, I guess.
- Okay, even I don’t have the energy to go through all 8 punts. But on the other 5, Quigley gained 16.8 yards over expectation, 11.9, 10.4, 10.2, and on one bad punt, -6.0.
Yes, you read that title right. Not only is today about punters, guess what? Tomorrow will be, too. Today, I want to dive into punting statistics. The two key numbers the media focuses on with punters are usually net punting average and gross punting average. But both numbers are pretty heavily influenced by field position. [continue reading…]
As I did last year, I want to analyze the rushing stats for each team in 2014 using a metric known as Adjusted Rushing Yards per Carry. Thanks to the help of Brian Burke of Advanced Football Analytics (formerly Advanced NFL Stats), we were able to conclude that the value of a first down was about 9 yards. And since we’ve previously determined that the marginal value of a touchdown is 20 yards, this means Adjusted Rushing Yards per Carry is pretty easy to calculate. Also, since Bryan Frye crunched the numbers, we might as well exclude all kneels from the process, too.
One thing to keep in mind (which I have forgotten in the past): since the NFL records-keeping process labels touchdowns as first downs, you should only assign 11 yards per touchdown if you are already giving 9 yards to all 1st downs. And since kneels are marked down as runs, you must back those out, too. As a result, here’s the formula to use:
Adjusted Rushing Yards per Carry = (Rush Yards + 11 * Rush TDs + 9 * Rush First Downs – Kneel Yards Lost [1]Since this is a negative number — i.e., 10 kneels for -11 yards — we need to subtract kneel yards to turn those yards into an add back in the numerator. ) / (Rushes – Kneels)
If we use this metric to analyze the 2014 season, how would it look? Seattle was by far the top rushing team in the NFL last year, rushing for 2,762 yards and 20 touchdowns on 525 carries, good for a 5.26 yards per carry average. But 19 of those 525 carries were kneels, and they went for -20 yards. In addition, Seattle not only led the league with 144 rushing first downs, the Seahawks gained a first down on 28.5% of non-kneel carries, also the highest mark in the NFL. Seattle averaged 8.49 Adjusted Rushing Yards per Carry, while the NFL average was 6.63. Since the Seahawks averaged 1.86 ARY/C over average for 506 non-kneel carries, that means Seattle rushed for 941 rushing yards (1.86 * 506) above average.
The full list for all 2014 teams, below: [continue reading…]
References
| ↑1 | Since this is a negative number — i.e., 10 kneels for -11 yards — we need to subtract kneel yards to turn those yards into an add back in the numerator. |
|---|
Back in December 2009, Jason Lisk wrote about a recent trend in the NFL: quarterbacks throwing for 300 passing yards and actually winning. Jason wondered whether that was something fluky, or a sign of the shifting nature of the NFL. With the benefit of hindsight, I think the answer is…. well, I think it’s pretty clear.
Including playoffs, quarterbacks who threw for 300+ yards in a game during the 2009 season won an incredible 63.3% of games. And that mark remains the highest in modern history. Over the last five years (2010 to 2014), quarterbacks have won 52% of games when cracking that mark; during the decade of the ’90s, quarterbacks won 53% of their games when throwing for 300+ yards.
Of course, the likelihood of a quarterback throwing for 300+ yards has increased significantly. Over the last four years, quarterbacks have thrown for 300+ yards in 25% of all games, an enormous increase relative to most of NFL history. The graph below shows both pieces of information: in blue, and measured against the left Y-Axis, shows winning percentage by year when a quarterback throws for 300+ yards; in red, and against the right Y-Axis, is the percentage of all games where a quarterback hit the 300+ yard mark: [continue reading…]
Today’s guest post/contest comes from Thomas McDermott, a licensed land surveyor in the State of California, a music theory instructor at Loyola Marymount University, and an NFL history enthusiast. As always, we thank him for his hard work.
In a previous post, I provided SRS-style ratings for all offenses since 1970, using only points scored by the actual offense (including field goals). Today, I’ll do the same thing for defenses – meaning, of course, our “metric” will be points allowed only by the actual defense. [1]To quickly recap: SRS ratings for offense (OSRS) and defense (DSRS) on PFR’s website include points scored by the defense and special teams. To get a more accurate points-based evaluation of … Continue reading
Here’s how to read the table below: in 1970, the Vikings allowed 10.2 points per game, 8.2 of which came from touchdowns and field goals allowed by the defense. This leaves 2.0 PPG scored by their opponent’s defense or special teams (i.e., due to Minnesota’s offense or special teams). [2]In this case, it was the result of three touchdowns off of offensive turnovers and one on special teams, as highlighted by Chase in this post on estimated points allowed per drive. Their 8.2 Def PA/G was 9.5 points better than league average; after adjusting for strength of opponent, their rating remains at 9.5. Their overall points allowed SRS rating (DSRS) is 9.2, meaning PFR’s defensive SRS rating undersells them by 0.3 points. [continue reading…]
References
| ↑1 | To quickly recap: SRS ratings for offense (OSRS) and defense (DSRS) on PFR’s website include points scored by the defense and special teams. To get a more accurate points-based evaluation of offenses and defenses, I weeded these scores out and reran the iterations. I didn’t note this last time, but for those interested: the numbers used do not include any home field advantage adjustment or a cap on blowout point differentials. |
|---|---|
| ↑2 | In this case, it was the result of three touchdowns off of offensive turnovers and one on special teams, as highlighted by Chase in this post on estimated points allowed per drive. |
Today’s guest post/contest comes from Thomas McDermott, a licensed land surveyor in the State of California, a music theory instructor at Loyola Marymount University, and an NFL history enthusiast. As always, we thank him for his hard work.
When looking at teams’ offensive SRS ratings (OSRS) on PFR, we know that those number also include points scored by the defense and special teams – punt and kick return touchdowns, interception and fumble return touchdowns, return scores on blocked punts and field goals, and safeties. This makes OSRS not as accurate a point-based rating of the offense “proper” as it could be. But, considering those “non-offense” types of scores make up a small fraction of a team’s overall points scored in a season (the average is around 8% since 1970), we can generally ignore this “hiccup” in the system.
Well, most of us can ignore it; for some reason, I cannot! My curiosity has gotten the better of me, so I decided to run offensive and defensive SRS ratings for each team since the merger, using only points that we would normally credit the offense for scoring (or the defense for allowing) – passing and rushing touchdowns, and field goals. [1]I have to assume that at some point Chase or one of the guys at PFR has run the numbers for “SRS without special teams/defense scores”, but I have yet to find it.
As the title states, this is a data dump; I’m hoping that readers of this site will find the info useful for their own research or general interest. Today, we’ll just look at the offense, I’ll post the numbers for defense in a follow-up post. [continue reading…]
References
| ↑1 | I have to assume that at some point Chase or one of the guys at PFR has run the numbers for “SRS without special teams/defense scores”, but I have yet to find it. |
|---|