≡ Menu

Brown continues to dominate the NFL.

Antonio Brown averaged “only” 12.1 yards per reception last year, although his great reception, receiving yards, and receiving touchdown totals earned him a third straight first-team All-Pro selection. If Brown wasn’t so good and just 28 years old, you might look at that average and think Brown was on the decline or at least was becoming less of a big play threat.

But that’s not really true: with 22 receptions (in 15 games) of at least 20+ yards, Brown had the third most big plays of any receiver last year, and 21% of his catches went for at least 20 yards. What really hurt Brown’s average was that he also caught a ton of short passes: he had 57 receptions of 10 or fewer yards. Kelvin Benjamin caught 63 passes for 941 yards last year, a 14.9 yards per reception average. But while that sounds good, Benjamin only caught 10 passes — or 16% of his total — for 20+ yards. How did Benjamin average nearly three more yards per catch than Brown? You probably already figured this one out: just 20 of his receptions (32%) went for 10 or fewer yards. Either Benjamin wasn’t running short routes or he wasn’t catching passes on those routes. If it’s the latter, it’s a bad thing; if it’s the former, well, it’s also a bad thing (relative to Brown, at least) that all he was doing was running long routes and Brown still caught more long balls than him!

The graph below shows the top 100 wide receivers and tight ends in receiving yards last season, sorted by number of 20+ yard receptions. In addition, I have included the percent of their receptions that went for 20+ yards, the number of receptions that went for 10 or fewer yards, and that percent as well.
[continue reading…]

{ 10 comments }

The top QB/WR duo by touchdowns, and another top-10 combo.

Three years ago, I looked at the top quarterback/receiving pairings in terms of total passing touchdowns between the two players. Per a comment suggestion, let’s update that list today. The top two pairs have not changed, but there has been some movement in the top ten.

Philip Rivers and Antonio Gates have now connected for 84 passing touchdowns, all of which came in the regular season. The list below includes the playoffs, and Young and Rice have combined for 85 regular season touchdown passes and 7 playoff scores. That means Rivers and Gates are two more touchdowns away from the second most regular season touchdowns in NFL history. Gates is tied for 6th all time in receiving touchdowns (111) with Tony Gonzalez: despite that, Gates has connected with a touchdown more often with Rivers than Gonzalez has with both Matt Ryan and Trent Green combined.

There’s another tight end duo creeping up the list: Tom Brady and Rob Gronkowski have connected for 76 touchdowns, tied for fifth place on the list. Also at 76 touchdowns: Marques Colston and Drew Brees. The interesting note there: Colston retired without ever catching a touchdown pass from anyone besides Brees.

The table below shows the full list for combinations that have at least 25 touchdown strikes: [continue reading…]

{ 22 comments }

Peterson with a rare cameo by a good quarterback.

After a ten-year career with the Vikings, Adrian Peterson is now headed to New Orleans where he will get to play with Drew Brees.  It will be the second time Peterson has played with a Hall of Fame quarterback, after Brett Favre’s stint with the team beginning in 2009.

In ’09, the Vikings had a Relative ANY/A of +2.05, easily the best passing game the franchise has produced in the last decade.  In fact, the only other time in the last ten years that Minnesota had an above-average ANY/A was last year, when Peterson rushed for just 72 yards in three games.

Most of his time in Minnesota, though, the team’s passing attack has been below-average — or outright bad.  For example, in 2012, Peterson rushed for 2,097 yards.  That represented 17.9% of his career total, and it came when the Vikings had a Relative ANY/A of -0.94.  Overall Peterson has a weighted average RANY/A — i.e., the Vikings RANY/A in each season of Peterson’s career, weighted by the number of rushing yards Peterson had — for his career of -0.52.  Take a look. [continue reading…]

{ 6 comments }

More Thoughts On Pick Sixes

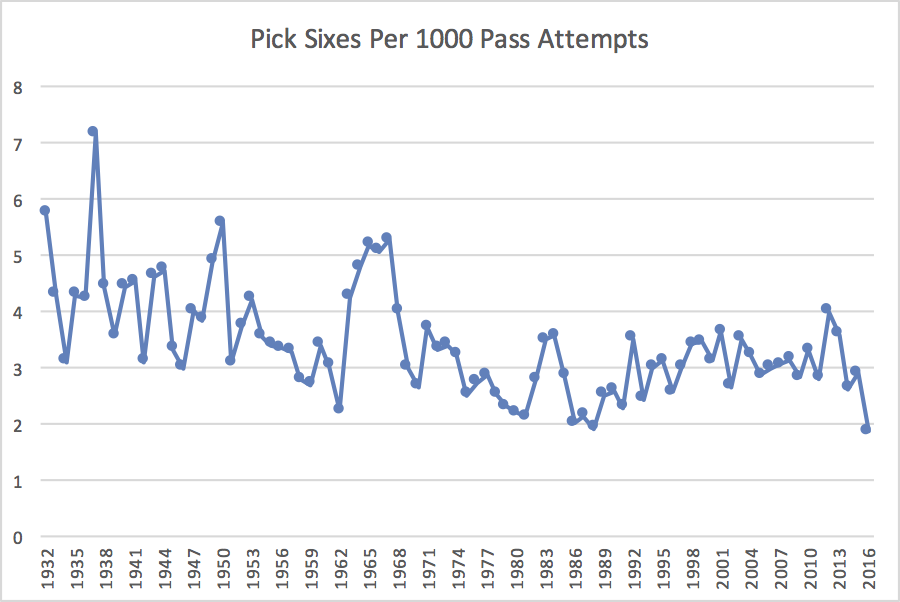
Four years ago, I wrote that interceptions were being returned for touchdowns at a much higher rate. As it turns out, that may have just been a blip: the 2012 season set a record for both pick sixes and pick sixes per interception.

We can look at pick sixes in a few ways. On Monday, I noted that on a per-game basis, interceptions per game were down to near-historic lows. Given that pass attempts are way up, you won’t be surprised to learn that pick sixes per attempt are really, really down.

The graph below shows the number of interceptions returned per 1,000 pass attempts throughout NFL history. Last year was the lowest in history, at 1.86; thought of another way, there was just one pick six for every 538 pass attempts.

[continue reading…]

{ 4 comments }

Return Touchdowns Were Way Down in 2016

Most years, there are about 3.5 to 4.0 return touchdowns per team season in the NFL, or about 115 in the entire NFL. But in 2016, there were just 73 return touchdowns, the fewest in a single season since 1988. I’m defining a return touchdown as a punt return, kickoff return, fumble return, or interception return for a score; this does exclude some unusual returns, such as a blocked field goal return, blocked punt return, missed field goal return, etc.

By this measure, the average team had just 2.3 return touchdowns last year. That’s a pretty unusually low number: [continue reading…]

{ 8 comments }

Adjusting Passer Rating for Era: Part V: The Results

Background reading:

Part I

Part II

Part III

Part IV

All week, I have been discussing how to adjust passer rating by era. Now that I have explained the formula, it’s time to generate the results. In a given season, ratings won’t change (unless a player moves below or above a limit as a result of the era adjustment), so the most interesting thing to do is to present career passer ratings.

To calculate career passer ratings, I first calculated each player’s passer rating in each season. Then, I created their career rating by averaging the player’s passer rating in each season, weighted of course by their number of attempts in that season. And now, the results.

The table below shows all 185 players with at least 1500 career pass attempts (this includes the 2016 season). Here is how to read the table below. Otto Graham is the career leader in era adjusted passer rating (this includes his AAFC time). He ranks 115th in career pass attempts with 2,626. Since passer rating is the sum of four variables multiplied by 100 and divided by 6, I figured we might as well present the era adjusted variables, too. In completion percentage, Graham scores a 1.40; in yards per attempt, he is at a whopping 1.53; in touchdown percent, 1.25, and in interception percentage, a remarkable 1.53. As a result, his era adjusted passer rating is 95.2. [continue reading…]

{ 17 comments }

There are no fewer than four problems with passer rating.

1. It does not adjust for era.

2. It only includes four variables — completion percentage, yards per attempt, touchdown rate, and interception rate — which means valuable information like sacks, first downs, and rushing are excluded.

3. The variables it does include are improperly weighted: a completion is worth 20 yards (too much), a touchdown is worth 80 yards (also too much), and an interception is worth -100 ways (again, too much).

4. Like nearly all non-proprietary formulas, it does not provide any situational context: an interception on 1st-and-goal from the 1 is the same as an interception on a Hail Mary, a 10-yard catch on 4th-and-9 is the same as a 10-yard catch on 3rd-and-30, etc.

These are just some of the reasons why passer rating is stupid. For reasons I can’t quite articulate, I only want to focus on solving the issue presented by problem number one. Yes, it may be silly to artificially tie one hand behind my back, but my goal here is not to come up with a new formula, but just to fix one specific issue with passer rating that everyone can acknowledge.

The past two days, I have been writing about passer rating. If you ignore the upper and lower limits in the formula, passer rating’s four variables can be re-written like this: [continue reading…]

{ 14 comments }

Larry Fitzgerald led the NFL in receptions this year, with 107. That’s good, but how important is leading the league in catches? The triple crown is thought of as the leaders in receptions, receiving yards, and receiving touchdowns, but I think we can all agree that receiving first downs is a better indicator of receiver play than receptions. If I was in charge of stats-keeping, I’d place far more emphasis of receiving first downs than receptions, because receptions that don’t go for first downs are far less valuable than receptions that do go for a first down. And while receptions may be a decent proxy for receiving first downs, there’s a lot of variance there.

The leader in receiving first downs this year was Mike Evans, and he certainly had a better statistical year than Fitzgerald.  Evans had a stat line of 96-1321-12, with 81 first downs, compared to Fitzgerald’s 107-1023-6 and 59 first downs.  That’s right: Evans had 22 more first downs on just 11 fewer grabs, thanks to his 84.4% first down rate compared to Fitzgerald’s 55.1%. Evans dominated the league in this metric, finishing with 15 more than anyone else. [1]Best as we can tell, the record for receiving first downs in a season was 92, shared by Calvin Johnson (2012) and Marvin Harrison (2002), until Julio Jones broke it last year with 93. Evans finished with 6 out of the 100 votes cast for the AP All-Pro team, which seems like a criminally low number that would be higher in first downs were as widely-reported as they should be.

In the interest of data disclosure, the table below shows the receptions, receiving yards, touchdowns, *and receiving first downs* for the top receivers last season. I have also included each player’s receiving first down percentage, and their total number of Adjusted Catch Yards, defined here as receiving first downs * 9, plus receiving yards, plus receiving touchdowns * 11 (because a receiving TD already gets 9 yards since it is counted as a first down, too). [continue reading…]

References

References
1 Best as we can tell, the record for receiving first downs in a season was 92, shared by Calvin Johnson (2012) and Marvin Harrison (2002), until Julio Jones broke it last year with 93.
{ 58 comments }

On average, the fumbling team has recovered 56% of all fumbles this year. But that hasn’t been the case with the Giants. New York has fumbled 11 times this year, which means you would expect them to recover 6.2 of those fumbles. But the Giants have 8 lost fumbles this year, which means the team has recovered only 3 of those 11 fumbles, or 3.2 fewer fumbles than expected.

That’s really bad, although not the worst in the league. Carolina has fumbled 7 times, so we would expect the Panthers to have recovered 3.9 of those fumbles. Instead? Carolina is 0-for-7, so the Panthers have recovered 3.9 fewer fumbles than expected.

But the Giants haven’t recovered the ball frequently when their opponent fumbles, either. New York’s opponents have 8 fumbles, so you would expect the Giants to have recovered 3.5 of them (or, stated another way, that their opponents should have recovered 4.5 of them). But Giants opponents have lost just one fumble this year, so New York has recovered 2.5 fewer fumbles than expected in this area of the game, too. Add it up, and that means the Giants have recovered 5.7 fewer fumbles than you would think. And that New York has recovered just 21% of all footballs to hit the ground in their games, regardless of the fumbling team

Here’s the data for all 32 teams through week 8 plus Thursday night. Here’s how to read the Steelers line. Pittsburgh has 9 fumbles of its own, but has only lost 2 fumbles, so the Steelers own fumble recovery percentage is a robust 78%, and Pittsburgh has recovered 2.0 more fumbles than expected. Meanwhile, Steelers opponents have 10 fumbles, and Steelers opponents have lost 5 of them, so the Steelers have recovered 50% of all fumbles here, too. [1]Note that “Opp FR%” means percentage of opponents fumbles that your team recovers. So Denver, at 72.7%, has recovered a lot of those fumbles. This means the Steelers have recovered 0.6 more fumbles than expected of their opponents, and therefore 2.6 more fumbles overall than expected. The final column shows that Pittsburgh has recovered 63.2% of all fumbles in play this year, second most to those always-lucky Browns. [continue reading…]

References

References
1 Note that “Opp FR%” means percentage of opponents fumbles that your team recovers. So Denver, at 72.7%, has recovered a lot of those fumbles.
{ 3 comments }

Let’s start with a piece of good news: I’ve created a 2016 Game Scripts page! On the top right of every page, there is a link to the 2016 Game Scripts, along with a dropdown option to view prior seasons.  Here’s a screenshot:

capture

So that’s the good news. The bad news is the Jets. In other news, Houston had the second-biggest comeback of the season as measured by Game Script: the Texans beat the Colts with a Game Script of -6.9. In many ways, this was more shocking than what the Chiefs did to the Chargers in week one (-10.3). That game was a 7-point contest with three minutes left; on Sunday Night Football, the Colts led by 14 with three minutes left, yet still managed to lose the game.

Let’s get to the Week 6 Game Scripts: [continue reading…]

{ 1 comment }

Previously:

Back in February, Mike Mularkey declared that his vision for Tennessee offense would be something best described as exotic smashmouth.  Then, the Titans passed on 2 out of every 3 plays in a week 1 loss to the Vikings.

Since then, Tennessee has been more run-heavy each week, culminating in a very run-heavy performance in week four. Against Houston, the Titans finished with 32 runs and 30 passes (tho that includes three Marcus Mariota scrambles), despite trailing for most of the game.  Tennessee had a Game Script of -5.8, yet was the only losing team with 30 rushing attempts this week.

Is it working? That’s tough to say: the Titans had 32 carries for 124 yards and 2 touchdowns, which sounds pretty good; meanwhile, Mariota had 196 net passing yards on 30 dropbacks with an interception and no touchdowns, which represents a league average NY/A gain.   So the running game may be a strength for the team, and the passing game may be a weakness; if that holds up, exotic smashmouth makes sense.

On the other hand, taking a big picture look at the Tennessee offense, and it is not good: The Titans are 31st in scoring, and that’s despite ranking 4th in rushing yards and 3rd in yards per carry.

Below are the week 4 game scripts data: [continue reading…]

{ 1 comment }

Today at 538: Is it time to freak out for fans in Carolina and Arizona?

The Carolina Panthers and Arizona Cardinals were the two most successful teams during the 2015 regular season. Carolina posted the league’s best-record, at 15-1, and led the league in scoring margin (+192). Arizona had the second-best record in the NFL (13-3) and finished with the second-best margin (+176). Carolina’s quarterback, Cam Newton, was selected as the league’s most valuable player and the first-team All-Pro quarterback by the Associated Press, while Arizona’s quarterback, Carson Palmer, received the second-most votes for that All-Pro slot.

The two teams met in the NFC championship game, with Carolina winning in a blowout, 49-15. And, of course, the Denver Broncos upset Carolina in the Super Bowl. But ugly performances by Carolina and Arizona in their final games of the 2015 season didn’t temper preseason expectations: NFL.com’s preseason power rankings had the Panthers and the Cardinals as its top two teams. But with both teams starting the 2016 season with a 1-3 record, is it time for panic?

You can read the full article here.

{ 6 comments }

Today at 538:

The Baltimore Ravens and Minnesota Vikings are both 3-0 to start the year, two of just five undefeated teams remaining in the NFL. But given the way that both teams have played so far, there are a lot of questions about how sustainable their success will prove to be as the season continues.

Let’s start with the Ravens. Although 27 other teams wish they had Baltimore’s record, I’m not sure 27 other teams wish they had Baltimore’s team. Being 3-0 is great, but the Ravens have managed to achieve their perfect record while racking up about as few style points as possible.

You can read the full article here.

{ 23 comments }

Yesterday, I looked at the best seasons in TD/INT Ratios after adjusting for era. Today? The worst, using the same formula.

Only one quarterback has ever qualified for the league passing crown but also failed to throw a touchdown: Bobby Hoying in 1998. That season is the only thing keeping rookie Ryan Leaf from the bottom of this table.

Here’s how to read it, using Leaf as an example. Leaf threw 2 TDs and 15 INTs in 1998, a 0.13 TD/INT Ratio on 245 passes. Leaf averaged 0.82 TD passes per 100 attempts – a laughably low number that is one of just four below 1.00 seasons — when the league average was 4.23. As a result, meaning he was at just 19% of league average. He threw 6.12 interceptions per 100 attempts, when the league average was 3.27, so he was at just 53% of league average. Multiply those two numbers (19%, 53%) and Leaf has a value of just 0.10, second worst in NFL history. That said, Hoying was so bad he would have needed two touchdown throws to move out of the cellar: [continue reading…]

{ 13 comments }

Tony Galbreath, A Forgotten Record Holder

Galbreath with the Saints

Galbreath with the Saints

Throughout his playing career, Walter Payton was chasing the ghost of Jim Brown.  At the end of the 1981 season, Payton was in 5th place on the career rushing list.  By ’82, he was in 4th; after ’83, he was up to 3rd place. Then, in 1984, Payton passed both Francos Harris and Brown to move into the top spot on the career rushing yards list.

But at the same time that he was chasing a much more flesh-and-blood figure: Saints/Vikings/Giants running back Tony Galbreath. Let’s jump in a time machine back to 1982. At that time, just seven players had at least 75+ career rushing attempts and 375+ career receptions. Three were Hall of Famers Bobby Mitchell, Charley Taylor, and Elroy Hirsch, but all three players made the HOF in large part because of their work as wide receivers. All three players entered professional football as running backs.

Crazy Legs switched after four years (and just one with the Rams) to become a wide receiver on the high-flying Rams of the early ’50s. Taylor was a running back his first two seasons — and a Pro Bowl one at that — but switched positions midway through the 1966 season and remained at wide receiver the rest of his career. Mitchell was stuck behind Brown in Cleveland, but it wasn’t until he was traded to Washington after his fourth season that he become a receiver.

A fourth member of the 75/475 list was Bobby Joe Conrad. who played with the Cardinals in the ’60s. He also switched positions early in his career, and turned into a star receiver almost immediately. As a result, only three true running backs were on the list: Lydell Mitchell, Rickey Young, and Joe Morrison. A star with the Giants in the ’60s, Morrison retired in 1972; he was still the career leader in receptions by a running back a decade later, with 395 receptions. Mitchell, a borderline HOF running back with the Colts, got up to 376 before retiring. Through age 29, he had 355 receptions and had topped 55 catches in each of his last five years; while he would have seemed like a lock to break Morrison’s record, he caught just two more passes the rest of his career.

That leaves Young, a fullback with the Chargers and Vikings. He caught a league-high 88 passes in ’78, and was at 387 receptions as of 1982. He turned 30 in 1983, his final season in the NFL, but caught another 21 passes, breaking Morrison’s record and retiring as the running back catch king, with 408 grabs. But Morrison didn’t retire with an easy stomach: both Payton and Galbreath were hot on his tails.

As of 1983, Payton, who entered the league in 1975, had 328 receptions. But Galbreath was already at 364 receptions, despite entering the NFL a year later. In ’84, Galbreath became just the second pure running back to hit the 400-catch mark; by ’85, Payton had become the third, and Galbreath had supplanted Morrison as the running back catch king. After ’86, Payton had really narrowed the gap: he had 459 career receptions, while Galbreath was at 464. Who would win up as the all-time running back catch king? That left the 1987 season as the battle ground for the highest of stakes: both Payton and Galbreath would retire after the season.

In the season opener, the duo squared off, with all eyes watching the race with a secondary battle between the Giants and Bears taking place. Payton caught three passes, giving him 462 for his career; Galbreath had just one, upping his total to 465.

By November 8th, Payton had closed the gap entirely: both players stood with 475 career receptions. The next week, Payton had a Pyrrhic victory: his Bears lost in Denver, but he became the running back catch king with the first of his three receptions that day (Galbreath had none). [continue reading…]

{ 5 comments }
Antonio Brown is the Steelers leader in touchdown celebrations

Antonio Brown is the Steelers leader in touchdown celebrations

Is Antonio Brown already the best wide receiver in Steelers history? That depends on how you define “best”, of course. But from at least one statistical standpoint, Brown already stands out as the most dominant.

One of my favorite simple methods to measure dominance is to measure receiving yards above the worst starter. For example, the 32nd-ranked player in receiving yards last year gained 922 receiving yards. Brown, meanwhile, had 1,834. As a result, he had 912 receiving yards above the “worst starter” last year.

In 2014, the 32nd-ranked receiving yards leader gained 916 yards; Brown had 1,698, so that’s +782. In 2013, Brown’s 1,499 yards were 603 yards above the baseline of 896, i.e., the amount of yards gained by the 32nd-ranked receiver.

In 2012, the baseline was 855 receiving yards; Brown, with 787 in 13 games, did not rank in the top 32 in receiving yards. Therefore, he gets a 0 for 2012. Finally, in 2011, Browns’ 1,108 receiving yards were 221 receiving yards above the threshold of 887 yards.

As a result, Brown’s six-year career looks like this: +912, +782, +603, 0, +221, 0. That sums to 2,518 yards above worst starter.

Last year, I looked at the leaders in Adjusted Catch Yards over worst starter using the same formula. I re-ran that methodology using receiving yards and pro-rating non-16 games to come up with a career list. The table below shows the top 200 players in football history using this methodology; Brown checks in at #31: [continue reading…]

{ 3 comments }

For over two decades, the Green Bay Packers have been lucky to have a Hall of Fame quarterback. How good have things been? Well, last year was only the third time since 1994 that the Packers finished below league average in Adjusted Net Yards per Attempt. But in general, Aaron Rodgers is the best quarterback in the league, and the return of Jordy Nelson should ensure another stellar year for Rodgers.

When discussing Green Bay’s passing attack in the days since the merger, you get a pretty stark split between the pre-Favre/Rodgers eras and the post-Favre/Rodgers eras.  The graph below shows the Packers Relative ANY/A — i.e., the team’s Adjusted Net Yards per Attempt minus the league average ANY/A — in every year since 1970: [continue reading…]

{ 7 comments }

A Tale Of One Season

Let’s review the season of a mystery team from last year. This team had a pretty difficult schedule, but wound up with an average record. Here is how things broke down, starting with the good.

  • Mystery team played two home games against teams in the bottom quarter of the league (all team ratings in this post are using SRS). Those are the games where an average team should do well, and in fact, those were the only two games all year that the team won by double digits.
  • Mystery team had three other games where an average team would be “expected” to win based on strength of opponent and game location: Mystery team went 3-0 in those games, with an average margin of victory of 5.3 points.

But things were not so simple for our mystery team all year.

  • Mystery team played five games against teams in the top quarter of the NFL. The result? An 0-5 record, with an average margin of defeat of 16.4 points.
  • The remaining six games were ones where an average team would be “expected” to lose based on strength of opponent and game location, but were not against top-8 teams.  Mystery team had an average points differential of -3.7 in those games, and a 2-4 record.

To recap, Mystery team blew out the bad teams, beat the below-average teams, lost to the above-average teams, and was blown out by the great teams.  That, I think, is as unexciting as a season narrative can get.  But if a team goes 1-7 to start the season, and then 6-2 to finish, it’s easy to spin the “tale of two halves” narrative. [continue reading…]

{ 3 comments }

Adjusted Completion Percentage

In 1991, Dave Krieg led the NFL in completion percentage. He completed a career-high 65.6% of his passes, and while that mark was very good for that era, it doesn’t mean Krieg was great that season. In fact, he arguably wasn’t even good: Krieg actually finished just 24th in ANY/A that year.

One reason, I think, that Krieg was able to lead the NFL in completion percentage is because Krieg “ate” a lot of his incomplete passes. What do I mean by that? Krieg took a ton of sacks — he was sacked every ten times he dropped back to pass. When under duress, some quarterbacks eat the ball, to avoid an interception; that’s bad (well, it’s better than n interception) but it doesn’t get graded that way when calculating completion percentage. Other quarterbacks will throw the ball away; that’s good (assuming it isn’t intercepted) because no yards are lost, but it does hurt the quarterback’s completion percentage.

Even ignoring the yards lost due to sacks, fundamentally, a sack is no better than an incomplete pass. So why are quarterbacks who take sacks rather than throw the ball out of bounds given an artificial boost when it comes to completion percentage? Well, that’s largely just an artifact of how the NFL always graded things. The NFL was not always good at recording metrics, and somewhere along the way, sacks were either included as running plays, ignored, or included as pass plays. I don’t think a lot of thought went into it, but in my view, it makes the most sense to include sacks in the denominator when calculating completion percentage. Otherwise, we give undue credit to quarterbacks that take a lot of sacks, and penalize quarterbacks who throw the ball away when under pressure. [continue reading…]

{ 35 comments }

Today’s post is a follow-up to my recent article on adjusting quarterback stats for schedule length and passing environment. In the original piece, I provided you with single-season stats with various era adjustments made. While my main goal was to glean as much as I could from your opinions, I noticed that some readers also liked looking at the different results based on which adjustments I made. With that in mind, I figured it only made sense to submit the career list as well.

When measuring single seasons, I think value over average is the way to go. However, I believe a lower baseline is in order when looking at entire careers. It seems to me that average play is an overlooked aspect of quarterback evaluation, and guys like Brett Favre or John Elway are significantly underrated by statistical models that compare to league average instead of replacement level. I would say that using a higher threshold shows us who was the most dominant, while using a lower threshold shows us who contributed the most value over an extended period. [continue reading…]

{ 45 comments }

Shouldn't this guy be in the HOF?

Shouldn’t this guy be in the HOF?

In Brad Oremland’s latest post on wide receivers — and you should really be following the whole series — we got into a bit of a debate on Charlie Joiner in the comments. I’m not ready to provide my full analysis, but I thought I would start with presenting some data. And the quickest and easiest starting point is a gray ink test based on receiving yards.

The way it works is simple. For finishing first in a category, a player gets 10 points; for finishing 2nd, he gets 9 points; for 3rd, he gets 8 points, and so on. I did the same thing when analyzing Eli Manning and whether or not he was HOF-worthy (spoiler: he was not).

Joiner does not fare terribly here, but he doesn’t do all that well, either. He ranked 4th in receiving yards in 1980, so that is worth 7 points. His 6th-place finish the next year is worth 5 points, and his 3rd-place finish in 1976 is worth 8 points. That totals 20 points: it’s ahead of a number of HOF receivers (Lynn Swann, Fred Biletnikoff, Paul Warfield, Art Monk, Charley Taylor, and Andre Reed being the most notable), but it also ranks behind a lot of really good receivers not in the Hall of Fame. That includes contemporaries like Cliff Branch, Harold Jackson, and Drew Pearson. The table below shows every player with at least 14 points of Gray Ink: [continue reading…]

{ 5 comments }

A quick data dump today following up on yesterday’s post. The table below shows the percentage of receiving yards gained by 1st-year, 2nd-year, 3rd-year…. and 11th-year and more senior NFL players, in each year since 1950 (excluding 1987). [continue reading…]

{ 2 comments }

Recently, I posted a quick and dirty method to measure quarterback career value above average and above replacement. I used Adjusted Yards per Pass Attempt as the foundational stat because its inputs (yards, touchdowns, interceptions, and attempts) are on record back to 1932.

Today, I wanted to use the same model with Adjusted Net Yards per Dropback (ANY/A) as the base metric. I believe ANY/A is a more accurate reflection of quarterback production, but it does have the downside of only being recorded back to 1969 in Pro Football Reference’s database.

Thus, while the previous post covered every passer in the official stat era, this post will only cover value added since 1969. This means greats like Sammy Baugh and Sid Luckman are completely overlooked, while legends like Johnny Unitas and Joe Namath only have their worst years included (an unfortunate byproduct of this study’s limitations, to be sure).

In case you didn’t want to click back through the previous article to see the details of the formula, I’ll briefly cover the basics here: [continue reading…]

{ 41 comments }

NFL Gray Ink Sack Leaders

Watt has a lot of gray ink in a short amount of time

Watt has a lot of gray ink in a short amount of time

Gray Ink tests are fun ways to measure player dominance by giving some — but not too much — credit to longevity. In simplest form, gray ink tests give 10 points for finishing 1st in a category, 9 points for finishing 2nd, and so on. Let’s use Kevin Greene, third all-time (shorthand for since 1982, of course) in career sacks with 160, and Bruce Smith, the career leader with 200, as examples.

Smith was the better player — he was an 11-time Pro Bowler and an 8-time AP first-team All-Pro, compared to just 5/2 for Greene — and consequently was a clear first-ballot Hall of Famer. For whatever reason, it took Greene 12 years, but this summer, he will finally be inducted into the Hall. Given the fact that Smith has 25% more career sacks than Greene, you probably think that Smith was the better pass rusher. To that, the Gray Ink test says not so fast, my friend. [continue reading…]

{ 28 comments }

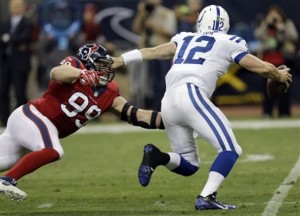
The best player in the AFC South is in this photo.

The best player in the AFC South is in this photo.

Good article from Peter King this morning on J.J. Watt and the injury struggles he dealt with last year.  King also noted that Watt has 69 sacks over the last four seasons, the most in the NFL.  In fact, that’s the second most by any player in any four-year stretch over at least the last 31 years. FRom 1985 to 1988, Reggie White had 70 sacks, and he did it in seven fewer games (he missed the first three games of ’85 due to being a member of USFL, [1]The Eagles, after starting 0-2, paid a million dollars to Memphis to essentially buy White from the league. and then four games in ’87 due to the players’ strike.)  Of course, White did play in a friendlier era for sacks (2.63 sacks per game vs. 2.37 over the last four years), so cross-era comparisons always have their limitations.

But I thought it would be interesting, especially in light of Jared Allen retiring, to look at the leaders in sacks on a trailing four year basis: [continue reading…]

References

References
1 The Eagles, after starting 0-2, paid a million dollars to Memphis to essentially buy White from the league.
{ 12 comments }

More Thoughts on the Jaguars Passing Attack

Over the last couple of days, I’ve been looking at measuring the age of a team’s passing attack. On Friday, I noted that the Jaguars had the 2nd youngest passing offense in the NFL behind only Tampa Bay. And yesterday, I measured the youngest passing offenses in football history, with Jacksonville checking in at #20.

The Jaguars threw for 4,428 gross passing yards last season (or, 8,856 combined passing/receiving yards), though, so that makes them a bit more of an outlier. The table below shows all teams with at least 8,500 combined passing/receiving yards, and ranks them in ascending order based on average age: [continue reading…]

{ 2 comments }

Yesterday, I measured the age of each team’s passing attack by calculating the yards-weighted age of each player who gained either a passing or receiving yard. Today, the historical results.

I’ve written a bit about Terry Bradshaw and his terrible rookie season of 1970, mostly in the context of number one picks taking a long time to break out. But here’s something that often gets lost in the mix: Bradshaw was just one of many inexperienced players on the ‘70 Steelers.

Bradshaw played as a rookie that year at age 22 (Terry Hanratty also started 6 games, and was also 22). The top 6 players in receiving yards on the ’70 Steelers were wide receiver Ron Shanklin (age 22), wide receiver Dave Smith (23), tight end Dennis Hughes (22), fullback John Fuqua (24), wide receiver Hubie Bryant (22), and wide receiver Jon Staggers (22). Incredibly, five of those six players were rookies, with Frenchy Fuqua being the sole exception — and he was drafted in 1969! In the ’70 draft, Pittsburgh took Bradshaw with the 1st overall pick, drafted Shanklin at 28, Staggers in the 5th round, and Smith in the 8th round, while both Hughes and Bryant were undrafted free agents that year. That’s unbelievable, and makes the ’70s Steelers passing attack akin to an expansion team — or rather, an expansion team with almost no access to the veteran market. As a result, Pittsburgh’s 1970 passing attack ranks as the youngest in history: [continue reading…]

{ 5 comments }

AV-Adjusted Team Age (Defense) from 2012-2015

Part of the last non-awful Bears defense

Part of the last non-awful Bears defense

Background:

I thought it would be fun to do a quick checkdown and look at the AV-Adjusted team age for each defenses over the last four years. Here’s how to read the table below, using the Bears as an example. In 2012, Chicago’s average age on defense was 29; in 2013, it was 27.7, then 27.5, and finally, 26.1 last season. That means the Bears average age has had a variance of 1.1 years, the second largest in the data set behind only San Diego. [continue reading…]

{ 2 comments }

Bob Ford, a longtime fan of Pro-Football-Reference and Football Perspective, has contributed a 2-part guest post on Yards Per Carry Leaders. Bob is the owner and founder of GOATbacks.com, which looks at the greatest running backs of all time. Thanks to Bob for today’s (and tomorrow’s) article!


I’ve been curious about YPC leaders over the years, particularly as they’re sorted through increasing numbers of carries. Over the next two days, I will look at the YPC leaders using six different carry minimum thresholds: 100, 120, and 150 today, and 180, 220, and 280 carries tomorrow. These cutoffs weren’t arrived at in an analytically rigorous way, just through instinct and personal judgment. I ran a number of different carry thresholds and simply tried to keep my statistical eyes peeled; in my view, these are at least 6 of the minimums where interesting changes seemed to emerge.

As a general rule, though not an absolute one, I’m in the camp that regards YPC as, at best, a questionable stat when it comes to assessing skill and performance, and at worst a misleading and even bunkum stat, to borrow a term from Chase and the crew over at Intentional Rounding. Don’t get me wrong, I’m not suggesting YPC is useless. In fact in some narrow contexts I think it’s even key. But I think it’s woefully overused and over relied on, and I do regard it with suspicion when it comes to assessing rushing and running back value and effectiveness, particularly in “real-game” situations. I think the same holds for mobile quarterbacks, too.

I decided to look at YPC leaders for the 46 seasons since the merger was completed, 1970-2015. Again, no special reason, just to make things more manageable. This would probably get really interesting if we included all pre-merger seasons, but I didn’t do that here. If anyone does, kudos. At any rate, here are the YPC leaders since 1970, sorted at 6 different carry thresholds. [continue reading…]

{ 1 comment }

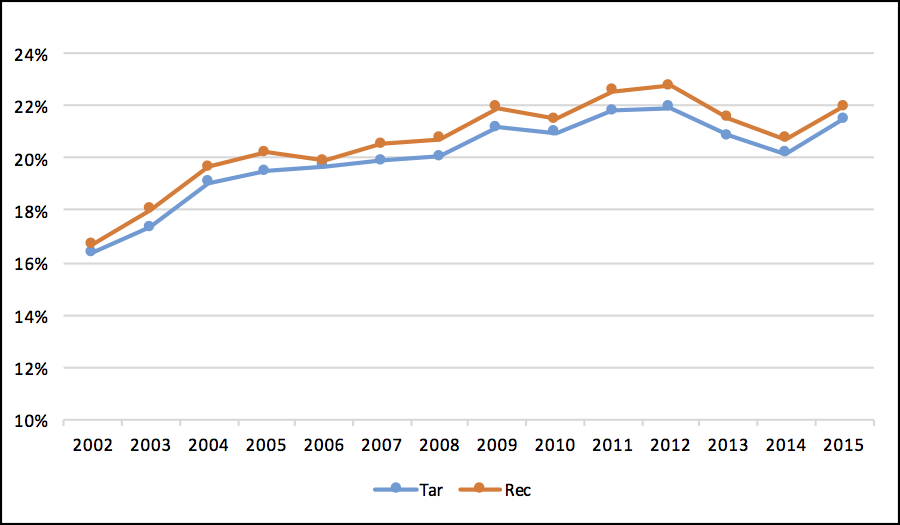
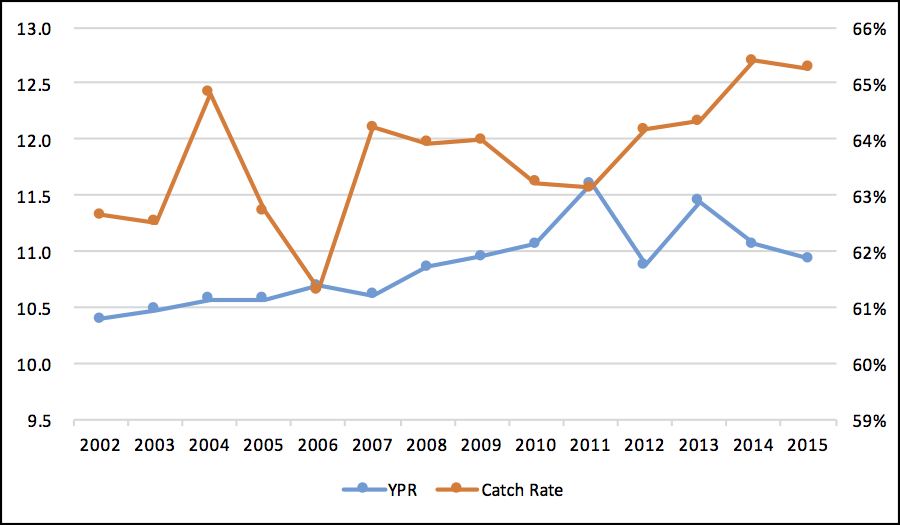
Yesterday, I posted some graphs on league-wide passing distribution. In that post, I noted that tight ends grabbed about 16% of all receiving yards in 2002-2003, but that number has increased to over 20% in recent years.  But that’s just receiving yards: as you might expect, targets and receptions have seen a similar climb:

te rec tar
But more targets aren’t the only thing driving the increase.  Tight ends are also averaging slightly more yards per catch, too.  That increase has come despite the general decrease in yards per completion, so this may be a sign that tight ends are more athletic than they were 15-20 years ago, and that teams are sending them on more downfield rights.  In addition, catch rate has also been increasing, although in a more volatile way; still, tight ends are catching more passes, at higher rates, and for more yards.  In the picture below, yards per reception is plotted against the left Y-Axis, and catch rate is plotted against the right Y-Axis.
tar catch rate

Whatever the reason, tight ends seem to be a larger part of NFL offenses they were a decade ago, and for good reason: they’re getting better.

{ 1 comment }
Next Posts Previous Posts